. 2021 Aug;35(8):2243-2257.
doi: 10.1038/s41375-020-01109-w. Epub 2021 Jan 7.

A modular and controllable T cell therapy platform for acute myeloid leukemia

Affiliations

A modular and controllable T cell therapy platform for acute myeloid leukemia

Mohamed-Reda Benmebarek et al. Leukemia. 2021 Aug.

Abstract

Targeted T cell therapy is highly effective in disease settings where tumor antigens are uniformly expressed on malignant cells and where off-tumor on-target-associated toxicity is manageable. Although acute myeloid leukemia (AML) has in principle been shown to be a T cell-sensitive disease by the graft-versus-leukemia activity of allogeneic stem cell transplantation, T cell therapy has so far failed in this setting. This is largely due to the lack of target structures both sufficiently selective and uniformly expressed on AML, causing unacceptable myeloid cell toxicity. To address this, we developed a modular and controllable MHC-unrestricted adoptive T cell therapy platform tailored to AML. This platform combines synthetic agonistic receptor (SAR) -transduced T cells with AML-targeting tandem single chain variable fragment (scFv) constructs. Construct exchange allows SAR T cells to be redirected toward alternative targets, a process enabled by the short half-life and controllability of these antibody fragments. Combining SAR-transduced T cells with the scFv constructs resulted in selective killing of CD33+ and CD123+ AML cell lines, as well as of patient-derived AML blasts. Durable responses and persistence of SAR-transduced T cells could also be demonstrated in AML xenograft models. Together these results warrant further translation of this novel platform for AML treatment.


Conflict of interest statement

SK, CK, and SE are inventors of several patents in the field of immuno-oncology including one patent application on the SAR platform. SK and SE received research support from TCR2 Inc and Arcus Bioscience for work unrelated to this manuscript. Parts of this work have been performed for the doctoral thesis of MRB at the Ludwig-Maximilians-Universität München. The authors declare no other conflict of interest.

Figures
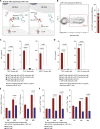
Fig. 1
Fig. 1. SAR T cells can be bound and triggered by tandem scFvs to induce T cell activation and proliferation.
A Schematic overview of the SAR construct as well as the modular composition of anti-E3–anti-CD33 and anti-E3–anti-CD123 molecules and CD33 and CD123 target structures. B Transduction efficiency flow cytometry plot and SAR expression data in T cells from healthy donors. C SAR and unt T cells were cocultured with THP-1, PL-21, or MV4-11 tumor cells and anti-E3–anti-CD33 molecule, with hIFN-γ readout 48 h after coculture. D SAR and unt T cells were cocultured with THP-1 or MV4-11 tumor cells and anti-E3–anti-CD123 molecule, with hIFN-γ readout 48 h after coculture. E The proliferation rate of the T cells was determined by flow cytometry analysis with surface staining for CD3, CD4, CD8, and EGFR after coculture. F SAR and UT T cells were cocultured with MV4-11 tumor cells at a 10:1 E:T ratio. Anti-E3–anti-CD33 taFv was added at a concentration of 1 μg/ml. Readouts were carried out at 0, 24, and 48 h time-points. PD-1 expression of SAR and UT CD4+ and CD8+ T cells over time (0, 24, and 48 h) is shown. Statistical analysis was performed with unpaired two-tailed Student’s t test. Experiments in subfigures (BF) show mean values ± SEM and are representative of three independent experiments.
Fig. 2
Fig. 2. SAR T cells selectively form functional immunological synapses to mediate efficient tumor cell lysis.
A SAR and unt T cells were cocultured with THP-1, PL-21, or MV4-11 tumor cells with anti-E3–anti-CD33. Following coculture, the BioGlo Luciferase assay was used to calculate the percentage of cells lysed—values shown were normalized to the AML only control condition which was taken as 0 % lysis. B SAR or unt T cells were cocultured with THP-1 tumor cells in a V-well plate before transfer to a poly-L-lysine-coated slide. Cells were allowed to adhere for 30 min before fixation and permeabilization. The percentage of T cells conjugated with tumor cells was quantified, as well as the percentage of those conjugates with a polarized MTOC. C Double Immunofluorescence labeling was carried out to characterize the polarization of the MTOC, Granzyme B, LFA-1 and F-actin at the SAR T cell IS. For statistical analysis the unpaired two-tailed Student’s t test was used. Experiments in subfigures (A and B) show mean values ± SEM and are representative of at least three independent experiments. Subfigure (D) is representative of three independent experiments. Leica TCS SP5 confocal system with a HCX PL APO CS 63x/1.4 oil objective was used for image acquisition on Leica application suite v2.7.3.9723. Tumor cells were GFP positive. Fluorochromes used: MTOC (AF594) Granzyme B (AF647); F-actin (AF647); LFA-1 (AF647); Lck (AF647). For z-axis image reconstruction (stacking) confocal sections were taken 0.2 µm apart.
Fig. 3
Fig. 3. Modular, selective and reversible activation of SAR T cells and their applied safety switches.
A SAR T cells were serially titrated (1:40, 1:60, 1:80, 0:100) in a PBMC mix. Cells were then cocultured with MV4-11 tumor cells (E:T 10:1), with either a pan-T cell (anti-CD3–anti-CD33, 1 μg/ml) or a SAR-specific molecule (anti-E3–anti-CD33, 1 μg/ml). B MV4-11 tumor cells were repeatedly cocultured with SAR T cells with or without redosage of the constructs (1 μg/ml). Anti-CD33 CAR T cells were used as a control and cocultured with tumor cells following the same procedure (no taFv was added) (E:T 10:1). C A modularity stress test was carried out using anti-E3–anti-CD33 and anti-E3–anti-CD123 molecules (1 µg/ml). SAR or unt T cells were cocultured with THP-1 tumor cells (E:T 10:1). Readouts were carried out at 24 or 48 h. At assay start, cocultures received either anti-E3–anti-CD33 molecules, anti-E3–anti-CD123 molecules, or no molecules. At 24 h, cocultures were either redosed with the same taFv, redosed with the other taFv against a different target, dosed for the first time with either molecule, or not redosed after initial dosing. At each time point, supernatants were collected and subjected to a hIFN-γ ELISA readout. For statistical analysis, the unpaired two-tailed Student’s t test was used. Experiments show mean values ± SEM and are representative of three independent experiments.
Fig. 4
Fig. 4. SAR–taFv combination can activate SAR T cells to mediate specific cytotoxicity against patient AML blasts and LSCs.
A Patient-derived AML blasts targeted by SAR T cells (E:T 1:1) and an anti-E3–anti-CD33 taFv (1 µg/ml), or with controls (SAR T cells and patient blasts, unt T cells with anti-E3–anti-CD33 and patient blasts, unt T cells and patient blasts). In a long-term coculture assay set-up, flow cytometry-based readouts were taken after 3, 7, and 10 days. Cells were stained for CD2 and CD33, to differentiate the T cells and AML blasts respectively. B The percentage lysis of patient-derived AML blasts (n = 11) by SAR T cells and taFv was calculated as a ratio and compared to unt cells and AML blasts. C Patient-derived AML blasts targeted by autologous SAR T cells (E:T 1:1) and either an anti-E3–anti-CD33 taFv (1 µg/ml) or an anti-E3–anti-CD123 taFv (1 µg/ml), or with controls (SAR T cells and patient blasts, unt T cells with either taFv and patient blasts, unt T cells and patient blasts). In a coculture assay set-up, flow cytometry-based readouts were taken after 3 days. Cells were stained for CD2 and CD33, to differentiate the T cells and AML blasts respectively. D Following coculture (at day 3), T cells were also stained for CD69, PD-1 and TIM-3. E Short-term coculture (18 h) assays were set-up between 5 × 105 patient blasts and SAR T cells (E:T 1:1) and an anti-E3–anti-CD33 (1 µg/ml) or an anti-E3–anti-CD123 (1 µg/ml) molecule, or with controls (SAR T cells only, anti-E3–anti-CD33 and anti-E3–anti-CD123 molecules only, patient blasts only, unt T cells with anti-E3–anti-CD33 and anti-E3–anti-CD123 molecules, unt T cells with AML blasts). To show efficiency of LSC killing, blasts were stained for CD45, CD34, and CD38, and lysis of the CD34+CD38- LSC population was quantified as a ratio over unt T cells with patient blasts as a control condition. F Representative flow cytometry plots from coculture experiment described in subfigure (E). For statistical analysis, the paired two-tailed Student’s t test was used. Experiments show mean values ± SEM. Experiments in subfigures (A, B, and D) are representative of six independent long term coculture (LTC) experiments, with multiple patients used per LTC. Experiments in subfigure (C) are representative of two independent coculture experiments, with two to three patients used per coculture. Experiments in subfigure E are representative of four independent short term coculture experiments. Patient information for each experiment is listed in supplementary Table 2. CD33 and CD123 patient expression data is depicted in supplementary Fig. 4.
Fig. 5
Fig. 5. Treatment with the SAR–taFv combination can efficiently eradicate leukemia and enhance survival in vivo.
A Schematic overview of the experimental setup for (B and C). NSG mice were inoculated i. v. with 2 × 106 MV4-11-LUC-GFP tumor cells. Mice were treated with a single i. v. injection of T cells. Antibody treatment was given by several i. p. injections of the anti-E3–anti-CD33 molecule (2.8 μg/injection) or a control anti-E3–anti-CD19 molecule (2.8 μg/injection), as indicated by the arrows in the figure. Treatment groups were as follows: SAR T cells and anti-E3–anti-CD33 (n = 7), SAR T cells and anti-E3–anti-CD19 (n = 6), SAR T cells only (n = 5), anti-E3–anti-CD33 only (n = 6), PBS (n = 6), and anti-CD33 CAR T cells (n = 5). B Percentage survival readout. † indicates sacrifice of mice suffering from CAR-related toxicity. C In vivo imaging data displaying luminescent signal in counts for all experimental groups from treatment day onwards (Days 0, 7, 14, 17, 21, 28, and 42). D Schematic overview of the experimental setup for (E and F). NSG mice were inoculated i. v. with 106 THP-1-LUC-GFP tumor cells. Mice were treated with a single i. v. injection of T cells with or without the anti-E3–anti-CD33 molecule (2.8 μg /injection) or a control anti-E3–anti-CD19 molecule (2.8 μg /injection). Treatment groups were as follows: SAR T cells and anti-E3–anti-CD33 (n = 5), SAR T cells and anti-E3–anti-CD19 (n = 5), SAR T cells only (n = 5), anti-E3–anti-CD33 only (n = 5), and PBS (n = 5). F Percentage survival readout. G In vivo imaging data displaying luminescent signal in all experimental groups from treatment day onwards (Days 0, 24, 28, 38, 45, 52). For statistical analysis of survival data, the log-rank test was applied. All in vivo experiments were carried out twice. One representative experiment is shown per xenograft model.

References

    1. Estey EH. Acute myeloid leukemia: 2014 update on risk-stratification and management. Am J Hematol. 2014;89:1063–81. doi: 10.1002/ajh.23834. - DOI - PubMed
    1. Yilmaz M, Wang F, Loghavi S, Bueso-Ramos C, Gumbs C, Little L, et al. Late relapse in acute myeloid leukemia (AML): clonal evolution or therapy-related leukemia? Blood Cancer J. 2019;9:7. doi: 10.1038/s41408-019-0170-3. - DOI - PMC - PubMed
    1. Yeung YA, Krishnamoorthy V, Dettling D, Sommer C, Poulsen K, Ni I, et al. An optimized full-length FLT3/CD3 bispecific antibody demonstrates potent anti-leukemia activity and reversible hematological toxicity. Mol Ther. 2020;28:P889–900. doi: 10.1016/j.ymthe.2019.12.014. - DOI - PMC - PubMed
    1. Lim WA, June CH. The principles of engineering immune cells to treat cancer. Cell. 2017;168:724–40. doi: 10.1016/j.cell.2017.01.016. - DOI - PMC - PubMed
    1. Rosenberg SA, Restifo NP. Adoptive cell transfer as personalized immunotherapy for human cancer. Science. 2015;348:62–8. doi: 10.1126/science.aaa4967. - DOI - PMC - PubMed

Publication types

Substances