. 2021 Jan;53(1):54-64.
doi: 10.1038/s41588-020-00751-5. Epub 2021 Jan 7.

A cross-platform approach identifies genetic regulators of human metabolism and health

Collaborators, Affiliations

A cross-platform approach identifies genetic regulators of human metabolism and health

Luca A Lotta et al. Nat Genet. 2021 Jan.

Abstract

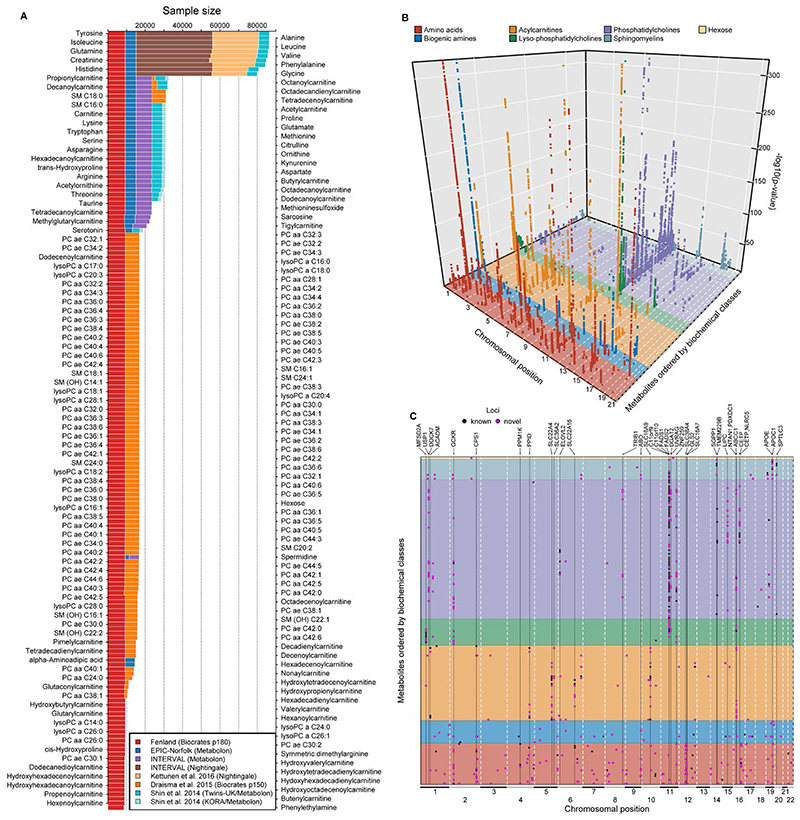
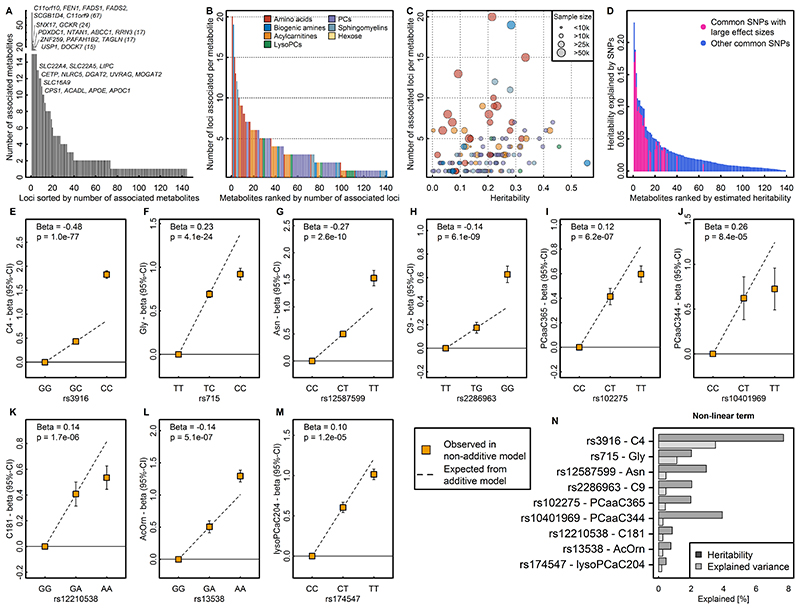
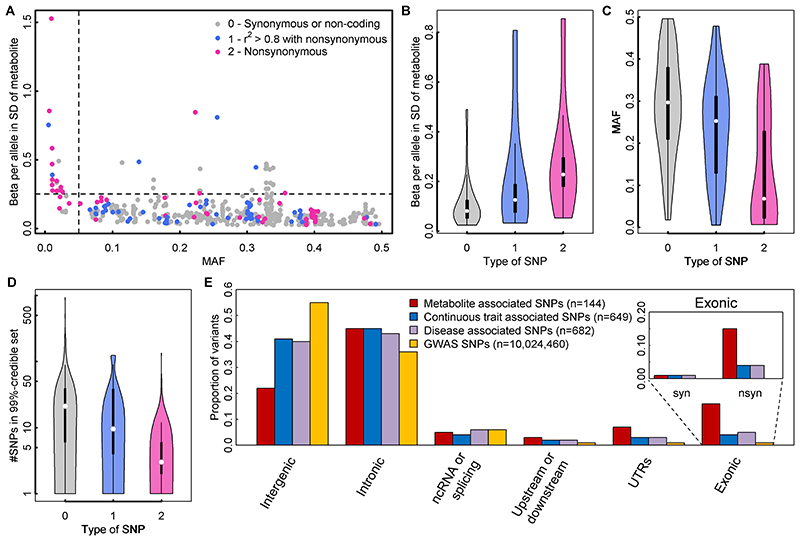
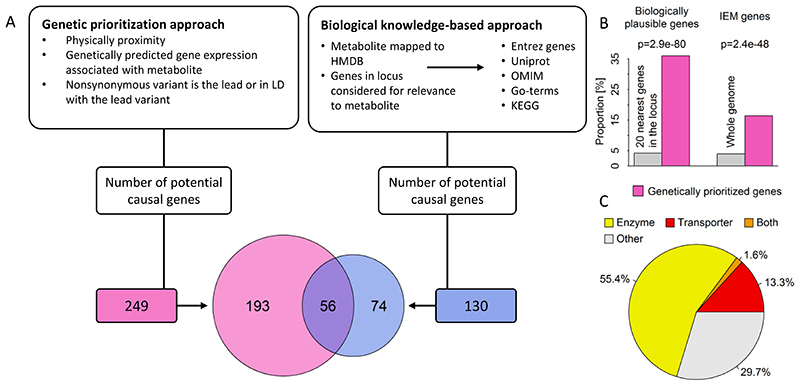
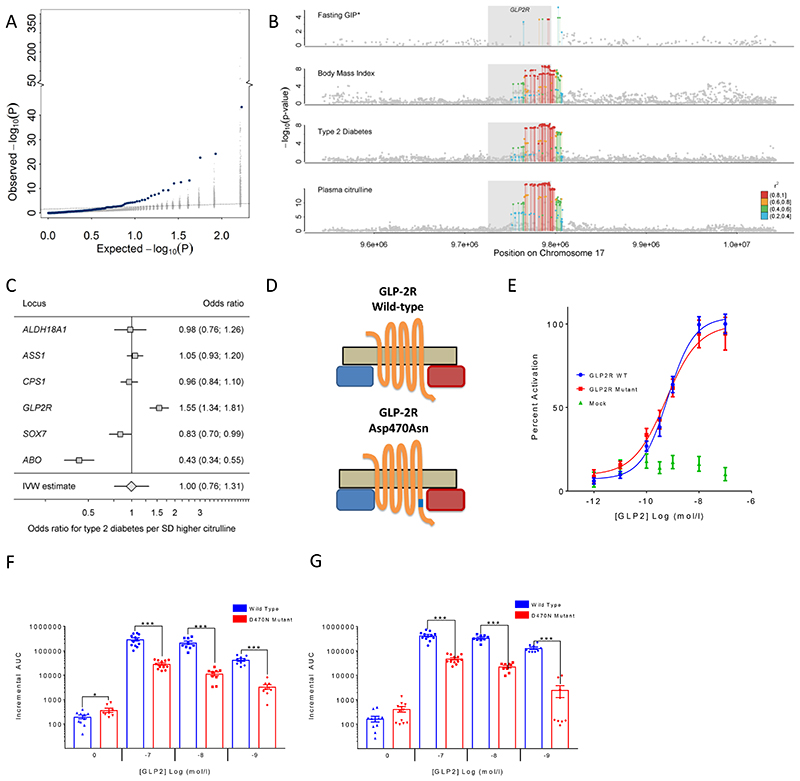
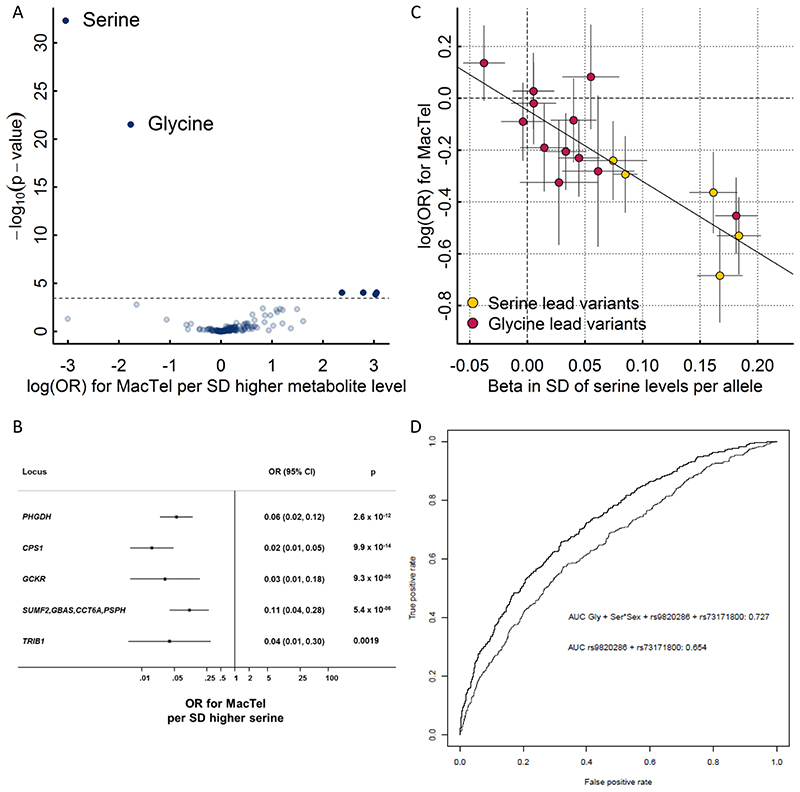
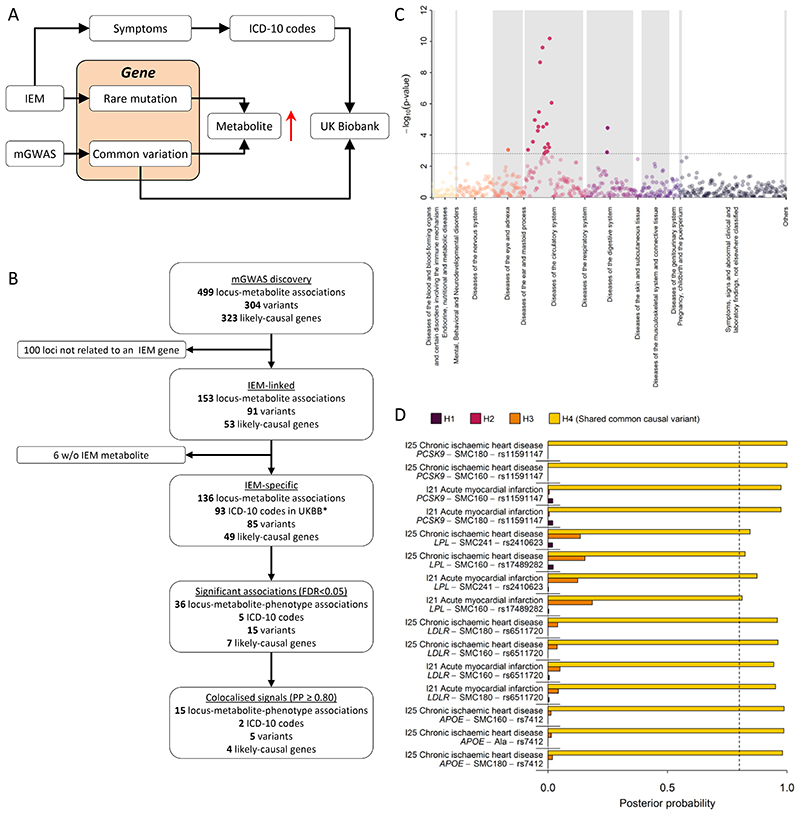
In cross-platform analyses of 174 metabolites, we identify 499 associations (P < 4.9 × 10⁻¹⁰) characterized by pleiotropy, allelic heterogeneity, large and nonlinear effects and enrichment for nonsynonymous variation. We identify a signal at GLP2R (p.Asp470Asn) shared among higher citrulline levels, body mass index, fasting glucose-dependent insulinotropic peptide and type 2 diabetes, with β-arrestin signaling as the underlying mechanism. Genetically higher serine levels are shown to reduce the likelihood (by 95%) and predict development of macular telangiectasia type 2, a rare degenerative retinal disease. Integration of genomic and small molecule data across platforms enables the discovery of regulators of human metabolism and translation into clinical insights.


Conflict of interest statement

Competing Interests statement

A.S.B. has received grants from AstraZeneca, Biogen, Bioverativ, Merck, Novartis, and Sanofi. J. D. sits on the International Cardiovascular and Metabolic Advisory Board for Novartis (since 2010), the Steering Committee of UK Biobank (since 2011), the MRC International Advisory Group (ING) member, London (since 2013), the MRC High Throughput Science ‘Omics Panel Member, London (since 2013), the Scientific Advisory Committee for Sanofi (since 2013), the International Cardiovascular and Metabolism Research and Development Portfolio Committee for Novartis and the Astra Zeneca Genomics Advisory Board (2018). E.B.F. is an employee and stock holder of Pfizer.

Figures

Figure 1
Figure 1
A Sample size by contributing study and technique for each of the 174 metabolites included. B A three-dimensional Manhattan plot displaying chromosomal position (x-axis) of significant associations (p <4.9×10⁻¹⁰, z-axis) across all metabolites (y-axis). Colours indicate metabolite groups. C A top view of the 3D-Manhattan plot. Dots indicate significantly associated loci. Colours indicate novelty of metabolite – locus associations. Loci with indication for pleiotropy have been annotated.
Figure 2
Figure 2
A Distribution of pleiotropy, i.e. number of associated metabolites, among loci identified in the present study. B Distribution of polygenicity of metabolites, i.e. number of identified loci for each metabolite under investigation. C Scatterplot comparing the estimated heritability of each metabolite against the number of associated loci. Size of the dots indicates samples sizes. D Heritability estimates for single metabolites. Colours indicate the proportion of heritability attributed to single nucleotide polymorphisms (SNPs) with large effect sizes (β>0.25 per allele). E – M SNP – metabolite association with indication of non-additive effects. Beta is an estimate from the departure of linearity. N Barplot showing the increase in heritability and explained variance for each SNP – metabolite pair when including non-additive effects.
Figure 3
Figure 3
A Scatterplot comparing the minor allele frequencies (MAF) of associated variants with effect estimates from linear regression models (N loci=499). Colours indicate possible functional consequences of each variant: maroon – nonsynonymous variant; blue – in strong LD (r2>0.8) with a nonsynonymous variant and grey otherwise. B-D Distribution of effect sizes (B), allele frequencies (C), and width of credible sets (D) based on the type of single nucleotide polymorphism (SNP) (0 – non-coding or synonymous, 1 – in strong LD with nonsynonymous, 2 - nonsynonymous). E Distribution of functional annotations of metabolite associated variants (red), trait-associated variants (blue – continuous, purple – diseases) obtained from the GWAS catalogue, and all SNPs included in the present genome-wide association studies. The inlet for exonic variants distinguishes between synonymous (syn) and nonsynonymous variants (nsyn).
Figure 4
Figure 4
A Comparison between the hypothesis-free genetically prioritized versus biologically plausible approaches used in the present study to assign candidate genes to metabolite associated single nucleotide polymorphisms. The Venn-diagram displays the overlap between both approaches. B Enrichment of genetically prioritized genes among biologically plausible or genes linked to inborn errors of metabolism (IEM). C Proportion of genetically prioritized genes encoding for either enzymes or transporters.
Figure 5
Figure 5
A Enrichment of associations with type 2 diabetes (T2D: 80,983 cases, 842,909 controls) among metabolite-associated SNPs. Blue dots indicate metabolite-SNPs and grey dots indicate a random selection of matched control SNPs. B Regional association plots for plasma citrulline, type 2 diabetes, body mass index, and fasting levels of glucose-dependent insulinotropic peptide (GIP) focussing on the GLPR2 gene. Variants are coloured based on linkage disequilibrium with the lead variant (rs17681684) for plasma citrulline. *Summary statistics for GIP were obtained from the more densely genotyped study included in Almgren et al. (to increase coverage of genetic variants for multi-trait colocalisation). C Individual association summary statistics for all citrulline associated SNPs (coded by the citrulline increasing allele) for T2D and an inverse-variance weighted (IVW) estimate pooling all effects. D Schematic sketch for the location of the missense variant induces amino acid substitution in the glucagon-like peptide-2 receptor (GLP2R). E GLP-2 dose response curves in cAMP assay for GLP2R wild-type and mutant receptors. The dose response curves of cAMP stimulation by GLP-2 in CHO K1 cells transiently transfected with either GLP2R wild-type or mutant constructs. Data were normalised to the wild-type maximal and minimal response, with 100% being GLP-2 maximal stimulation of the wild-type GLP2R, and 0% being wild-type GLP2R cells with buffer only. Mean ± standard errors are presented (n=4).F-G Summary of wild-type and mutant GLP2R beta-arrestin 1 and beta-arrestin 2 responses. Area under the curve (AUC) summary data (n=3-4) displayed for beta-arrestin 1 recruitment (E) and beta-arrestin 2 recruitment (F). AUCs were calculated using the 5 minutes prior to ligand addition as the baseline value. Mean ± standard errors are presented. Normal distribution of log10 transformed data was determined by the D'Agostino & Pearson normality test. Following this statistical significance was assessed by one-way ANOVA with post hoc Bonferroni test. ***p<0.001, *p<0.05.
Figure 6
Figure 6
A Results from genetic scores for each metabolite on risk for macular telangiectasia type 2 (MacTel). The dotted line indicates the level of significance after correction for multiple testing. The inlet shows the same results but after dropping the pleiotropic variants in GCKR and FADS1-2. B Effect estimates of serine-associated genetic variants on the risk for MacTel. C Comparison of effect sizes for lead variants associated with plasma serine levels and the risk for MacTel. D Receiver operating characteristic curves (ROC) comparing the discriminative performance for MacTel using a) sex, the first genetic principal component, and two MacTel variants (rs73171800 and rs9820286) not associated with metabolite levels, and b) additionally including genetically predicted serine and glycine at individual levels as described in the methods. The area under the curve (AUC) is given in the legend.
Figure 7
Figure 7
A Scheme of the workflow to link common variation in genes causing inborn errors of metabolism (IEM) to complex diseases. 7B Flowchart for the systematic identification of metabolite-associated variants to genes and diseases related to inborn errors of metabolism (IEM). C P-values from phenome-wide association studies among UK Biobank using variants mapping to genes knowing to cause IEMs and binary outcomes classified with the ICD-10 code. Colours indicate disease classes. The dotted line indicates the significance threshold controlling the false discovery rate at 5%. D Posterior probabilities (PPs) from statistical colocalisation analysis for each significant triplet consisting of a metabolite, a variant, and a ICD-10 code among UK Biobank. The dotted line indicates high likelihood (>80%) for one of the four hypothesis tested: H0 – no signal; H1 – signal unique to the metabolite; H2 – signal unique to the trait; H3 – two distinct causal variants in the same locus and H4 – presence of a shared causal variant between a metabolite and a given trait.

References

    1. Wishart DS. Metabolomics for investigating physiological and pathophysiological processes. Physiol Rev. 2019;99:1819–1875. - PubMed
    1. Shin S-YY, et al. An atlas of genetic influences on human blood metabolites. Nat Genet. 2014;46:543–550. - PMC - PubMed
    1. Long T, et al. Whole-genome sequencing identifies common-to-rare variants associated with human blood metabolites. Nat Genet. 2017;49:568–578. - PubMed
    1. Draisma HHM, et al. Genome-wide association study identifies novel genetic variants contributing to variation in blood metabolite levels. Nat Commun. 2015;6:7208. - PMC - PubMed
    1. Kettunen J, et al. Genome-wide study for circulating metabolites identifies 62 loci and reveals novel systemic effects of LPA. Nat Commun. 2016;7:11122. - PMC - PubMed

Publication types

MeSH terms

Grants and funding

LinkOut - more resources