. 2021 Jan;53(1):35-44.
doi: 10.1038/s41588-020-00754-2. Epub 2021 Jan 7.

Investigating the genetic architecture of noncognitive skills using GWAS-by-subtraction

Affiliations

Investigating the genetic architecture of noncognitive skills using GWAS-by-subtraction

Perline A Demange et al. Nat Genet. 2021 Jan.

Abstract

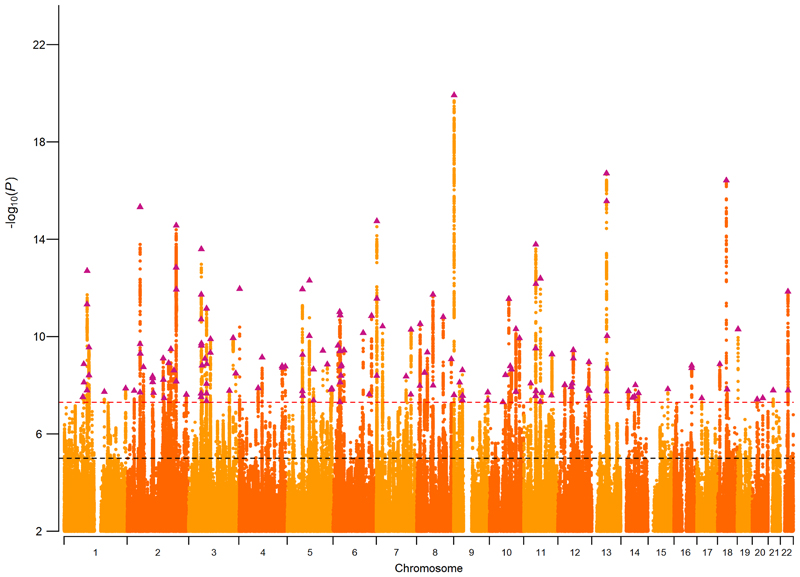
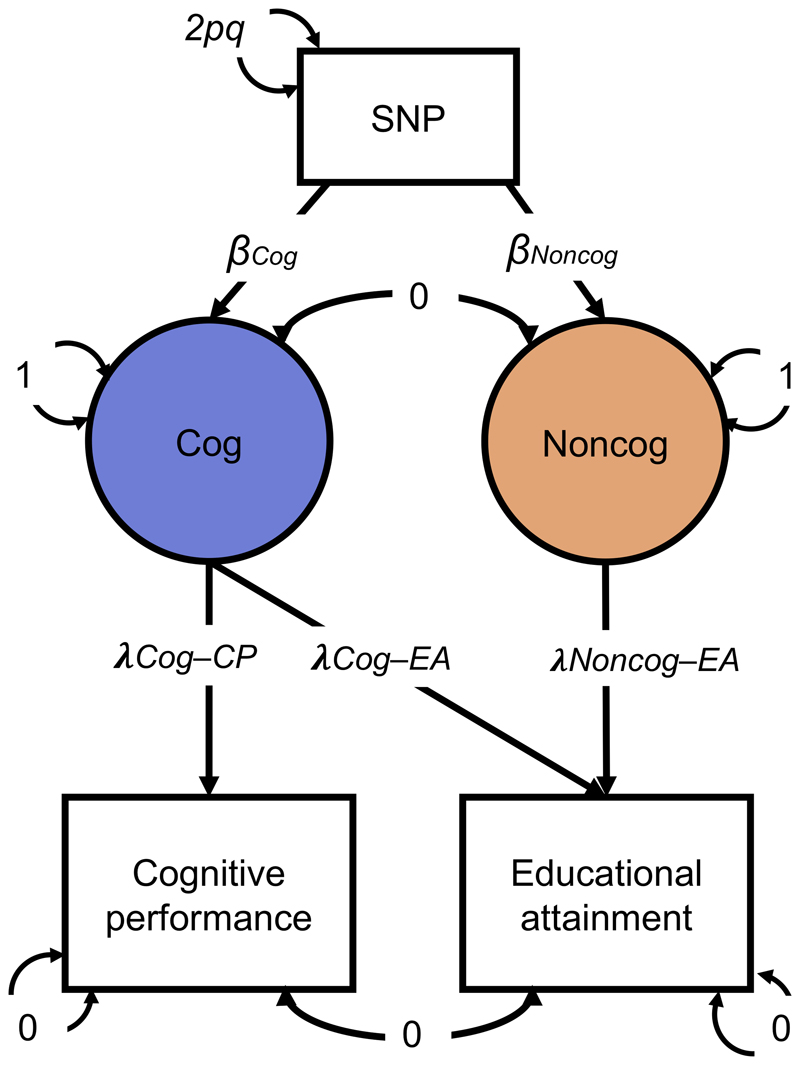
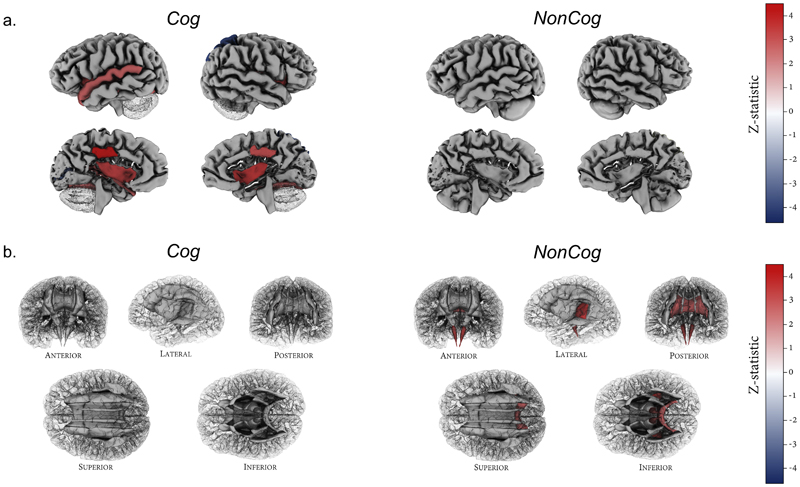
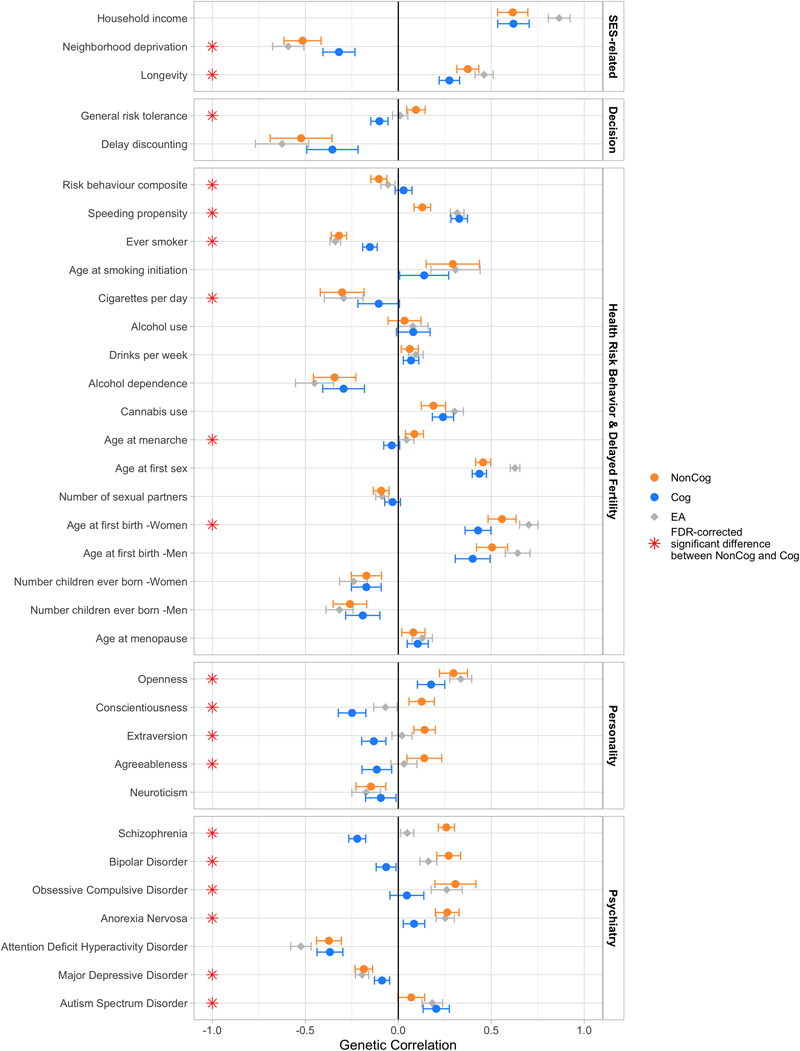
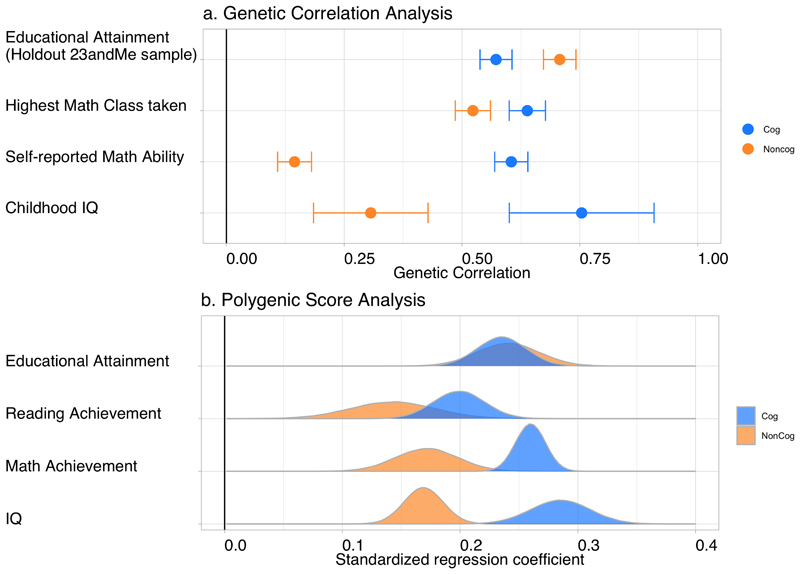
Little is known about the genetic architecture of traits affecting educational attainment other than cognitive ability. We used genomic structural equation modeling and prior genome-wide association studies (GWASs) of educational attainment (n = 1,131,881) and cognitive test performance (n = 257,841) to estimate SNP associations with educational attainment variation that is independent of cognitive ability. We identified 157 genome-wide-significant loci and a polygenic architecture accounting for 57% of genetic variance in educational attainment. Noncognitive genetics were enriched in the same brain tissues and cell types as cognitive performance, but showed different associations with gray-matter brain volumes. Noncognitive genetics were further distinguished by associations with personality traits, less risky behavior and increased risk for certain psychiatric disorders. For socioeconomic success and longevity, noncognitive and cognitive-performance genetics demonstrated associations of similar magnitude. By conducting a GWAS of a phenotype that was not directly measured, we offer a view of genetic architecture of noncognitive skills influencing educational success.


Conflict of interest statement

Competing Interests

The authors declare no competing interests.

Figures

Figure 1
Figure 1. GWAS-by-subtraction Genomic-SEM model.
Cholesky model as fitted in Genomic SEM, with path estimates for a single SNP included as illustration. SNP, cognitive performance (CP), and educational attainment (EA) are observed variables based on GWAS summary statistics. The genetic covariance between CP and EA is estimated based on GWAS summary statistics for CP and EA. The model is fitted to a 3 x 3 observed variance-covariance matrix (i.e. SNP, CP, EA). Cog and NonCog are latent (unobserved) variables. The covariances between CP and EA and between Cog and NonCog are fixed to 0. The variance of the SNP is fixed to the value of 2pq (p = reference allele frequency, q = alternative allele frequency, based on 1000 Genomes phase 3). The residual variances of CP and EA are fixed to 0, so that all variance is explained by the latent factors. The variances of the latent factors are fixed to 1. The observed variables CP and EA were regressed on the latent variables resulting in the estimates for the path loadings: λCog-CP = 0.4465; λCog-EA = 0.2237; λNonCog-EA = 0.2565. The latent variables were then regressed on each SNP that met QC criteria.
Figure 2
Figure 2. Manhattan plot of SNP associations with NonCog.
Plot of the -log10(P-value) associated with the Wald test (two-sided) of βNonCog for all SNPs, ordered by chromosome and base position. Purple triangles indicate genome-wide significant (P < 5 × 10⁻⁸) and independent (within a 250-kb window and r 2 < 0.1) associations. The red dashed line marks the threshold for genome-wide significance (P = 5 × 10⁻⁸), and the black dashed line the threshold for nominal significance (P = 1 × 10⁻⁵).
Figure 3
Figure 3. Polygenic prediction and genetic correlations with IQ and educational achievement.
a, Genetic correlations of NonCog and Cog with educational attainment, highest math class taken, self-reported math ability, and childhood IQ. The dots represent genetic correlations estimated using Genomic SEM. Correlations with NonCog are in orange, and with Cog in blue. Error bars represent 95% CIs. Exact estimates and P-values are reported in Supplementary Table 14. For analysis of genetic correlations with educational attainment, we re-ran the Genomic-SEM model to compute NonCog and Cog using summary statistics that omitted the 23andMe sample from the educational attainment GWAS. We then used the 23andMe sample to run the GWAS of educational attainment. Thus, there is no sample overlap in this analysis. b, Effect-size distributions from meta-analysis of NonCog and Cog polygenic score associations with cognitive test performance and educational attainment. Outcomes were regressed simultaneously on NonCog and Cog polygenic scores. Effect-sizes entered into the meta-analysis were standardized regression coefficients interpretable as Pearson r. Exact estimates and P-values are reported in Supplementary Table 12. Samples and measures are detailed in Supplementary Tables 9 and 10. Traits were measured in different samples: educational attainment was measured in the AddHealth, Dunedin, E-Risk, NTR, and WLS samples (n = 24,056); reading achievement and mathematics achievement were measured in the AddHealth, NTR, and Texas-Twin samples (n = 9,274 for reading achievement; n = 10,747 for mathematics achievement); cognitive test performance (IQ) was measured in the Dunedin, E-Risk, NTR, Texas Twins, and WLS samples (n = 11,351). The densities were obtained by randomly generating normal distributions where the meta-analytic estimate was included as the mean and the meta-analytic standard error as the standard deviation.
Figure 4
Figure 4. Estimates of genetic correlations with NonCog, Cog, and educational attainment.
Genetic correlations of NonCog, Cog, and educational attainment with selected phenotypes. The dots represent genetic correlations estimated in Genomic SEM. Correlations with NonCog are in orange, with Cog in blue, and with educational attainment in gray. Error bars represent 95% CIs. Red stars indicate a statistically significant (FDR corrected P < 0.05, two-tailed test) difference in the magnitude of the correlation with NonCog versus Cog. Exact P-values for all associations are reported in Supplementary Table 14. The FDR correction was applied based on all genetic correlations tested (including in Supplementary Fig. 11). The difference test is based on a chi-squared test associated with a comparison between a model constraining these two correlations to be identical versus a model where the correlations are freely estimated. Source GWAS are listed in Supplementary Table 13.
Figure 5
Figure 5. Genetic correlations with regional gray matter volumes and white matter tracts
a, Cortical patterning of FDR-corrected significant genetic correlations with regional gray matter volumes for Cog versus NonCog, after correction for total brain volume. Regions of interest are plotted according to the Desikan-Killiany-Tourville atlas, shown on a single manually-edited surface (http://mindboggle.info). Exact estimates and P-values are reported in Supplementary Table 21. Cog showed significant associations with gray matter volume for the bilateral fusiform, insula and posterior cingulate, the left superior temporal and left pericalcarine and right superior parietal volumes. NonCog was not associated with any of the regional brain volumes. b, White matter tract patterning of FDR-corrected significant genetic correlations with regional mode of anisotropy (MO) for Cog versus NonCog. White matter tract probability maps are plotted according to the Johns Hopkins University DTI atlas (https://identifiers.org/neurovault.image:1401). Exact estimates and P-values are reported in Supplementary Table 21. Cog was not associated with regional MO. NonCog showed significant associations with MO in the corticospinal tract, the retrolenticular limb of the internal capsule and the splenium of the corpus callosum.

References

    1. Moffitt TE, et al. A gradient of childhood self-control predicts health, wealth, and public safety. Proc Natl Acad Sci USA. 2011;108:2693–2698. - PMC - PubMed
    1. von Stumm S, Hell B, Chamorro-Premuzic T. The hungry mind: intellectual curiosity is the third pillar of academic performance. Perspect Psychol Sci. 2011;6:574–588. - PubMed
    1. Tucker-Drob EM, Briley DA, Engelhardt LE, Mann FD, Harden KP. Genetically-mediated associations between measures of childhood character and academic achievement. J Pers Soc Psychol. 2016;111:790–815. - PMC - PubMed
    1. Heckman JJ, Stixrud J, Urzua S. The effects of cognitive and noncognitive abilities on labor market outcomes and social behavior. J Labor Econ. 2006;24:411–482.
    1. Heckman JJ, Moon SH, Pinto R, Savelyev PA, Yavitz A. The rate of return to the HighScope Perry Preschool Program. J Public Econ. 2010;94:114–128. - PMC - PubMed

Publication types

LinkOut - more resources