. 2021 Jan;53(1):86-99.
doi: 10.1038/s41588-020-00750-6. Epub 2021 Jan 7.

Conservation of copy number profiles during engraftment and passaging of patient-derived cancer xenografts

Xing Yi Woo #  1 Jessica Giordano #  2   3 Anuj Srivastava  1 Zi-Ming Zhao  1 Michael W Lloyd  4 Roebi de Bruijn  5 Yun-Suhk Suh  6 Rajesh Patidar  7 Li Chen  7 Sandra Scherer  8 Matthew H Bailey  8   9 Chieh-Hsiang Yang  8 Emilio Cortes-Sanchez  8 Yuanxin Xi  10 Jing Wang  10 Jayamanna Wickramasinghe  11 Andrew V Kossenkov  11 Vito W Rebecca  11 Hua Sun  12 R Jay Mashl  12 Sherri R Davies  12 Ryan Jeon  13 Christian Frech  13 Jelena Randjelovic  13 Jacqueline Rosains  13 Francesco Galimi  2   3 Andrea Bertotti  2   3 Adam Lafferty  14 Alice C O'Farrell  14 Elodie Modave  15   16 Diether Lambrechts  15   16 Petra Ter Brugge  5 Violeta Serra  17 Elisabetta Marangoni  18 Rania El Botty  18 Hyunsoo Kim  1 Jong-Il Kim  6 Han-Kwang Yang  6 Charles Lee  1   19   20 Dennis A Dean 2nd  13 Brandi Davis-Dusenbery  13 Yvonne A Evrard  7 James H Doroshow  21 Alana L Welm  8 Bryan E Welm  8   22 Michael T Lewis  23 Bingliang Fang  24 Jack A Roth  24 Funda Meric-Bernstam  25 Meenhard Herlyn  11 Michael A Davies  26 Li Ding  12 Shunqiang Li  12 Ramaswamy Govindan  12 Claudio Isella  2   3 Jeffrey A Moscow  27 Livio Trusolino  2   3 Annette T Byrne  14 Jos Jonkers  5 Carol J Bult  4 Enzo Medico  28   29 Jeffrey H Chuang  30 PDXNET ConsortiumEurOPDX Consortium
Collaborators, Affiliations

Conservation of copy number profiles during engraftment and passaging of patient-derived cancer xenografts

Xing Yi Woo et al. Nat Genet. 2021 Jan.

Erratum in

  • Author Correction: Conservation of copy number profiles during engraftment and passaging of patient-derived cancer xenografts.
    Woo XY, Giordano J, Srivastava A, Zhao ZM, Lloyd MW, de Bruijn R, Suh YS, Patidar R, Chen L, Scherer S, Bailey MH, Yang CH, Cortes-Sanchez E, Xi Y, Wang J, Wickramasinghe J, Kossenkov AV, Rebecca VW, Sun H, Mashl RJ, Davies SR, Jeon R, Frech C, Randjelovic J, Rosains J, Galimi F, Bertotti A, Lafferty A, O'Farrell AC, Modave E, Lambrechts D, Ter Brugge P, Serra V, Marangoni E, El Botty R, Kim H, Kim JI, Yang HK, Lee C, Dean DA 2nd, Davis-Dusenbery B, Evrard YA, Doroshow JH, Welm AL, Welm BE, Lewis MT, Fang B, Roth JA, Meric-Bernstam F, Herlyn M, Davies MA, Ding L, Li S, Govindan R, Isella C, Moscow JA, Trusolino L, Byrne AT, Jonkers J, Bult CJ, Medico E, Chuang JH; PDXNET Consortium; EurOPDX Consortium. Woo XY, et al. Nat Genet. 2021 May;53(5):761. doi: 10.1038/s41588-021-00811-4. Nat Genet. 2021. PMID: 33608693 Free PMC article. No abstract available.

Abstract

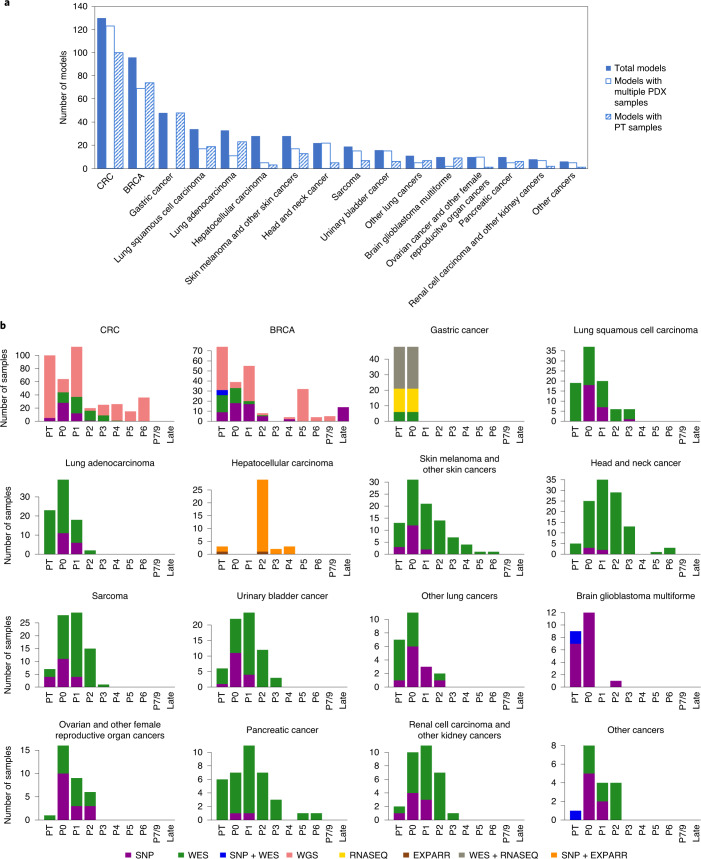
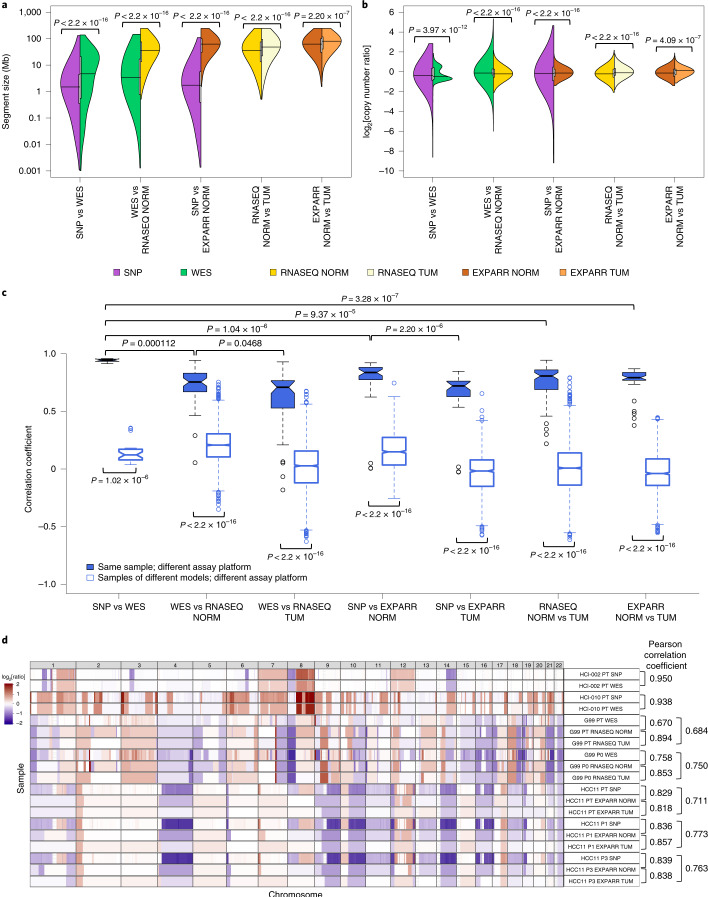
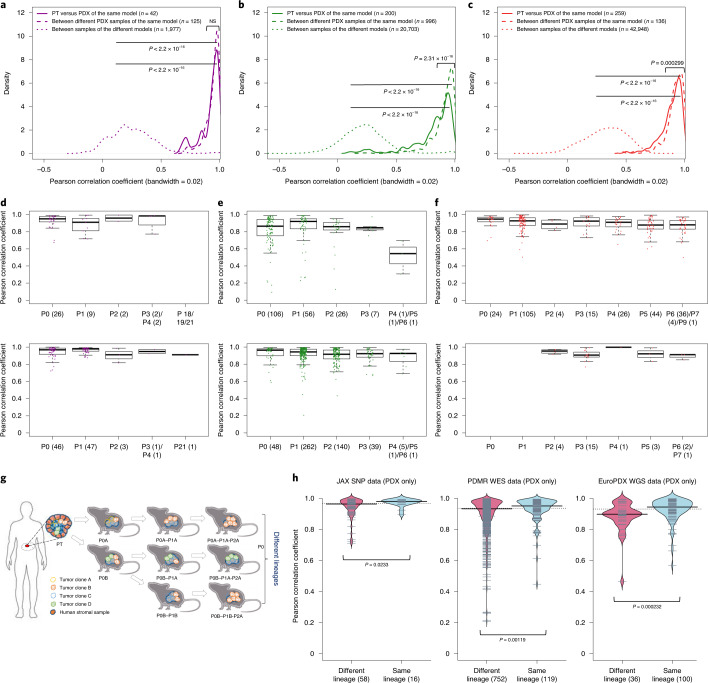
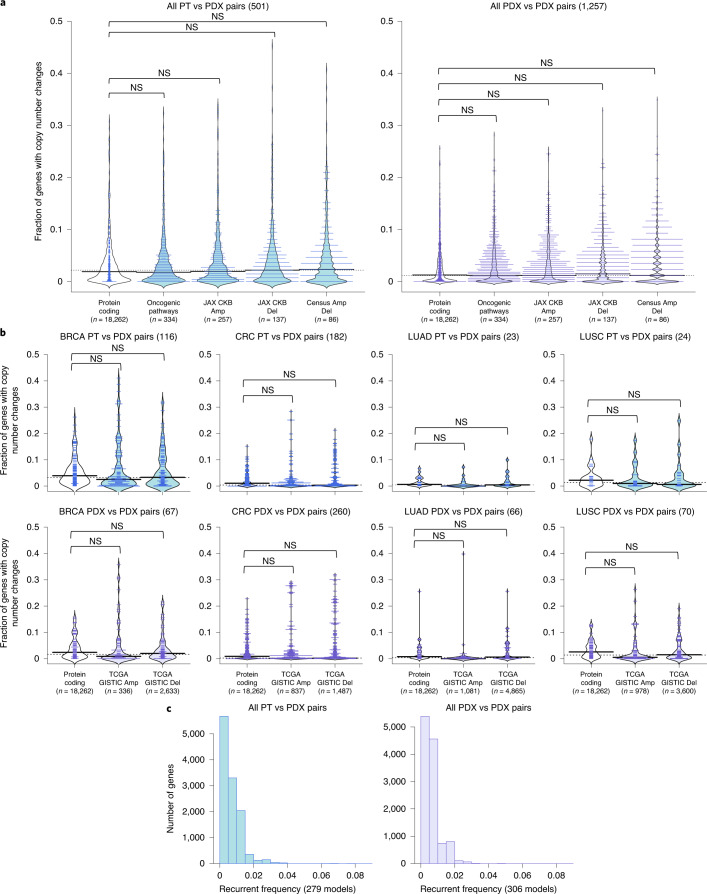
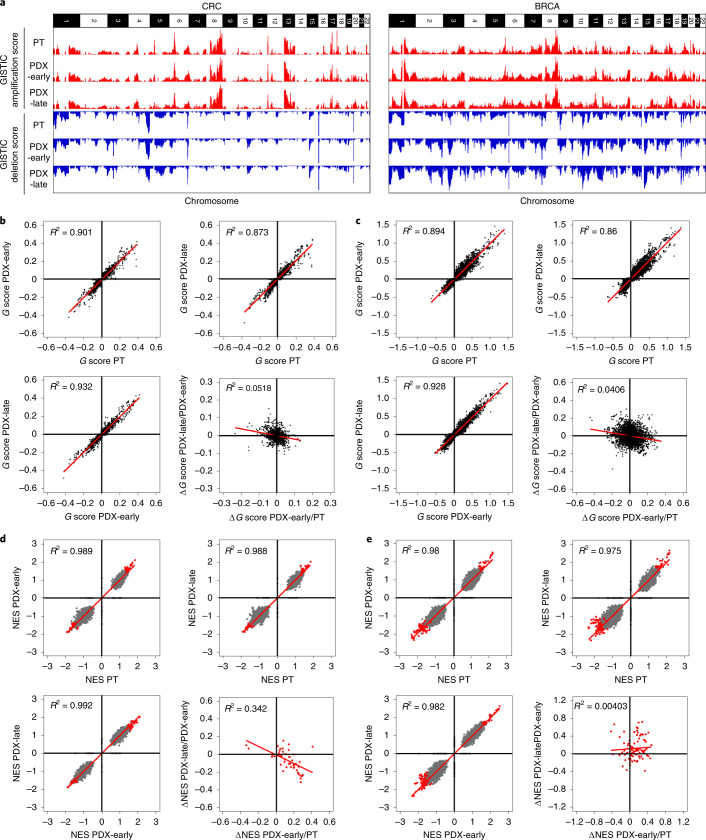
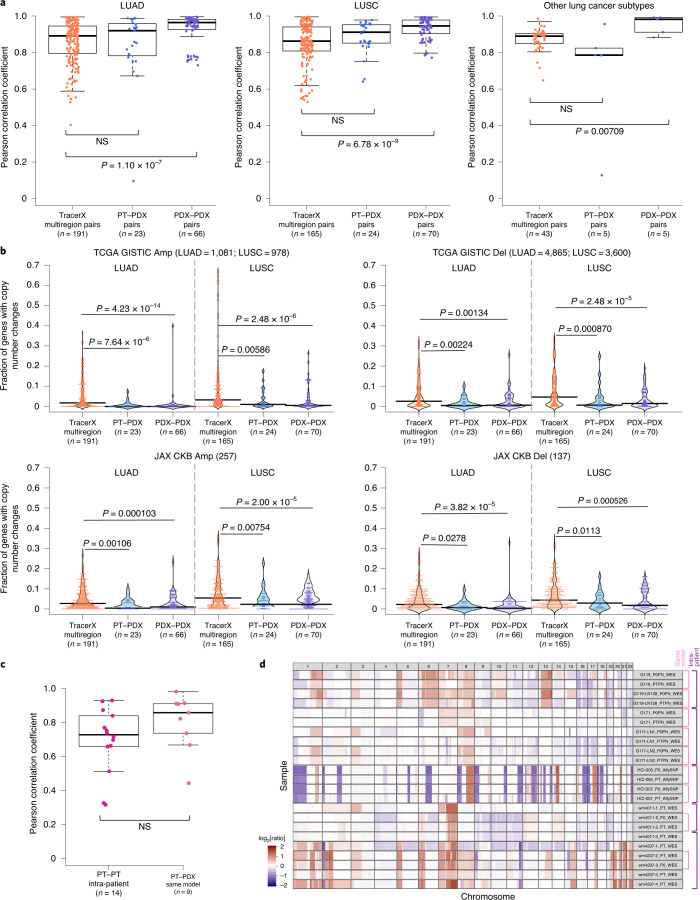
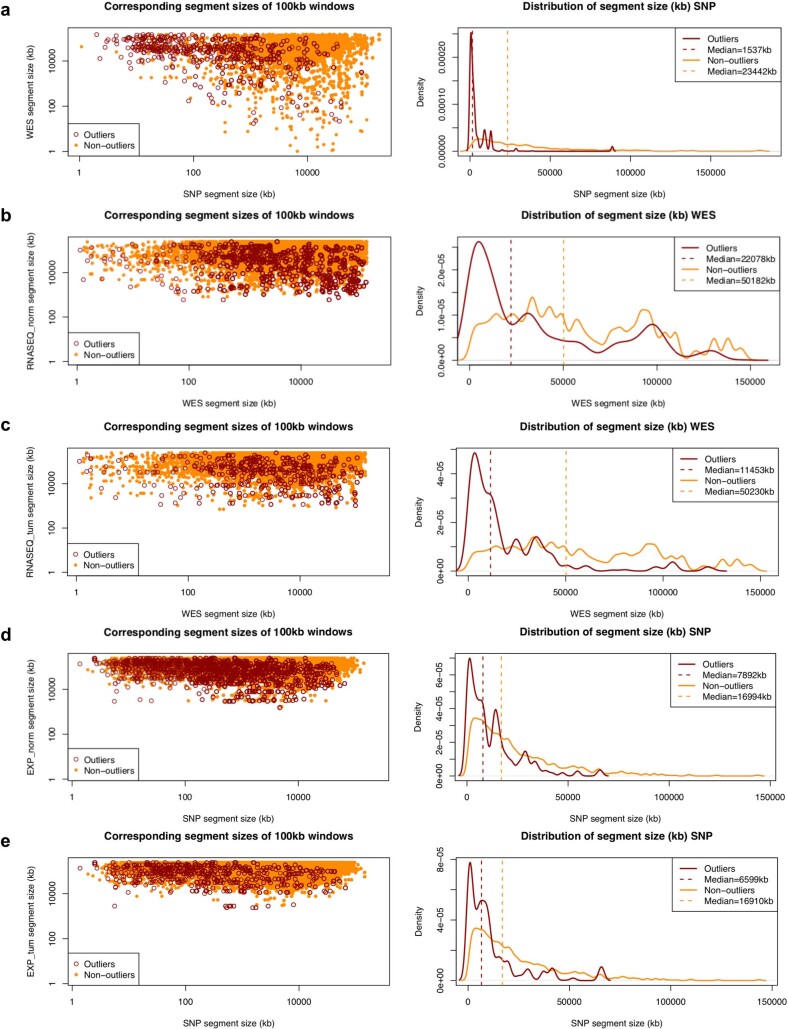
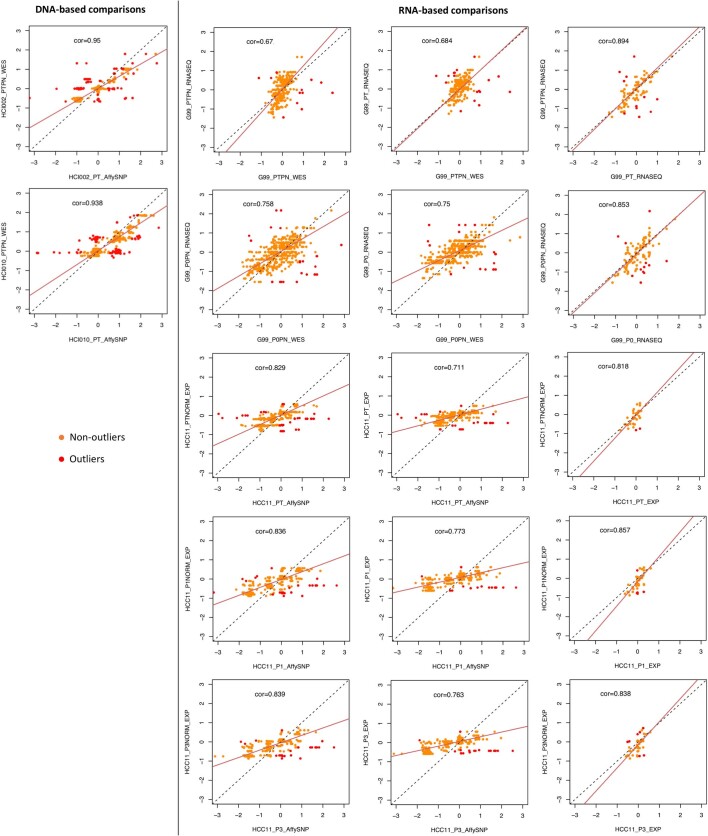
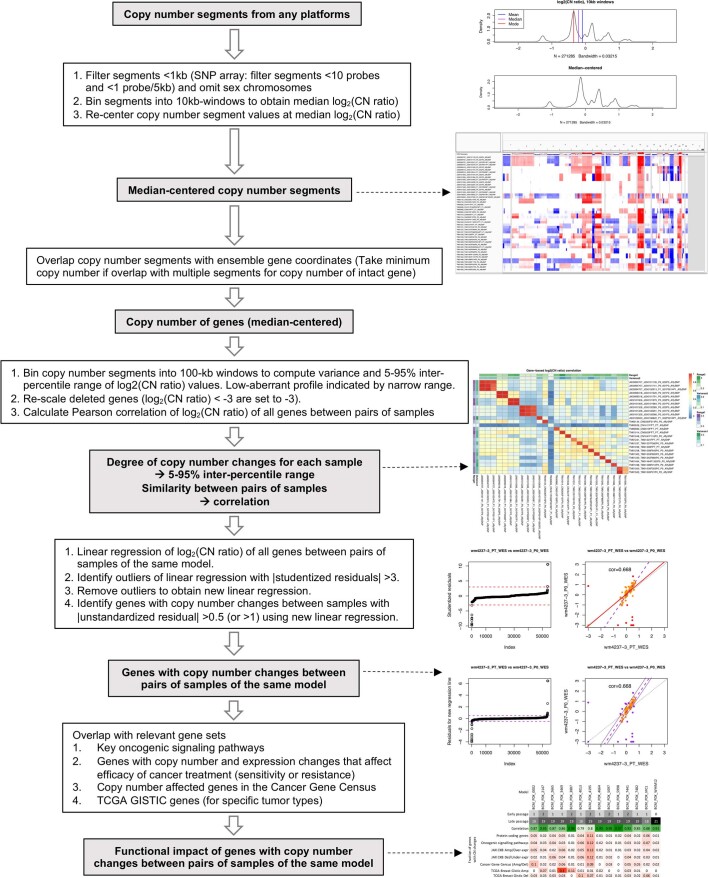
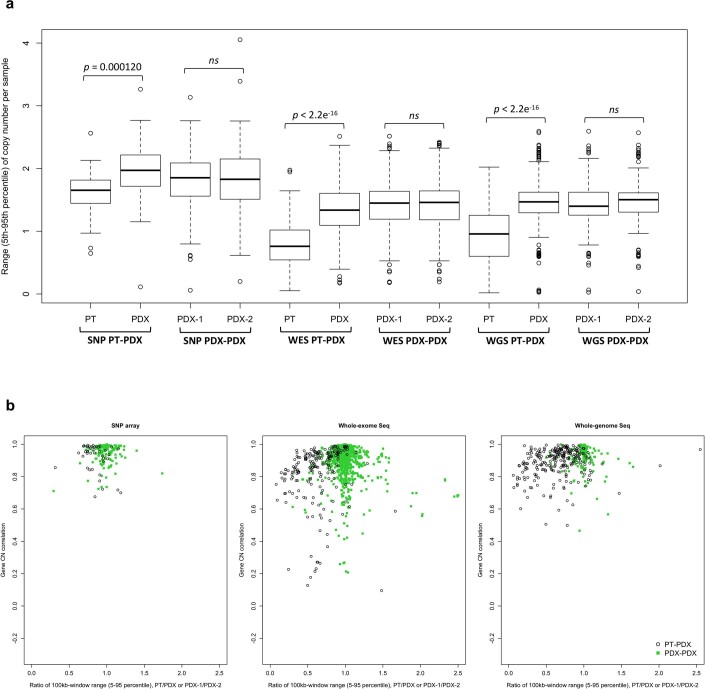
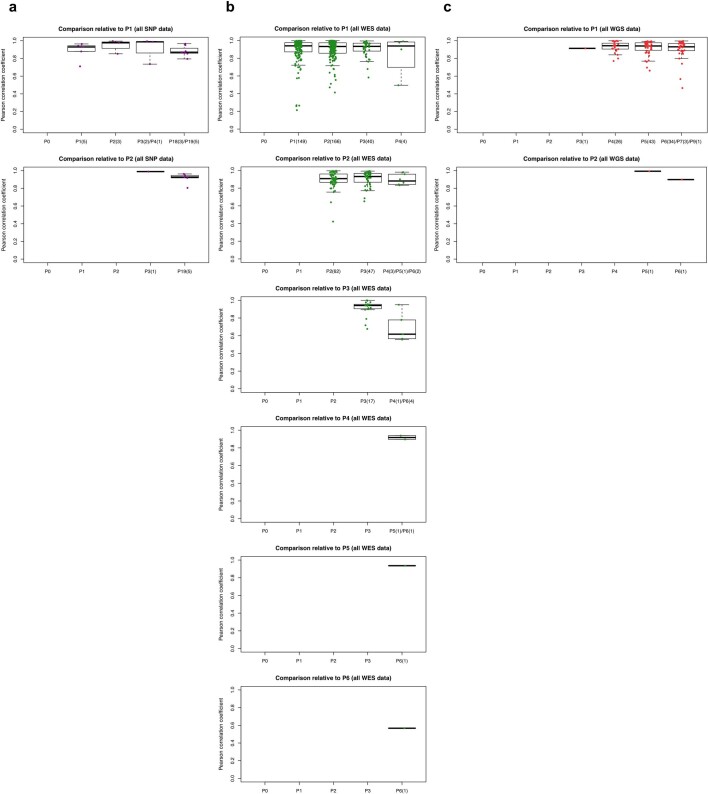
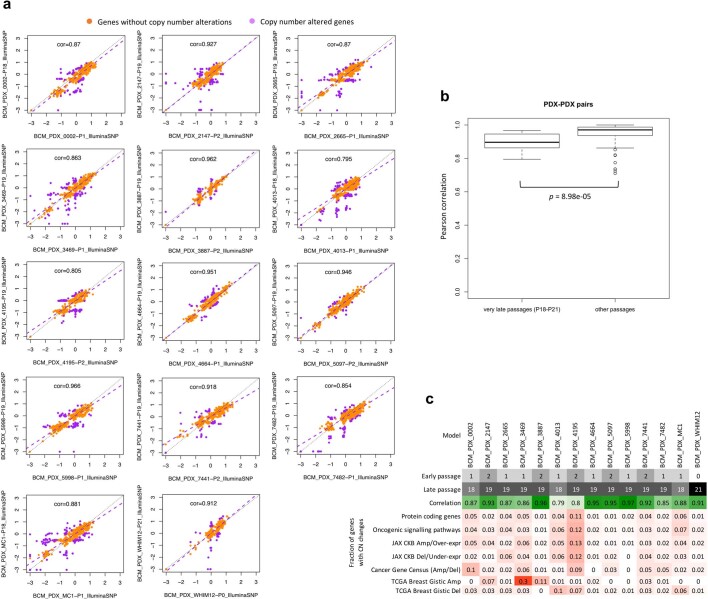
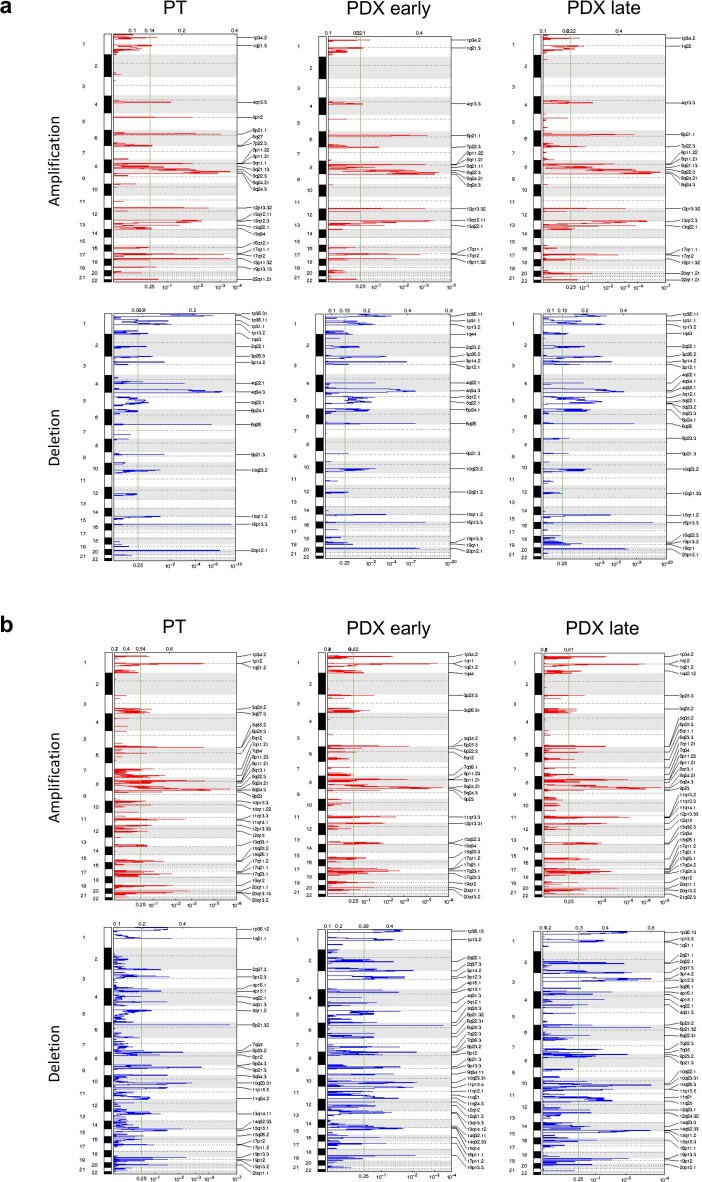
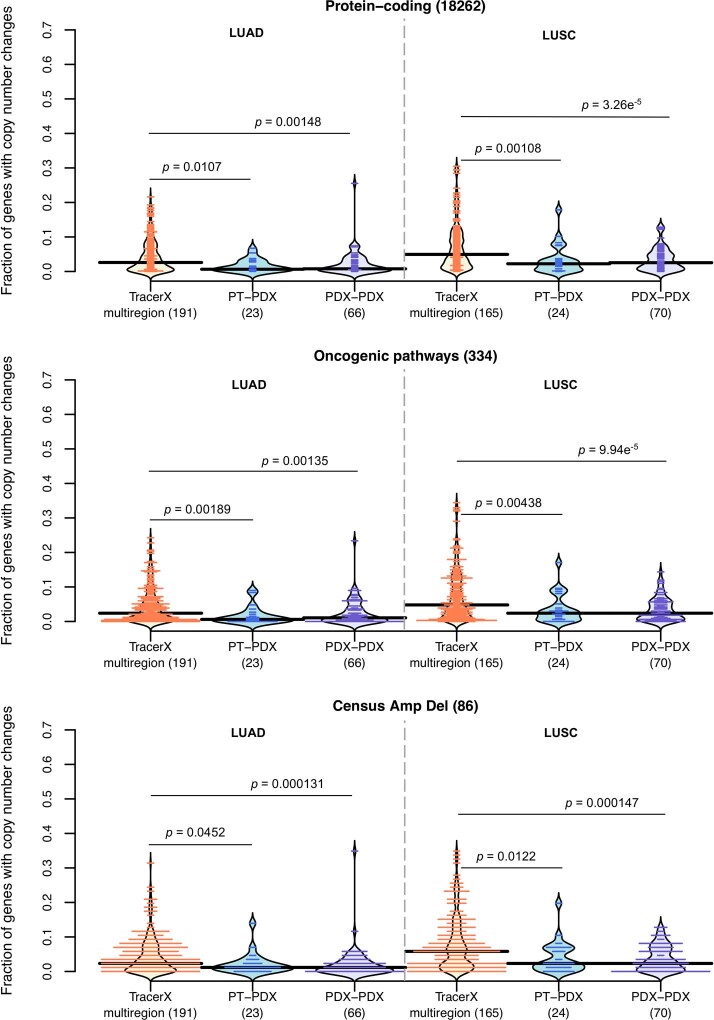
Patient-derived xenografts (PDXs) are resected human tumors engrafted into mice for preclinical studies and therapeutic testing. It has been proposed that the mouse host affects tumor evolution during PDX engraftment and propagation, affecting the accuracy of PDX modeling of human cancer. Here, we exhaustively analyze copy number alterations (CNAs) in 1,451 PDX and matched patient tumor (PT) samples from 509 PDX models. CNA inferences based on DNA sequencing and microarray data displayed substantially higher resolution and dynamic range than gene expression-based inferences, and they also showed strong CNA conservation from PTs through late-passage PDXs. CNA recurrence analysis of 130 colorectal and breast PT/PDX-early/PDX-late trios confirmed high-resolution CNA retention. We observed no significant enrichment of cancer-related genes in PDX-specific CNAs across models. Moreover, CNA differences between patient and PDX tumors were comparable to variations in multiregion samples within patients. Our study demonstrates the lack of systematic copy number evolution driven by the PDX mouse host.


Conflict of interest statement

A.L.W. and B.E.W. receive a portion of royalties if the University of Utah licenses certain PDX models to for-profit entities. M.T.L. is a founder of, and equity stake holder in, Tvardi Therapeutics, a founder of, and limited partner in, StemMed and a manager in StemMed Holdings. He also receives a portion of royalties if the Baylor College of Medicine licenses certain PDX models to for-profit entities. J.A.R. serves as a consultant and received stocks from Genprex, and receives royalties from patents issued. F.M.-B. reports receiving commercial research grants from Novartis, AstraZeneca, Calithera, Aileron, Bayer, Jounce, CytomX, eFFECTOR, Zymeworks, PUMA Biotechnology, Curis, Millennium, Daiichi Sankyo, Abbvie, Guardant Health, Takeda, Seattle Genetics and GlaxoSmithKline, as well as grants and travel-related fees from Taiho, Genentech, Debiopharm Group and Pfizer. She also served as a consultant to Pieris, Dialectica, Sumitomo Dainippon, Samsung Bioepis, Aduro, OrigiMed, Xencor, The Jackson Laboratory, Zymeworks, Kolon Life Science and Parexel International, and an advisor to Inflection Biosciences, GRAIL, DarwinHealth, Spectrum, Mersana and Seattle Genetics. L.T. reports receiving research grants from Symphogen, Servier, Pfizer and Merus, and he is in the speakers’ bureau of Eli Lilly, AstraZeneca and Merck. J.J. reports receiving funding for collaborative research from Artios Pharma. He also serves as a Scientific Advisory Board member of Artios Pharma. The other authors declare no competing interests.

Figures

Fig. 1
Fig. 1. PDX datasets used for copy number profiling across 16 tumor types.
a, Numbers of PDX models for each tumor type, with models also having multiple PDX samples or having matched PT samples specified. b, Distributions of datasets by passage number and assay platform for PTs and PDX samples, separated by tumor type. Late passages include P18, P19 and P21 samples.
Fig. 2
Fig. 2. Comparisons of resolution and accuracy for CNAs estimated using DNA- and expression-based methods.
a, Pairwise comparisons of the distributions of CNA segment sizes as estimated using different measurement platforms in the validation dataset. CNAs are regions with (|log2[copy number ratio]| ≥ 0.1). P values indicate the significance of the difference between distributions by two-sided Wilcoxon rank-sum test. vs, versus. b, Pairwise comparisons of the distributions of CNA segment log2[copy number ratio] values. P values were computed by two-sided Kolmogorov–Smirnov test. c, Distributions of Pearson correlation coefficients of median-centered log2[copy number ratio] values in 100-kb windows from CNA segments between pairs of samples estimated using different platforms. Samples with non-aberrant profiles in SNP array and WES data were omitted (5–95% inter-percentile range of log2[copy number ratio] < 0.3). P values were computed by two-sided Wilcoxon rank-sum test. In the box plots, the center line represents the median, the box limits are the upper and lower quantiles, the whiskers extend to 1.5× the interquartile range and the dots represent outliers. d, Examples of CNA profiles in comparisons of different platforms. Pearson correlation coefficients of CNA segments between pairs of samples are shown on the right. See Supplementary Table 3 for the number of samples per group. Examples of CNA profiles in comparisons of different platforms are shown; each sample ID is denoted by the model ID, passage number and platform used (see Supplementary Data 1).
Fig. 3
Fig. 3. Comparisons of CNAs from PTs with early and late PDX passages.
ac, Distributions of Pearson correlation coefficients of gene-based copy number, estimated by SNP array (a), WES (b) and WGS (c) between: PT–PDX samples of the same model; PDX–PDX samples of the same model; and samples of different models from a common tumor type and contributing center. P values were computed by one-sided Wilcoxon rank-sum test (P > 0.05). Numbers of data points are indicated. NS, not significant. df, Distributions of Pearson correlation coefficients of gene-based copy number, estimated by SNP array (d), WES (e) and WGS (f) among PT and PDX passages of the same model. Comparisons relative to PT (top) and P0 (bottom) are shown (higher passages are shown in Extended Data Fig. 5). In the box plots, the center line represents the median, the box limits are the upper and lower quantiles, the whiskers extend to 1.5× the interquartile range and the dots represent all data points. g, Schematic of lineage splitting during passaging and expansion of tumors into multiple mice. This is a simplified illustration for passaging procedures in which different fragments of a tumor are implanted into different mice. h, Pearson correlation distributions for PDX sample pairs of different lineages and sample pairs within the same lineage, for (from left to right): JAX SNP array, PDMR WES and EuroPDX WGS datasets. P values were computed by one-sided Wilcoxon rank-sum test. For all box plots and violin plots, the numbers of pairwise correlations are indicated in the x axis labels.
Fig. 4
Fig. 4. Cancer gene set analysis for copy number–altered genes during engraftment and passaging.
a, Distribution of the proportion of altered genes between pairwise PT–PDX (left) and PDX–PDX comparisons (right) of the same model in various gene sets. Along the x axes from left to right are: protein-coding genes annotated by Ensembl; genes in oncogenic signaling pathways identified by TCGA; genes with copy number gain or overexpression (Amp) and genes with copy number loss or underexpression (Del) associated with therapeutic sensitivity or resistance or changes in drug response identified by JAX CKB; and genes from the Cancer Gene Census frequently altered by amplifications or deletions. CNA genes were identified by |residual| > 0.5 from a linear regression model. b, Distribution of the proportion of altered genes between pairwise PT–PDX (top) PDX–PDX comparisons (bottom) of the same model in various gene sets within BRCA, CRC, lung adenocarcinoma (LUAD) and lung squamous cell carcinoma (LUSC) models. Along the x axes from left to right are: protein-coding genes annotated by Ensembl, followed by significantly amplified and deleted genes from TCGA GISTIC analysis for the corresponding tumor type. For all violin plots, P values were computed by one-sided Wilcoxon rank-sum test (P > 0.1). The numbers of pairwise comparisons are indicated above each plot, whereas the numbers of genes per gene set are indicated in the x axis labels. c, Recurrence frequencies of protein-coding genes with CNAs, |residual| > 1, across all models in PT–PDX (left) and PDX–PDX comparisons (right). Number of models are indicated in the x axis labels.
Fig. 5
Fig. 5. Absence of mouse-driven recurrent CNAs during engraftment and propagation of CRC and BRCA PDXs.
a, Bar charts representing genome-wide G scores for amplifications and deletions in each of the three cohorts of CRC (left; 87 trios) and BRCA (right; 43 trios): PT, PDX-early (P0–P1 for CRC; P0–P2 for BRCA) and PDX-late (P2–P7 for CRC; P3–P9 for BRCA). b,c, Scatter plots comparing gene-level G scores between each of the three cohorts for CRC (b) and BRCA (c). The bottom-right panels of b and c show scatter plots comparing ΔG values from PT to PDX-early and from PDX-early to PDX-late. d,e, Scatter plots comparing GSEA NESs for gene sets between each of the three cohorts for CRC (d) and BRCA (e). The bottom-right panels of d and e show scatter plots comparing ΔNES from PT to PDX-early and from PDX-early to PDX-late. Gray data points represent all gene sets, whereas red data points represent gene sets significantly enriched in at least one of the three cohorts (that is, PT, PDX-early or PDX-late).
Fig. 6
Fig. 6. Comparison of CNA variation during PDX engraftment and passaging with CNA variation among patient multiregion, tumor relapse and metastasis samples.
a, Distributions of Pearson correlation coefficients of gene-based copy number for lung adenocarcinoma (LUAD), lung squamous cell carcinoma (LUSC) and other lung cancer subtypes, comparing different datasets. From left to right on the x axis, these include: multiregion tumor samples of the same patient from TRACERx (n = 92 PTs; n = 295 multiregion samples); PT–PDX samples of the same model; and PDX–PDX samples of the same model. P values were computed by two-sided Wilcoxon rank-sum test (P > 0.05). b, Distributions of the proportion of altered genes between multiregion tumor pairs from TRACERx, as well as PT–PDX and PDX–PDX pairs, for various gene sets for LUAD and LUSC. The gene sets and CNA thresholds are the same as in Fig. 4. TCGA GISTIC Amp/Del and JAX CKB Amp Del gene sets are shown (other gene sets are shown in Extended Data Fig. 8). P values were computed by one-sided Wilcoxon rank-sum test. The numbers of genes per gene set are indicated above each plot. c, Distributions of Pearson correlation coefficients of gene-based copy number between intra-patient PT pairs (n = 14; primary, relapse or metastasis) from the same patient (n = 5) and corresponding PT–PDX pairs (derived from the same model; a different PT sample from the same patient generates a different model) for the same set of patients. P values were computed by two-sided Wilcoxon rank-sum test (P > 0.05). For all box and violin plots, the numbers of pairwise comparisons are indicated in the x axis labels. In all box plots the center line represents the median, the box limits are the upper and lower quantiles, the whiskers extend to 1.5× the interquartile range and the dots represent all data points. d, CNA profiles of PT and PDX samples from patients with PDX models derived from multiple PT collections (primary, relapse and metastasis). Each sample ID is denoted by the model ID, passage number and platform used (see Supplementary Data 1).
Extended Data Fig. 1
Extended Data Fig. 1. Comparison of segment sizes between different platforms.
The left panel compares the combined corresponding segment sizes of outlier and non-outliers from the linear regression of the log2(CN ratio) of 100-kb windows binned from copy number segments between matched samples estimated from two different platforms or methods combined. Outliers of the linear regression are identified by studentized residuals > 3 and < -3. a, SNP vs. WES. b, WES vs. RNASEQ (NORM). c, WES vs. RNASEQ (TUM). d, SNP vs. EXPARR (NORM). e, SNP vs. EXPARR (TUM) (see Supplementary Table 3). The right panel compares the distribution of the segment sizes of outliers and non-outliers for the platform or method of higher resolution.
Extended Data Fig. 2
Extended Data Fig. 2. Comparison of copy number between different platforms.
Pearson correlation and linear regression of the log2(CN ratio) of 100-kb windows binned from copy number segments of CNA profiles between matched patient tumor samples estimated from different platforms or analysis methods for examples shown in Fig. 2d. Outliers of the linear regression are identified by studentized residuals > 3 and < -3. RNA-seq and expression array samples denoted with ‘PN’ or ‘NORM’ are normalized by the median expression of normal samples.
Extended Data Fig. 3
Extended Data Fig. 3. Analysis workflow to compare CNA between two samples of the same PDX model.
A correlation and robust regression approach to quantify similarity of CNA profiles and identify genes with copy number changes between two samples.
Extended Data Fig. 4
Extended Data Fig. 4. Correlations between PT-PDX and PDX-PDX pairs.
a, The 5-95% inter-percentile range of CNA profiles between PT-PDX or PDX-PDX sample pairs from the same model on different platforms as shown in Fig. 3a–c. The 5-95% inter-percentile range of log2(CN ratio) values were calculated across all 100-kb windows per sample. P-values were computed by one-sided Wilcoxon rank sum test (ns: non-significant, P > 0.05). In the boxplots, the center line is the median, box limits are the upper and lower quantiles, whiskers extend 1.5× the interquartile range, and dots represent the outliers. b, Pearson correlation of the samples versus the ratio of 5-95% inter-percentile range between two samples (PT/PDX or PDX-1/PDX-2). Samples pairs with ratio of range much greater or less than 1 (that is one sample is much less aberrant than the other) tend to have lower correlations. PDX-1, lower passage PDX; PDX-2, later passage PDX or same passage PDX of different lineage.
Extended Data Fig. 5
Extended Data Fig. 5. Distribution of Pearson correlation coefficients of gene-based copy number.
a-c, Estimated by SNP array (a), WES (b), and WGS (c) between different combinations of patient tumor and PDX passages of the same model. Comparisons relative to passages P1 or later passages (refer to Fig. 3d–f for comparisons with PT and P0). In the boxplots, the center line is the median, box limits are the upper and lower quantiles, whiskers extend 1.5× the interquartile range, and dots represent all data points.
Extended Data Fig. 6
Extended Data Fig. 6. Comparison of CNA between early and very-late passages.
In the BCM SNP array breast cancer dataset. a, Correlation and robust regression of gene-based copy number between early (P0-P2) and very-late passages (P18-P21) of the same model. Genes with copy number changes between the passages are identified by |residual| > 0.5. Some genes show signs of complete deletion (log2(CN ratio) < -2) but then reappear in later passages. This can only be explained by the early and late passages being dominated by different pre-existing subclones. b, Distribution of Pearson correlation coefficients of gene-based copy number between early and very-late passages of the same model (14 models/pairwise correlations) compared to correlation coefficients between lower passages denoted as ‘other passages’ (< P4). Correlation for ‘other passages’ are based on models from all other non-BCM SNP array datasets (111 pairwise correlations). P-values were computed by one-sided Wilcoxon rank sum test. In all boxplots, the center line is the median, box limits are the upper and lower quantiles, whiskers extend 1.5× the interquartile range, and dots represent outliers. c, Summary of passage numbers, copy number correlation, and fraction of genes of different gene sets with copy number changes (|residual| > 0.5) between passages of each breast cancer model.
Extended Data Fig. 7
Extended Data Fig. 7. GISTIC analysis of recurrent CNAs.
a,b, GISTIC plots showing amplified and deleted regions in the EurOPDX WGS of trios of PTs and derived PDXs, at early and late passages, of colorectal cancer (a, 87 trios) and breast cancer (b, 43 trios). For each GISTIC plot, the top axis reports the G-score and the bottom axis the q-value.
Extended Data Fig. 8
Extended Data Fig. 8. Distribution of proportion of altered genes for lung cancer samples.
Comparison between multi-region tumor pairs from TRACERx, and PT-PDX and PDX-PDX pairs for various gene sets for LUAD and LUSC. Gene sets and CNA thresholds are the same as Fig. 4, other gene sets are shown in Fig. 6b. P-values were computed by one-sided Wilcoxon rank sum test. Numbers of genes per gene set are indicated in the plot title, and number of pairwise comparisons are indicated in the horizontal axis labels.

Similar articles

Cited by

References

    1. Richmond A, Su Y. Mouse xenograft models vs GEM models for human cancer therapeutics. Dis. Models Mech. 2008;1:78–82. - PMC - PubMed
    1. Walrath JC, Hawes JJ, Van Dyke T, Reilly KM. Genetically engineered mouse models in cancer research. Adv. Cancer Res. 2010;106:113–164. - PMC - PubMed
    1. Hait WN. Anticancer drug development: the grand challenges. Nat. Rev. Drug Discov. 2010;9:253–254. - PubMed
    1. Shultz LD, Ishikawa F, Greiner DL. Humanized mice in translational biomedical research. Nat. Rev. Immunol. 2007;7:118–130. - PubMed
    1. Brehm MA, Shultz LD, Greiner DL. Humanized mouse models to study human diseases. Curr. Opin. Endocrinol. Diabetes Obes. 2010;17:120–125. - PMC - PubMed

Publication types