. 2018 May 1;57(5):1231-1245.
doi: 10.1175/jamc-d-17-0216.1.

Intercomparison of Surface Temperatures from AIRS, MERRA, and MERRA-2, with NOAA and GC-Net Weather Stations at Summit, Greenland

Affiliations

Intercomparison of Surface Temperatures from AIRS, MERRA, and MERRA-2, with NOAA and GC-Net Weather Stations at Summit, Greenland

Thomas J Hearty 3rd et al. J Appl Meteorol Climatol. .

Abstract

The surface skin and air temperatures reported by the Atmospheric Infrared Sounder/Advanced Microwave Sounding Unit-A (AIRS/AMSU-A), the Modern-Era Retrospective analysis for Research and Applications (MERRA), and MERRA-2 at Summit, Greenland are compared with near surface air temperatures measured at National Oceanic and Atmospheric Administration (NOAA) and Greenland Climate Network (GC-Net) weather stations. The AIRS/AMSU-A Surface Skin Temperature (TS) is best correlated with the NOAA 2 m air temperature (T2M) but tends to be colder than the station measurements. The difference may be the result of the frequent near surface temperature inversions in the region. The AIRS/AMSU-A Surface Air Temperature (SAT) is also correlated with the NOAA T2M but has a warm bias during the cold season and a larger standard error than the surface temperature. The extrapolation of the temperature profile to calculate the AIRS SAT may not be valid for the strongest inversions. The GC-Net temperature sensors are not held at fixed heights throughout the year; however, they are typically closer to the surface than the NOAA station sensors. Comparing the lapse rates at the 2 stations shows that it is larger closer to the surface. The difference between the AIRS/AMSU-A SAT and TS is sensitive to near surface inversions and tends to measure stronger inversions than both stations. The AIRS/AMSU-A may be sampling a thicker layer than either station. The MERRA-2 surface and near surface temperatures show improvements over MERRA but little sensitivity to near surface temperature inversions.


Figures

Fig. 1.
Fig. 1.
A time series of the height of the GC-Net temperature sensors.
Fig. 2.
Fig. 2.
The difference between the surface pressure assumed by AIRS/AMSU-A algorithm and the pressure recorded at NOAA and GC-Net Summit stations.
Fig. 3.
Fig. 3.
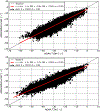
AIRS TS is compared with NOAA T2M (top panel) and GC-Net TCAir1 (bottom panel) temperatures. The station temperatures above 0°C are associated with a melt event that occurred in the summer of 2012 that will be discussed further in Section 4.c. The red symbols correspond to AIRS observations that were classified as “land” by the AMSU-A surface classification algorithm.
Fig. 4.
Fig. 4.
AIRS SAT is compared with NOAA T10M (top panel) and T2M (bottom panel) temperatures.
Fig. 5.
Fig. 5.
The MERRA Sampled like AIRS/AMSU-A (MSA) near surface air temperatures T10M (top panel) and T2M (middle panel) are compared to their respective NOAA Station temperatures and the MERRA surface temperature TS (bottom panel) is compared to the AIRS/AMSU-A surface temperature.
Fig. 6.
Fig. 6.
The MERRA-2 Sampled like AIRS/AMSU-A (M2SA) near surface air temperatures T10M (top panel) and T2M (middle panel) are compared to their respective NOAA Station temperatures and the MERRA-2 surface temperature TS (bottom panel) is compared to the AIRS/AMSU-A surface temperature.
Fig. 7.
Fig. 7.
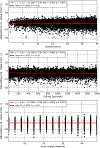
The AIRS/AMSU-A TS - NOAA T2M difference is shown as a function of distance of the AIRS observations from the summit (top panel), offset in time37(middle panel), and scan angle of the AIRS observation (bottom panel).
Fig. 8.
Fig. 8.
The AIRS/AMSU-A TS - NOAA T2M difference is compared to the solar zenith angle (top panel), the total cloud fraction from AIRS (middle panel), and the inversion strength from the NOAA station (bottom panel). The colors in the top and middle panels represent the inversion strength measured by the NOAA T10M - NOAA T2M difference and the colors in the bottom panel represent the total cloud fraction measured by the AIRS retrieval.
Fig. 9.
Fig. 9.
Like Fig. 7 but comparing SAT to the NOAA 2 m and 10 m temperatures with respect to geometrical factors.
Fig. 10.
Fig. 10.
Like Fig. 8 but comparing SAT to the NOAA 2 m and 10 m temperatures with respect to environmental factors.
Fig. 11.
Fig. 11.
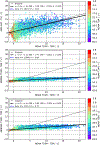
Several different measures of the near surface inversion strength are compared to the NOAA 10 meter - 2 meter near surface temperature inversion strength. The top panel shows AIRS SAT - AIRS TS, the middle panel shows MERRA T10M - MERRA T2M, and the bottom panel shows MERRA-2 T10M - MERRA-2 T2M.
Fig. 12.
Fig. 12.
The figure shows the lapse rate measured at the NOAA and GC-Net stations. Since the highest GC-Net temperature sensor is usually at ~ 3 meters and the highest NOAA temperature sensor is at 10 meters, the figure suggest that the lapse rate is larger closer to the surface. The colors represent the NOAA T2M temperature measurement.
Fig. 13.
Fig. 13.
A time series of monthly mean values of AIRS TS, MERRA and MERRA-2 TS, GC-Net TCAir1, and NOAA T2M.
Fig. 14.
Fig. 14.
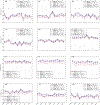
Same as Fig. 13 but with the months separated.
Fig. 15.
Fig. 15.
The top panel shows a time series of the monthly yield in the AIRS observations at the Greenland Summit. The bottom panel shows a time series of estimates of the AIRS sampling bias using MERRA, MERRA-2, and the NOAA and GC-Net station observations.
Fig. 16.
Fig. 16.
Same as Figure 15 but with the months separated.
Fig. 17.
Fig. 17.
A time series of the AMSU-A Channel 1 (23.8 GHz) emissivity at Summit clearly shows the melting event in the Summer of 2012.

References

    1. AIRS Science Team/Joao Texeira, 2013a: Airs/aqua l2 cloud-cleared infrared radiances (airs+amsu) v006 (airi2ccf). Goddard Earth Sciences Data and Information Services Center (GES DISC), accessed from the Goddard Earth Sciences Data and Information Services Center (GES DISC) on 4/29/2016, doi:10.5067/AQUA/AIRS/DATA204. - DOI
    1. AIRS Science Team/Joao Texeira, 2013b: Airs/aqua l2 standard physical retrieval (airs+amsu) v006 (airx2ret). Goddard Earth Sciences Data and Information Services Center (GES DISC), accessed from the Goddard Earth Sciences Data and Information Services Center (GES DISC) on 4/29/2016, doi:10.5067/AQUA/AIRS/DATA201. - DOI
    1. Alley RB, and Joughin I, 2012: Modeling Ice-Sheet Flow. Science, 336, 551, doi:10.1126/science.1220530. - DOI - PubMed
    1. Aumann HH, and Coauthors, 2003: AIRS/AMSU/HSB on the aqua mission: design, science objectives, data products, and processing systems. IEEE Transactions on Geoscience and Remote Sensing, 41, 253–264, doi:10.1109/TGRS.2002.808356. - DOI
    1. Bindschadler RA, and Coauthors, 2013: Ice-sheet model sensitivities to environmental forcing and their use in projecting future sea level (the SeaRISE project). Journal of Glaciology, 59, 195–224, doi:10.3189/2013JoG12J125. - DOI

LinkOut - more resources