. 2020 Dec 22:14:580697.
doi: 10.3389/fnhum.2020.580697. eCollection 2020.

Evidence for [Coronal] Underspecification in Typical and Atypical Phonological Development

Affiliations

Evidence for [Coronal] Underspecification in Typical and Atypical Phonological Development

Alycia E Cummings et al. Front Hum Neurosci. .

Abstract

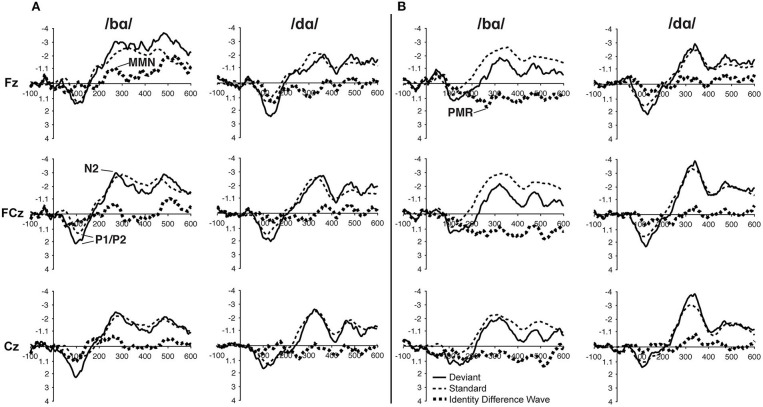
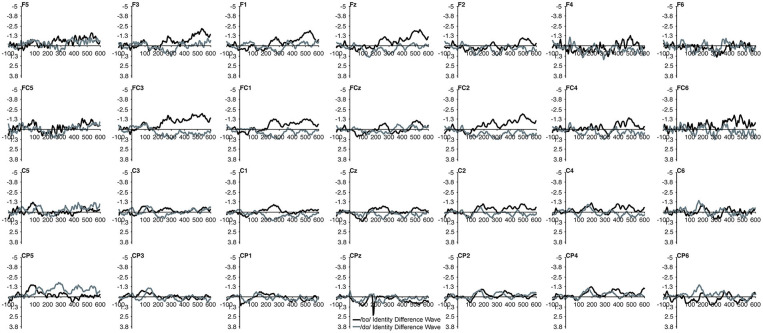
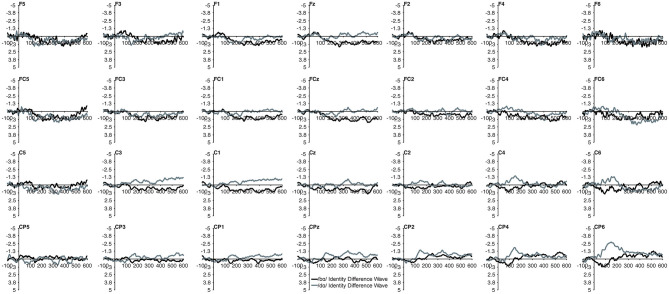
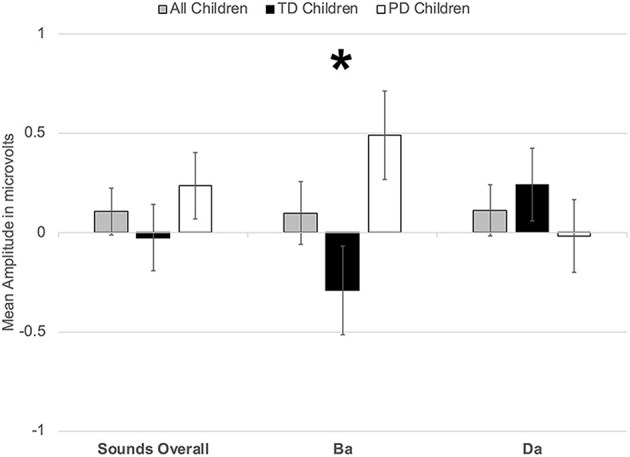
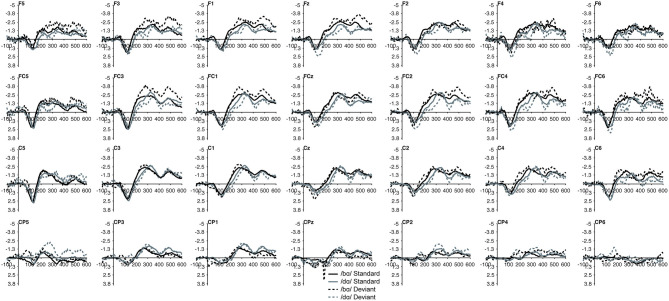
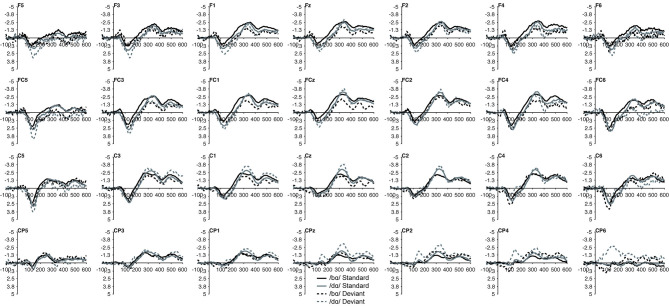
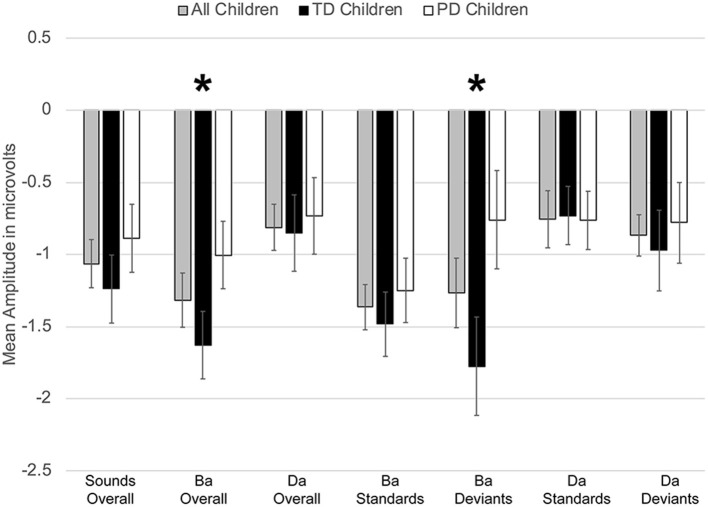
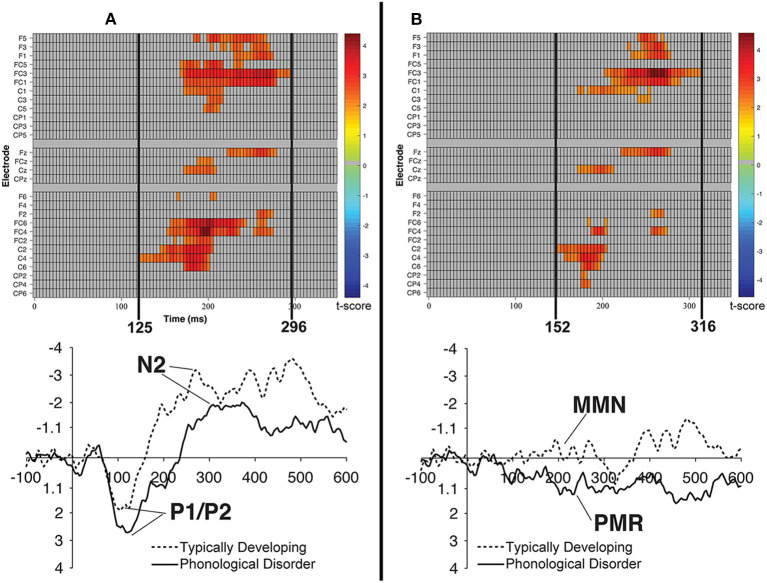
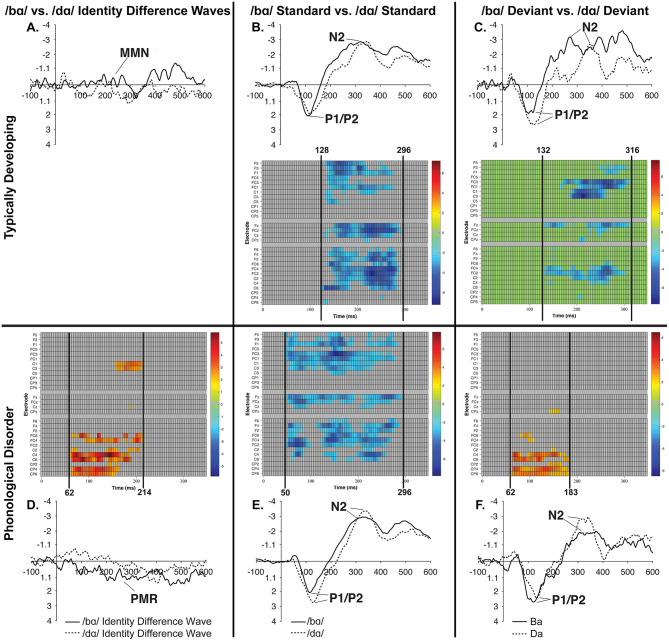
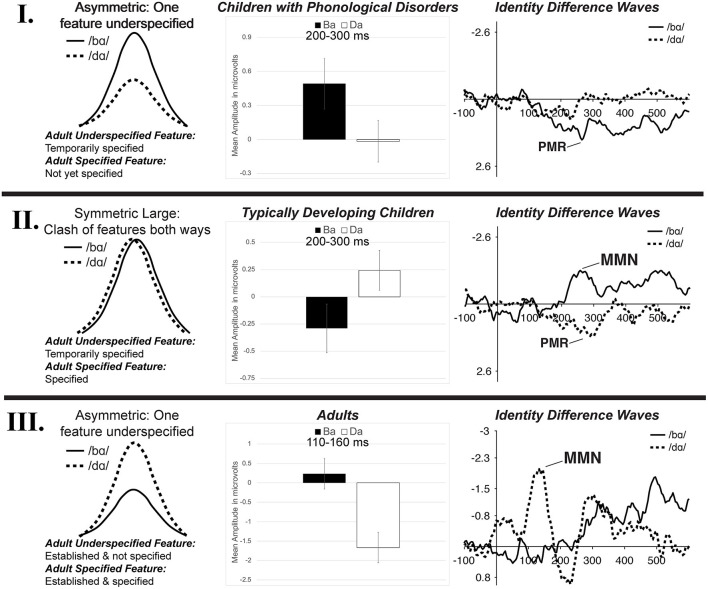
The Featurally Underspecified Lexicon (FUL) theory predicts that [coronal] is the language universal default place of articulation for phonemes. This assumption has been consistently supported with adult behavioral and event-related potential (ERP) data; however, this underspecification claim has not been tested in developmental populations. The purpose of this study was to determine whether children demonstrate [coronal] underspecification patterns similar to those of adults. Two English consonants differing in place of articulation, [labial] /b/ and [coronal] /d/, were presented to 24 children (ages 4-6 years) characterized by either a typically developing phonological system (TD) or a phonological disorder (PD). Two syllables, /bɑ/ and /dɑ/, were presented in an ERP oddball paradigm where both syllables served as the standard and deviant stimulus in opposite stimulus sets. Underspecification was examined with three analyses: traditional mean amplitude measurements, cluster-based permutation tests, and single-trial general linear model (GLM) analyses of single-subject data. Contrary to previous adult findings, children with PD demonstrated a large positive mismatch response (PMR) to /bɑ/ while the children with TD exhibited a negative mismatch response (MMN); significant group differences were not observed in the /dɑ/ responses. Moreover, the /bɑ/ deviant ERP response was significantly larger in the TD children than in the children with PD. At the single-subject level, more children demonstrated mismatch responses to /dɑ/ than to /bɑ/, though some children had a /bɑ/ mismatch response and no /dɑ/ mismatch response. While both groups of children demonstrated similar responses to the underspecified /dɑ/, their neural responses to the more specified /bɑ/ varied. These findings are interpreted within a proposed developmental model of phonological underspecification, wherein children with PD are functioning at a developmentally less mature stage of phonological acquisition than their same-aged TD peers. Thus, phonological underspecification is a phenomenon that likely develops over time with experience and exposure to language.

Keywords: ERP; MMN; children; phonological disorder; phonology; underspecification.


Conflict of interest statement

The authors declare that the research was conducted in the absence of any commercial or financial relationships that could be construed as a potential conflict of interest.

Figures

Figure 1
Figure 1
ERP waveforms elicited in the (A) typically developing (TD) children and (B) children with phonological disorders (PD). In each panel, the /bɑ/ syllable response is presented on the left and the /dɑ/ syllable response is on the right. The deviant waveforms represent the neural responses when the deviant syllable was presented within a stream of the opposite syllable standards. Subtracting the standard syllable response from the deviant syllable response resulted in the identity difference waves. Note that negative is plotted up in all waveforms.
Figure 2
Figure 2
Identity difference waveforms of the TD children elicited by /bɑ/ and /dɑ/ across all 28 electrodes included in all analyses. The /bɑ/ responses are in black while the /dɑ/ responses are in gray.
Figure 3
Figure 3
Identity difference waveforms of the children with PD elicited by /bɑ/ and /dɑ/ across all 28 electrodes included in all analyses. The /bɑ/ responses are in black while the /dɑ/ responses are in gray. Error bars represent SEM.
Figure 4
Figure 4
Average mean amplitudes for mismatch responses measured in identity difference waves from 200 to 300 ms post-syllable onset. Responses from the typically developing children are in black, responses from children with phonological disorders are in white, and combined responses across groups are in gray. Error bars represent SEM. The TD children demonstrated a negative mismatch response (MMN) to /bɑ/ while the children with PD demonstrated a positive mismatch response (PMR). The The * symbol represents a significant difference.
Figure 5
Figure 5
Standard and deviant waveforms of the TD children elicited by /bɑ/ and /dɑ/ across all 28 electrodes included in all analyses. The /bɑ/ responses are in black while the /dɑ/ responses are in gray. Standard responses are solid lines while deviant response are dashed lines.
Figure 6
Figure 6
Standard and deviant waveforms of the children with PD elicited by /bɑ/ and /dɑ/ across all 28 electrodes included in all analyses. The /bɑ/ responses are in black while the /dɑ/ responses are in gray. Standard responses are solid lines while deviant response are dashed lines.
Figure 7
Figure 7
Average mean amplitudes for standard and deviant ERPs from 200 to 300 ms post-syllable onset. Responses from the typically developing children are in black, responses from children with phonological disorders are in white, and combined responses across groups are in gray. Error bars represent SEM. The ERP responses elicited by the /bɑ/ deviants in the TD children were significantly larger (i.e., more negative) than those of the children with PD. The * symbol represents a significant difference.
Figure 8
Figure 8
Raster diagrams and waveforms illustrating group (TD vs. PD) differences in the processing of the /bɑ/ stimuli. On the left (A) are group differences in response to the /bɑ/ deviant. TD children demonstrated a more negative response than did children with PD. On the right (B) are group differences in response to the /bɑ/ identity difference wave. TD children demonstrated a negative mismatch response while children with PD demonstrated a positive mismatch response. For the raster diagrams, colored rectangles indicate electrodes/time points in which the ERPs to one stimulus are significantly different from those to another. The color scale dictates the size of the t-test result, with dark red and blue colors being more significant. Gray areas indicate electrodes/time points at which no significant differences were found. Note that the electrodes are organized along the y-axis somewhat topographically. Electrodes on the left and right sides of the head are grouped on the figure's top and bottom, respectively; midline electrodes are shown in the middle. Within those three groupings, y-axis top-to-bottom corresponds to scalp anterior-to-posterior.
Figure 9
Figure 9
Raster diagrams and waveforms illustrating /bɑ/ and /dɑ/ processing differences in the TD children and children with PD. Responses from TD children are on the top (A–C), while responses from children with PD are on the bottom (D–F). In the left column are /bɑ/ and /dɑ/ identity difference wave comparisons (A,D), the middle column contrasts /bɑ/ and /dɑ/ standards (B,E), and the right column contrasts /bɑ/ and /dɑ/ deviants (C,F). Both groups of children demonstrated similar processing patterns in the standard and deviant analyses, as the /bɑ/ elicited more negative responses than did the /dɑ/. The /bɑ/ mismatch response of the children with PD was significantly more positive than the mismatch response to /dɑ/, especially over the right hemisphere electrodes; no significant differences were observed in the identity difference waves of the TD children.
Figure 10
Figure 10
The three stages of the proposed developmental model of phonological underspecification. Children with PD are hypothesized to be in Stage I, TD children are hypothesized to be in Stage II, while adults are presumed to be in Stage III. The left column represents a schematic representation of possible mismatch responses in each stage (based on Schluter et al., 2016). The proposed development and specification of features is listed, with /d/ presumed to be the underspecified phoneme and /b/ the specified phoneme. The middle column displays the mean amplitude of the mismatch responses found in the /bɑ/ and /dɑ/ identity difference waves of each population during the mismatch analysis window. The right column presents the identity differences waves of each population from electrode FC1. See text for more detail.

Similar articles

Cited by

References

    1. Ahmmed A. U., Clarke E. M., Adams C. (2008). Mismatch negativity and frequency representational width in children with specific language impairment. Dev. Med. Child Neurol. 50, 938–944. 10.1111/j.1469-8749.2008.03093.x - DOI - PubMed
    1. Archangeli D. (1988). Aspects of underspecification theory. Phonology 5, 183–207. 10.1017/S0952675700002268 - DOI
    1. Aslin R. N., Smith L. B. (1988). Perceptual development. Annu. Rev. Psychol. 39, 435–473. 10.1146/annurev.ps.39.020188.002251 - DOI - PubMed
    1. Austin D., Shriberg L. D. (1997). Lifespan Reference Data for Ten Measures of Articulation Competence Using the Speech Disorders Classification System (SDSC). Madison, WI: Phonology Project Waisman Center on Mental Retardation and Human Development.
    1. Bernhardt B. (1992). The application of nonlinear phonological theory to intervention with one phonologically disordered child. Clin. Linguist. Phon. 6, 283–316. 10.3109/02699209208985537 - DOI - PubMed

LinkOut - more resources