

Influence of landscape management practices on urban greenhouse gas budgets
- PMID: 33415575
- PMCID: PMC7792215
- DOI: 10.1186/s13021-020-00160-5
Influence of landscape management practices on urban greenhouse gas budgets
Abstract
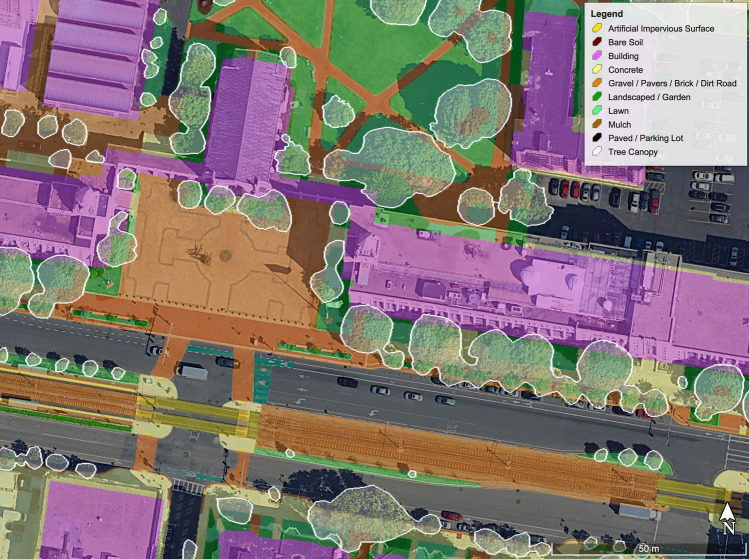
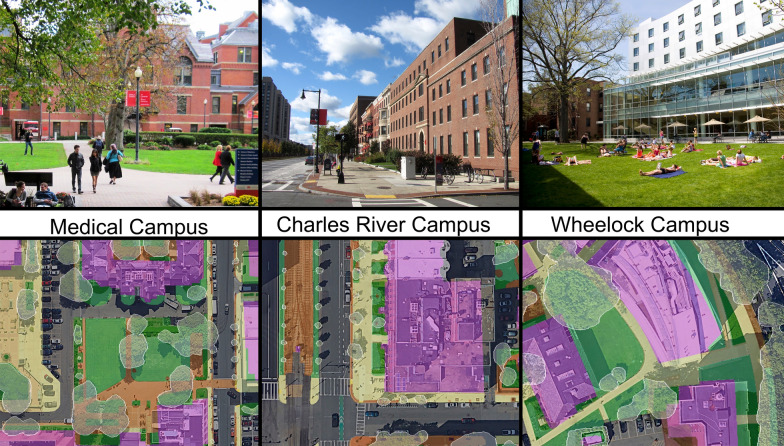
Background: With a lack of United States federal policy to address climate change, cities, the private sector, and universities have shouldered much of the work to reduce carbon dioxide (CO2) and other greenhouse gas emissions. This study aims to determine how landcover characteristics influence the amount of carbon (C) sequestered and respired via biological processes, evaluating the role of land management on the overall C budget of an urban university. Boston University published a comprehensive Climate Action Plan in 2017 with the goal of achieving C neutrality by 2040. In this study, we digitized and discretized each of Boston University's three urban campuses into landcover types, with C sequestration and respiration rates measured and scaled to provide a University-wide estimate of biogenic C fluxes within the broader context of total University emissions.
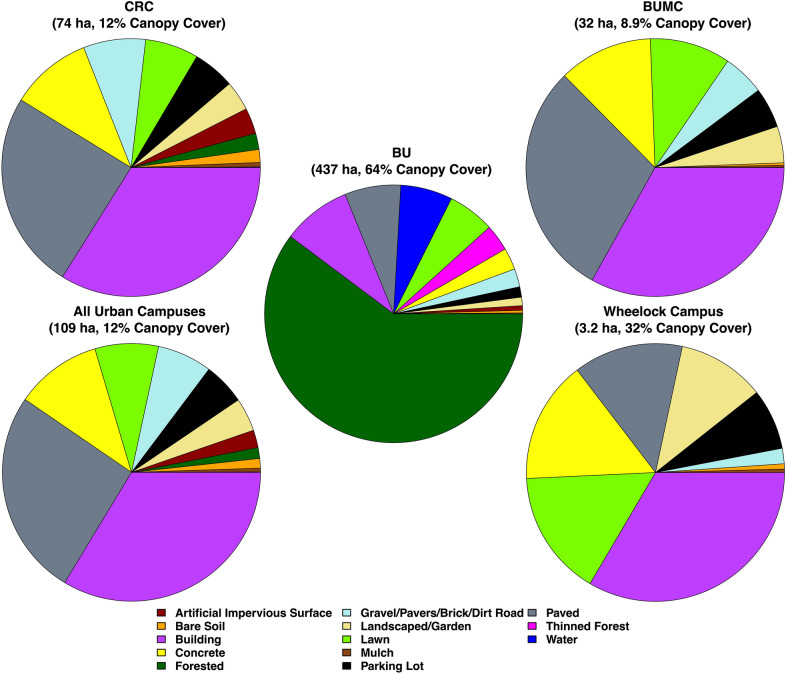
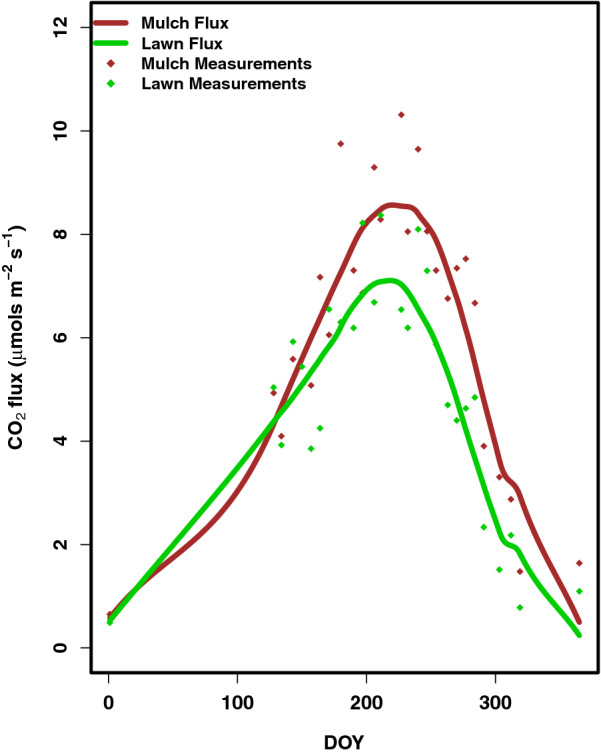
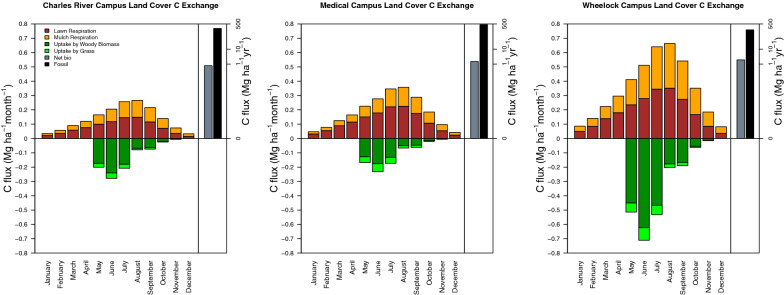
Results: Each of Boston University's three highly urban campuses were net sources of biogenic C to the atmosphere. While trees were estimated to sequester 0.6 ± 0.2 kg C m-2 canopy cover year-1, mulch and lawn areas in 2018 emitted C at rates of 1.7 ± 0.4 kg C m-2 year-1 and 1.4 ± 0.4 kg C m-2 year-1, respectively. C uptake by tree canopy cover, which can spatially overlap lawn and mulched landcovers, was not large enough to offset biogenic emissions. The proportion of biogenic emissions to Scope 1 anthropogenic emissions on each campus varied from 0.5% to 2%, and depended primarily on the total anthropogenic emissions on each campus.
Conclusions: Our study quantifies the role of urban landcover in local C budgets, offering insights on how landscaping management strategies-such as decreasing mulch application rates and expanding tree canopy extent-can assist universities in minimizing biogenic C emissions and even potentially creating a small biogenic C sink. Although biogenic C fluxes represent a small fraction of overall anthropogenic emissions on urban university campuses, these biogenic fluxes are under active management by the university and should be included in climate action plans.
Keywords: Biogenic fluxes; Climate action plan; Landscaping; Nature-based solution; Soil respiration; Urban carbon cycling.
Conflict of interest statement
The authors declare no conflicts of interest. Funding sponsors played no part in designing the study, collecting, analyzing or interpreting data, and in publishing the results.
Figures
References
-
- We Are Still In. https://www.wearestillin.com/. Accessed 26 Jan 2020.
-
- Hutyra LR, Duren R, Gurney KR, Grimm N, Kort EA, Larson E, et al. Urbanization and the carbon cycle: current capabilities and research outlook from the natural sciences perspective. Earths Future. 2014;2:473–495. doi: 10.1002/2014EF000255. - DOI
-
- Bergeron O, Strachan IB. CO2 sources and sinks in urban and suburban areas of a northern mid-latitude city. Atmos Environ. 2011;45:1564–1573. doi: 10.1016/j.atmosenv.2010.12.043. - DOI
LinkOut - more resources
Full Text Sources
Other Literature Sources
