

Glucagon, insulin, adrenocorticotropic hormone, and cortisol in response to carbohydrates and fasting in healthy neonatal foals
- PMID: 33415818
- PMCID: PMC7848351
- DOI: 10.1111/jvim.16024
Glucagon, insulin, adrenocorticotropic hormone, and cortisol in response to carbohydrates and fasting in healthy neonatal foals
Abstract
Background: The endocrine pancreas and hypothalamic-pituitary-adrenal axis (HPAA) are central to energy homeostasis, but information on their dynamics in response to energy challenges in healthy newborn foals is lacking.
Objectives: To evaluate glucagon, insulin, ACTH, and cortisol response to fasting and carbohydrate administration in healthy foals.
Animals: Twenty-two healthy Standardbred foals ≤4 days of age.
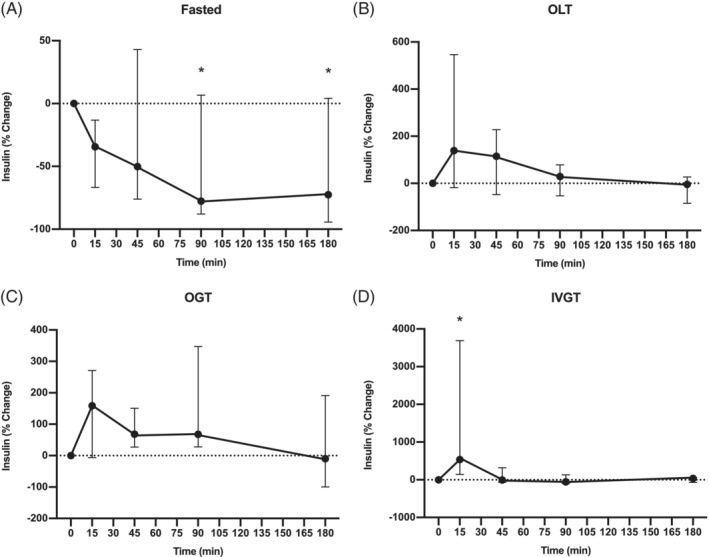
Methods: Foals were assigned to fasted (n = 6), IV glucose (IVGT; n = 5), PO glucose (OGT; n = 5), and PO lactose (OLT; n = 6) test groups. Blood samples were collected frequently for 210 minutes. Nursing was allowed from 180 to 210 minutes. Plasma glucagon, ACTH, serum insulin, and cortisol concentrations were measured using immunoassays.
Results: Plasma glucagon concentration decreased relative to baseline at 45, 90, and 180 minutes during the OLT (P = .03), but no differences occurred in other test groups. Nursing stimulated marked increases in plasma glucagon, serum insulin, and glucose concentrations in all test groups (P < .001). Plasma ACTH concentration increased relative to baseline at 180 minutes (P < .05) during fasting and OLT, but no differences occurred in other test groups. Serum cortisol concentration increased relative to baseline during OLT at 180 minutes (P = .04), but no differences occurred in other test groups. Nursing resulted in decreased plasma ACTH and serum cortisol concentrations in all test groups (P < .01).
Conclusions and clinical importance: The endocrine response to enterally and parenterally administered carbohydrates, including the major endocrine response to nursing, suggests that factors in milk other than carbohydrates are strong stimulators (directly or indirectly) of the endocrine pancreas and HPAA.
Keywords: ACTH; cortisol; energy axis; glucagon; neonate.
© 2021 The Authors. Journal of Veterinary Internal Medicine published by Wiley Periodicals LLC. on behalf of the American College of Veterinary Internal Medicine.
Conflict of interest statement
Authors declared no potential conflicts of interest.
Figures


Similar articles
-
The hypothalamic-pituitary-adrenal axis response to ovine corticotropin-releasing-hormone stimulation tests in healthy and hospitalized foals.J Vet Intern Med. 2023 Jan;37(1):292-301. doi: 10.1111/jvim.16604. Epub 2023 Jan 18. J Vet Intern Med. 2023. PMID: 36651191 Free PMC article.
-
Enteroinsular axis response to carbohydrates and fasting in healthy newborn foals.J Vet Intern Med. 2019 Nov;33(6):2752-2764. doi: 10.1111/jvim.15641. Epub 2019 Oct 30. J Vet Intern Med. 2019. PMID: 31664736 Free PMC article.
-
Renin-Angiotensin-aldosterone system and hypothalamic-pituitary-adrenal axis in hospitalized newborn foals.J Vet Intern Med. 2013 Mar-Apr;27(2):331-8. doi: 10.1111/jvim.12043. Epub 2013 Feb 11. J Vet Intern Med. 2013. PMID: 23398197
-
Dynamics of the regulation of the hypothalamo-pituitary-adrenal (HPA) axis determined using a nonsurgical method for collecting pituitary venous blood from horses.Front Neuroendocrinol. 1996 Jan;17(1):1-50. doi: 10.1006/frne.1996.0001. Front Neuroendocrinol. 1996. PMID: 8788568 Review.
-
Energy endocrine physiology, pathophysiology, and nutrition of the foal.J Am Vet Med Assoc. 2022 Oct 26;260(S3):S83-S93. doi: 10.2460/javma.22.08.0348. J Am Vet Med Assoc. 2022. PMID: 36288202 Review.
Cited by
-
Comparison of insulin sensitivity between healthy neonatal foals and horses using minimal model analysis.PLoS One. 2022 Jan 14;17(1):e0262584. doi: 10.1371/journal.pone.0262584. eCollection 2022. PLoS One. 2022. PMID: 35030228 Free PMC article.
-
Systemic absorption of triamcinolone acetonide is increased from intrasynovial versus extrasynovial sites and induces hyperglycemia, hyperinsulinemia, and suppression of the hypothalamic-pituitary-adrenal axis.Front Vet Sci. 2024 May 15;11:1388470. doi: 10.3389/fvets.2024.1388470. eCollection 2024. Front Vet Sci. 2024. PMID: 38828366 Free PMC article.
-
The hypothalamic-pituitary-adrenal axis response to ovine corticotropin-releasing-hormone stimulation tests in healthy and hospitalized foals.J Vet Intern Med. 2023 Jan;37(1):292-301. doi: 10.1111/jvim.16604. Epub 2023 Jan 18. J Vet Intern Med. 2023. PMID: 36651191 Free PMC article.
References
-
- Stammers JP, Hull D, Leadon DP, et al. Maternal and umbilical venous plasma lipid concentrations at delivery in the mare. Equine Vet J. 1991;23:119‐122. - PubMed
-
- Berg EL, McNamara DL, Keisler DH. Endocrine profiles of periparturient mares and their foals. J Anim Sci. 2007;85:1660‐1668. - PubMed
-
- Holdstock NB, Allen VL, Fowden AL. Pancreatic endocrine function in newborn pony foals after induced or spontaneous delivery at term. Equine Vet J Suppl. 2012;44:30‐37. - PubMed
-
- Silver M, Ousey JC, Dudan FE, et al. Studies on equine prematurity 2: post natal adrenocortical activity in relation to plasma adrenocorticotrophic hormone and catecholamine levels in term and premature foals. Equine Vet J. 1984;16:278‐286. - PubMed
MeSH terms
Substances
Grants and funding
LinkOut - more resources
Full Text Sources
Other Literature Sources
Miscellaneous
