

Candidate regulators and target genes of drought stress in needles and roots of Norway spruce
- PMID: 33416078
- PMCID: PMC8271197
- DOI: 10.1093/treephys/tpaa178
Candidate regulators and target genes of drought stress in needles and roots of Norway spruce
Abstract
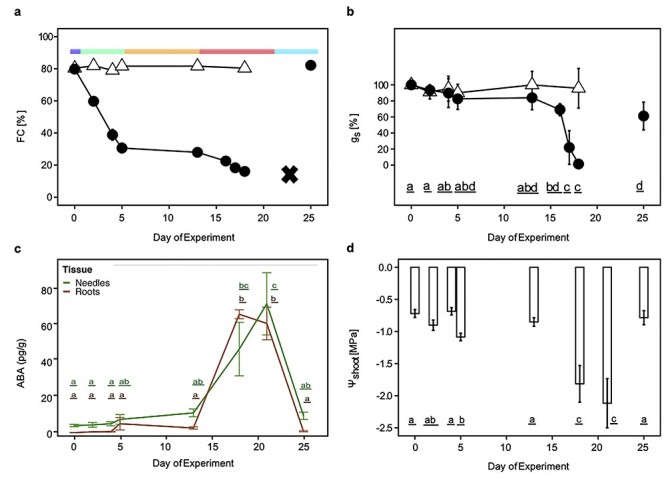
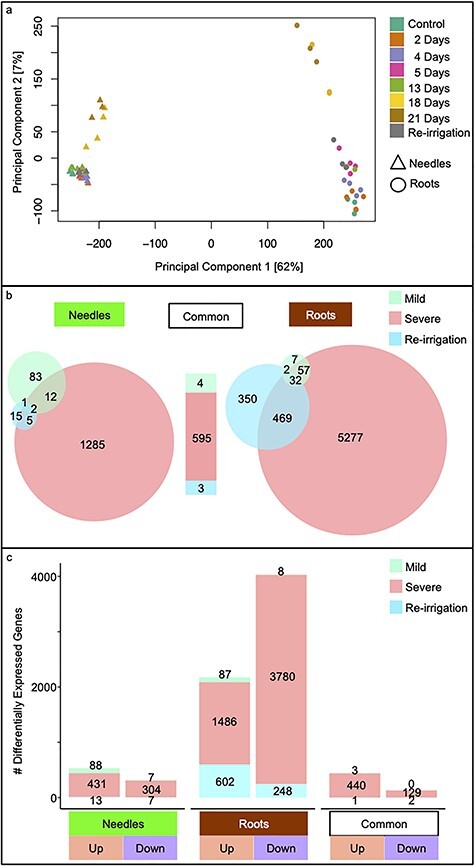
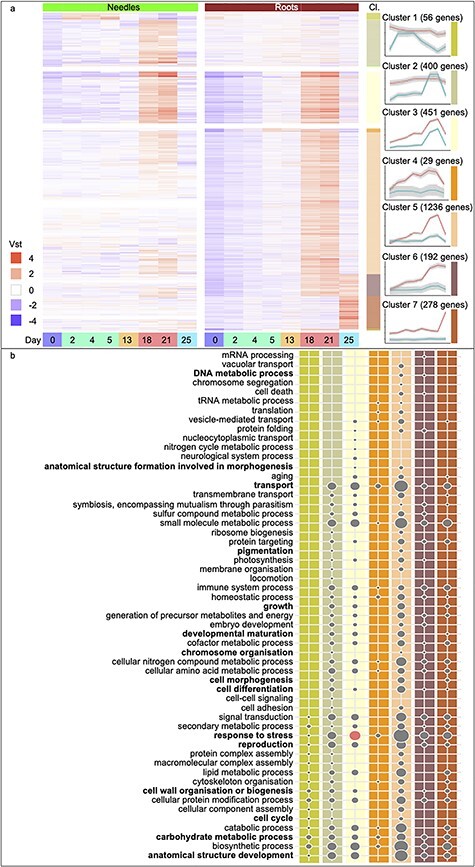
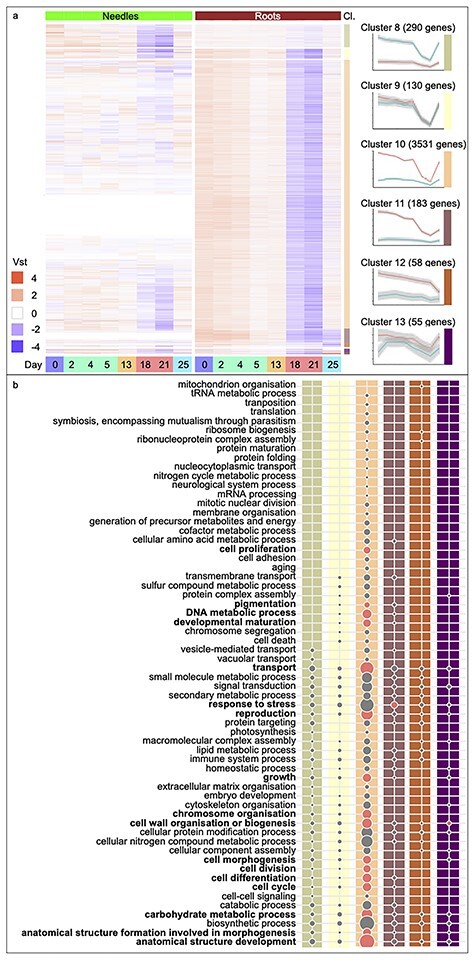
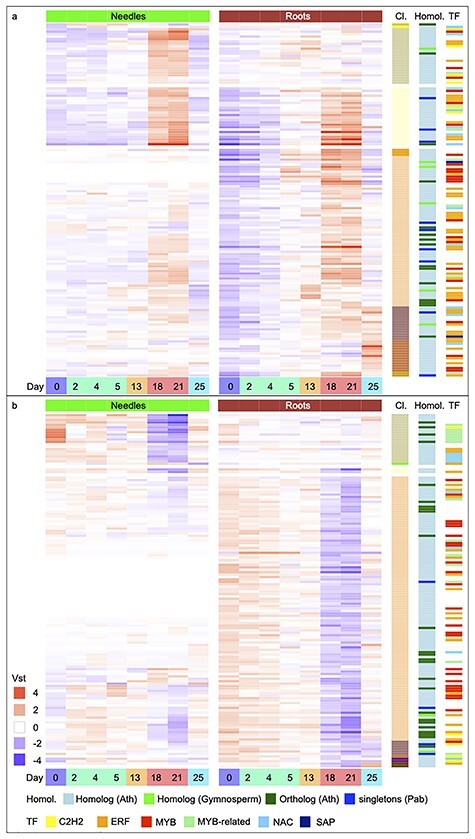
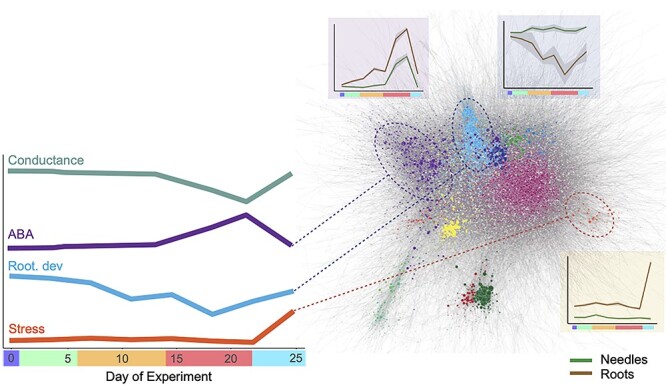
Drought stress impacts seedling establishment, survival and whole-plant productivity. Molecular responses to drought stress have been most extensively studied in herbaceous species, mostly considering only aboveground tissues. Coniferous tree species dominate boreal forests, which are predicted to be exposed to more frequent and acute drought as a result of ongoing climate change. The associated impact at all stages of the forest tree life cycle is expected to have large-scale ecological and economic impacts. However, the molecular response to drought has not been comprehensively profiled for coniferous species. We assayed the physiological and transcriptional response of Picea abies (L.) H. Karst seedling needles and roots after exposure to mild and severe drought. Shoots and needles showed an extensive reversible plasticity for physiological measures indicative of drought-response mechanisms, including changes in stomatal conductance (gs), shoot water potential and abscisic acid (ABA). In both tissues, the most commonly observed expression profiles in response to drought were highly correlated with the ABA levels. Still, root and needle transcriptional responses contrasted, with extensive root-specific down-regulation of growth. Comparison between previously characterized Arabidopsis thaliana L. drought-response genes and P. abies revealed both conservation and divergence of transcriptional response to drought. In P. abies, transcription factors belonging to the ABA responsive element(ABRE) binding/ABRE binding factors ABA-dependent pathway had a more limited role. These results highlight the importance of profiling both above- and belowground tissues, and provide a comprehensive framework to advance the understanding of the drought response of P. abies. The results demonstrate that a short-term, severe drought induces severe physiological responses coupled to extensive transcriptome modulation and highlight the susceptibility of Norway spruce seedlings to such drought events.
Keywords: Picea abies; ABA; Norway spruce; RNA-Seq; drought stress; gene expression; transcriptome.
© The Author(s) 2021. Published by Oxford University Press. All rights reserved. For permissions, please e-mail: journals.permission@oup.com.
Conflict of interest statement
None declared.
Figures
Similar articles
-
Dynamics of internal isoprenoid metabolites in young Picea abies (Norway spruce) shoots during drought stress conditions in springtime.Phytochemistry. 2022 Nov;203:113414. doi: 10.1016/j.phytochem.2022.113414. Epub 2022 Aug 31. Phytochemistry. 2022. PMID: 36057316
-
Comparative analysis of abscisic acid levels and expression of abscisic acid-related genes in Scots pine and Norway spruce seedlings under water deficit.Plant Physiol Biochem. 2019 Jul;140:105-112. doi: 10.1016/j.plaphy.2019.04.037. Epub 2019 Apr 30. Plant Physiol Biochem. 2019. PMID: 31091491
-
Silver fir and Douglas fir are more tolerant to extreme droughts than Norway spruce in south-western Germany.Glob Chang Biol. 2017 Dec;23(12):5108-5119. doi: 10.1111/gcb.13774. Epub 2017 Jun 26. Glob Chang Biol. 2017. PMID: 28556403
-
Below versus above Ground Plant Sources of Abscisic Acid (ABA) at the Heart of Tropical Forest Response to Warming.Int J Mol Sci. 2018 Jul 12;19(7):2023. doi: 10.3390/ijms19072023. Int J Mol Sci. 2018. PMID: 30002274 Free PMC article. Review.
-
How tree roots respond to drought.Front Plant Sci. 2015 Jul 29;6:547. doi: 10.3389/fpls.2015.00547. eCollection 2015. Front Plant Sci. 2015. PMID: 26284083 Free PMC article. Review.
Cited by
-
Soil Microbiome Influences on Seedling Establishment and Growth of Prosopis chilensis and Prosopis tamarugo from Northern Chile.Plants (Basel). 2022 Oct 14;11(20):2717. doi: 10.3390/plants11202717. Plants (Basel). 2022. PMID: 36297741 Free PMC article.
-
A metabolomic study of Gomphrena agrestis in Brazilian Cerrado suggests drought-adaptive strategies on metabolism.Sci Rep. 2021 Jun 21;11(1):12933. doi: 10.1038/s41598-021-92449-9. Sci Rep. 2021. PMID: 34155311 Free PMC article.
-
Contrasted NCED gene expression across conifers with rising and peaking abscisic acid responses to drought.Plant Stress. 2024 Dec;14:None. doi: 10.1016/j.stress.2024.100574. Plant Stress. 2024. PMID: 40110485 Free PMC article.
-
Tissue-specific transcriptome analysis of drought stress and rehydration in Trachycarpus fortunei at seedling.PeerJ. 2021 Apr 1;9:e10933. doi: 10.7717/peerj.10933. eCollection 2021. PeerJ. 2021. PMID: 33850641 Free PMC article.
-
The Plastid-Localized AtFtsHi3 Pseudo-Protease of Arabidopsis thaliana Has an Impact on Plant Growth and Drought Tolerance.Front Plant Sci. 2021 Jun 23;12:694727. doi: 10.3389/fpls.2021.694727. eCollection 2021. Front Plant Sci. 2021. PMID: 34249066 Free PMC article.
References
-
- Agarwal M, Hao YJ, Kapoor A, Dong CH, Fujii H, Zheng XW, Zhu JK (2006) A R2R3 type MYB transcription factor is involved in the cold regulation of CBF genes and in acquired freezing tolerance. J Biol Chem 281:37636–37645. - PubMed
-
- Allen CD, Macalady AK, Chenchouni H et al. (2010) A global overview of drought and heat-induced tree mortality reveals emerging climate change risks for forests. For Ecol Manage 259:660–684.
Publication types
MeSH terms
Grants and funding
LinkOut - more resources
Full Text Sources
Other Literature Sources
