Clinical Trial
. 2021 Feb;47(2):533-546.
doi: 10.3892/ijmm.2020.4806. Epub 2020 Dec 2.

MicroRNA‑34a‑5p expression in the plasma and in its extracellular vesicle fractions in subjects with Parkinson's disease: An exploratory study

Affiliations
Clinical Trial

MicroRNA‑34a‑5p expression in the plasma and in its extracellular vesicle fractions in subjects with Parkinson's disease: An exploratory study

Ilaria Grossi et al. Int J Mol Med. 2021 Feb.

Abstract

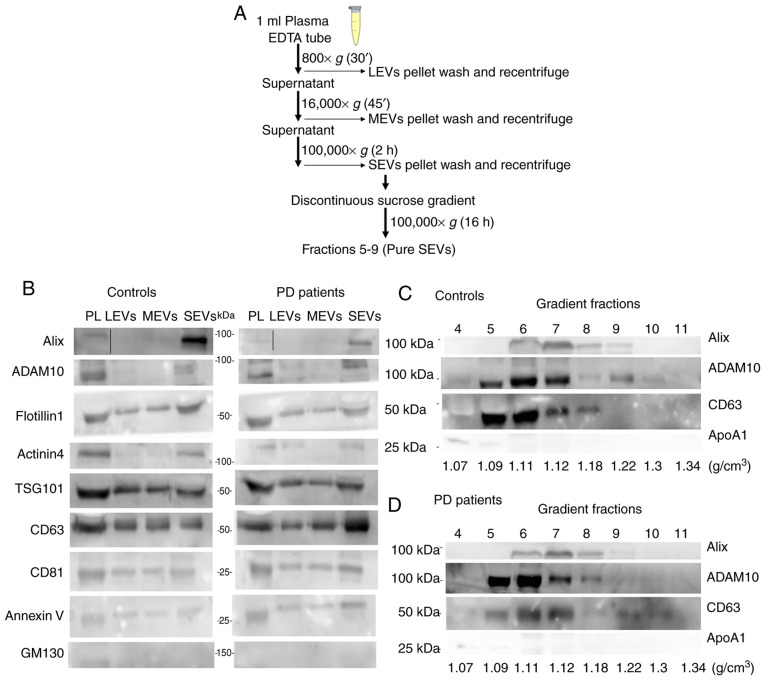
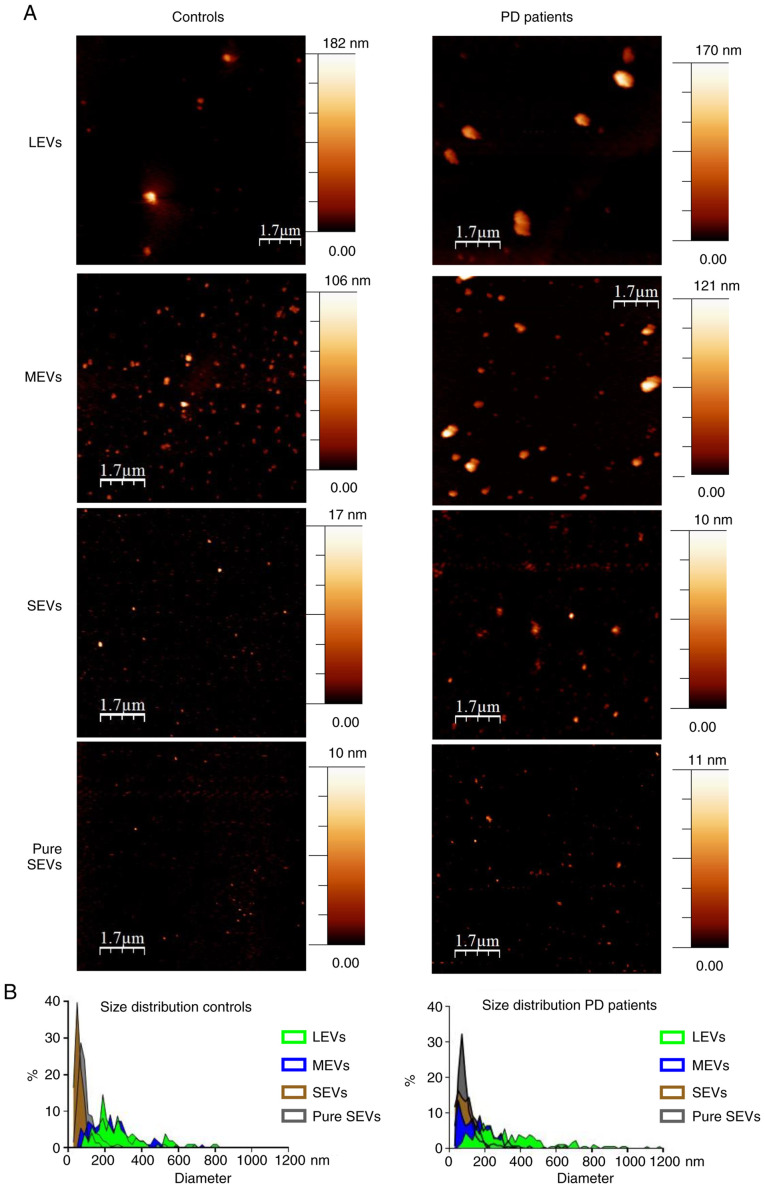
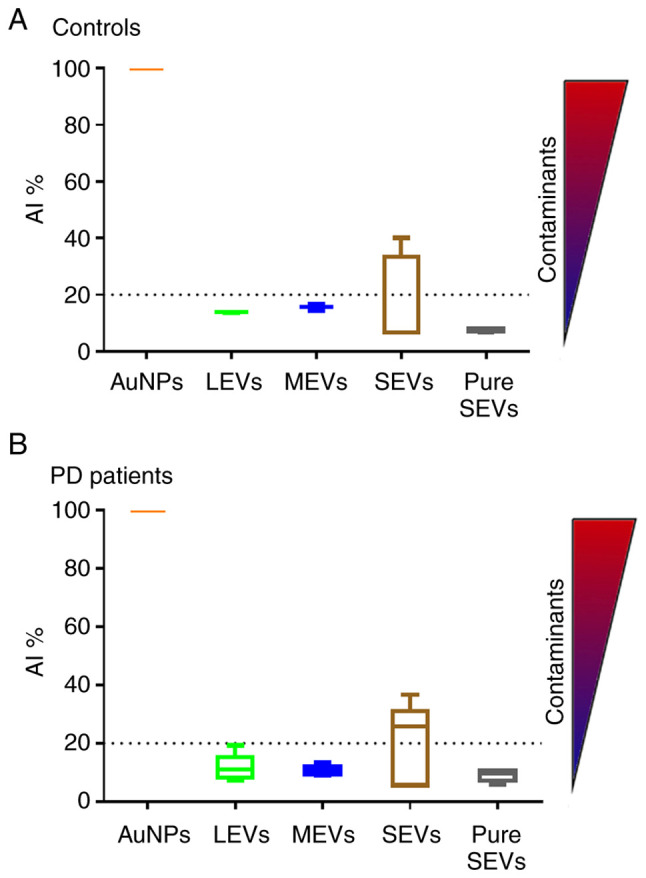
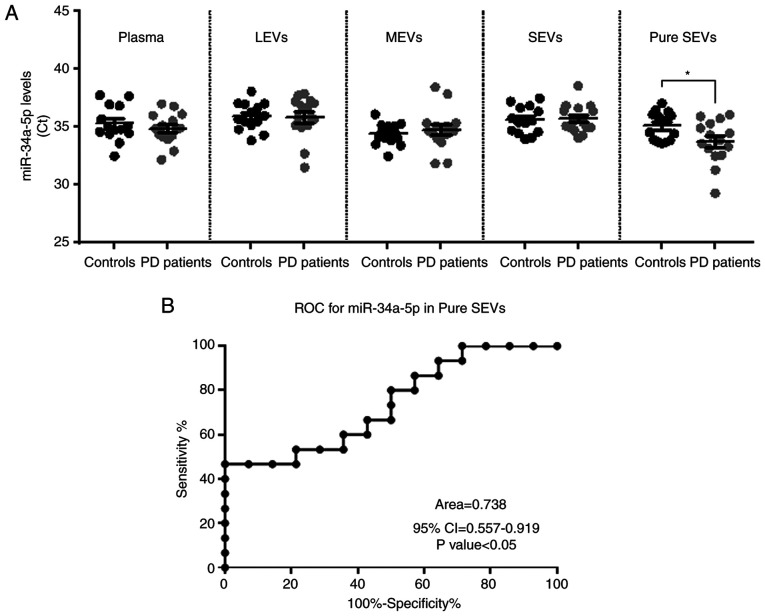
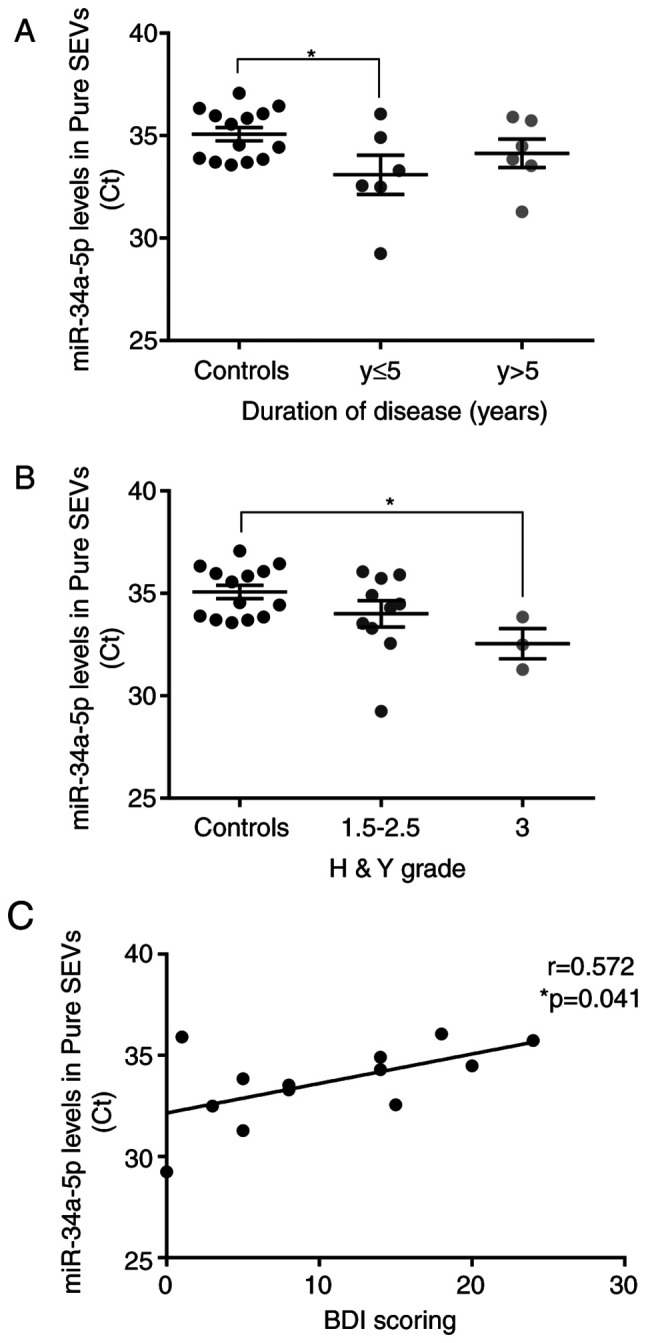
Parkinson's disease (PD) is an important disabling age‑related disorder and is the second most common neurodegenerative disease. Currently, no established molecular biomarkers exist for the early diagnosis of PD. Circulating microRNAs (miRNAs), either vesicle‑free or encapsulated in extracellular vesicles (EVs), have emerged as potential blood‑based biomarkers also for neurodegenerative diseases. In this exploratory study, we focused on miR‑34a‑5p because of its well‑documented involvement in neurobiology. To explore a differential profile of circulating miR‑34a‑5p in PD, PD patients and age‑matched control subjects were enrolled. Serial ultracentrifugation steps and density gradient were used to separate EV subpopulations from plasma according to their different sedimentation properties (Large, Medium, Small EVs). Characterization of EV types was performed using western blotting and atomic force microscopy (AFM); purity from protein contaminants was checked with the colorimetric nanoplasmonic assay. Circulating miR‑34a‑5p levels were evaluated using qPCR in plasma and in each EV type. miR‑34a‑5p was significantly up‑regulated in small EVs devoid of exogenous protein contaminants (pure SEVs) from PD patients and ROC analysis indicated a good diagnostic performance in discriminating patients from controls (AUC=0.74, P<0.05). Moreover, miR‑34a‑5p levels in pure SEVs were associated with disease duration, Hoehn and Yahr and Beck Depression Inventory scores. These results underline the necessity to examine the miRNA content of each EV subpopulation to identify miRNA candidates with potential diagnostic value and lay the basis for future studies to validate the overexpression of circulating miR‑34a‑5p in PD via the use of pure SEVs.

Keywords: Parkinson's disease; human plasma; extracellular vesicles; microRNAs; miR-34a-5p.


Figures

Figure 1
Figure 1
Biochemical characterization of EVs by western blot analysis. (A) Scheme of the serial ultracentrifugation protocol used to isolate the different EV subtypes. (B) Plasma (PL, 30 µg), EVs pelleted at 800 × g for 30 min (LEVs), EVs pelleted at 16,000 × g for 45 min (MEVs), EVs pelleted at 100,000 × g for 2 h (SEVs) preparations (20 µl) both from controls and PD patients were loaded. Gradient fractions from either controls (C) or PD patients (D) obtained with discontinuous sucrose gradient. Top numbers refer to the corresponding gradient fraction. Bottom numbers refer to sucrose density (g/cm3) for each fraction. Samples were electrophoresed on SDS-PAGE gel and analyzed using the antibodies described in the figures. PL, plasma; LEVs, large extracellular vesicles; MEVs, medium extracellular vesicles; SEVs, small extracellular vesicles.
Figure 2
Figure 2
Imaging of different EV preparations. (A) Atomic force microscopy (AFM) topography image of the LEVs, MEVs, SEVs and gradient fractions positive to EV markers (from 5 to 9, pure SEVs), preparations from controls and PD patients. Samples were adsorbed onto mica sheets, as mentioned in Materials and methods section (scale bar is indicated in each image; colorimetric scale, on the right of AFM images, indicates the maximum height detected in each image). (B) Size distribution obtained from analysis of AFM images such as in (A) A total of >500 objects (both for controls and PD patients) were analyzed for LEVs (green), MEVs (blue), SEVs (brown) and pure SEVs (grey) fractions. Numbers on graphs indicate the diameter (in nm), of each preparation from controls and PD patients respectively. LEVs, large extracellular vesicles; MEVs, medium extracellular vesicles; SEVs, small extracellular vesicles.
Figure 3
Figure 3
Determination of EV preparation purity from protein contaminants using CONAN assay. Normalized Aggregation Index (AI) of disperse gold nanoparticles (AuNPs), LEVs (green), MEVs (blue), SEVs (brown) and pure SEVs (grey) fractions are shown in the graph for either controls (A) and PD patients (B). AI decreases along with the change of the solution color from red to blue (as indicated by the color scale) and is inversely proportional to the purity of preparation. Dotted line represents the 20% of AuNPs AI. LEVs, large extracellular vesicles; MEVs, medium extracellular vesicles; SEVs, small extracellular vesicles.
Figure 4
Figure 4
Gene Ontology Top 10 significant terms belonging to the cellular component (red), biological process (green), molecular function (blue) categories and KEGG pathways (yellow). The GO terms reported in bold are related to nervous system. T.r.a., Transcription repressor activity.
Figure 5
Figure 5
Levels of miR-34a-5p in plasma and different EV types from either control subjects or PD patients. (A) Dot-plots show the miR-34a-5p Ct values determined by qPCR in plasma and plasmatic EVs for each subject (ncontrols=14; nPD patients=15); each dot represents a sample while largest bar represents the average ± SEM. miR-34a-5p levels were significantly higher in pure SEVs of PD patients compared to controls; *P<0.05 using unpaired t-test analysis. No significant differences were observed for plasma and in the other types of EVs. (B) ROC analysis for the ability of miR-34a-5p levels in pure SEVs to discriminate between control individuals and PD patients. LEVs, large extracellular vesicles; MEVs, medium extracellular vesicles; SEVs, small extracellular vesicles.
Figure 6
Figure 6
Correlation between the level of miR-34a-5p found in pure SEVs with clinical parameters of PD patients. (A) miR-34a-5p levels were significantly higher in pure SEVs of PD patients within five years from onset compared to controls. (B) miR-34a-5p was significantly upregulated in pure SEVs of PD patients with higher Hoer&Yahr grade (H&Y grade) compared to controls. One-way ANOVA was used for multiple comparisons among groups followed by Bonferroni's test; *P<0.05. (C) Positive correlation was found between Ct values for miR-34a-5p levels in plasmatic pure SEVs and Beck Depression Inventory (BDI) scoring of PD patients. Correlation was tested with Pearson's correlation analysis, *P<0.05. Pure SEVs, pure small extracellular vesicles.

References

    1. Tysnes OB, Storstein A. Epidemiology of Parkinson's disease. J Neural Transm (Vienna) 2017;12:901–905. doi: 10.1007/s00702-017-1686-y. - DOI - PubMed
    1. Spillantini MG, Goedert M. Neurodegeneration and the ordered assembly of α-synuclein. Cell Tissue Res. 2018;373:137–148. doi: 10.1007/s00441-017-2706-9. - DOI - PMC - PubMed
    1. Bellucci A, Mercuri NB, Venneri A, Faustini G, Longhena F, Pizzi M, Missale C, Spano P. parkinson's disease: From synaptic loss to connectome dysfunction. Neuropathol Appl Neurobiol. 2016;42:77–94. doi: 10.1111/nan.12297. - DOI - PubMed
    1. Thompson AG, Gray E, Heman-Ackah SM, Mäger I, Talbot K, El Andaloussi S, Wood MJ, Turner MR. Extracellular vesicles in neurodegenerative disease-pathogenesis to biomarkers. Nat Rev Neurol. 2016;12:346–357. doi: 10.1038/nrneurol.2016.68. - DOI - PubMed
    1. Tofaris GK. A critical assessment of exosomes in the pathogenesis and stratification of parkinson's disease. J Parkinsons Dis. 2017;7:569–579. doi: 10.3233/JPD-171176. - DOI - PMC - PubMed

Publication types