. 2021 Jan 8:10:e63545.
doi: 10.7554/eLife.63545.

Mutations in SKI in Shprintzen-Goldberg syndrome lead to attenuated TGF-β responses through SKI stabilization

Affiliations

Mutations in SKI in Shprintzen-Goldberg syndrome lead to attenuated TGF-β responses through SKI stabilization

Ilaria Gori et al. Elife. .

Abstract

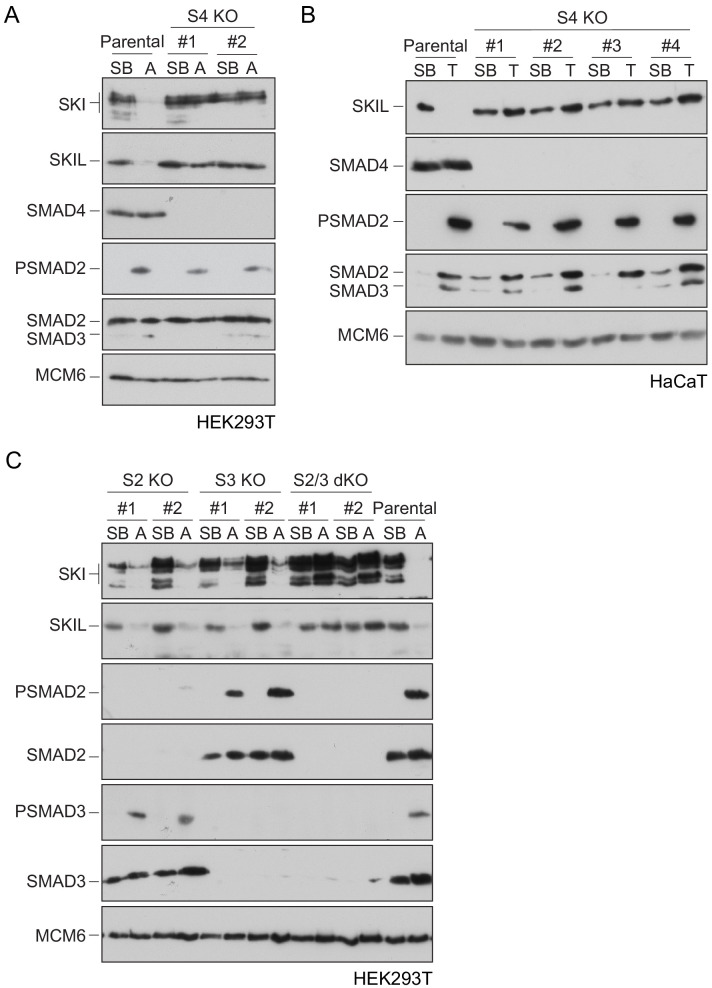
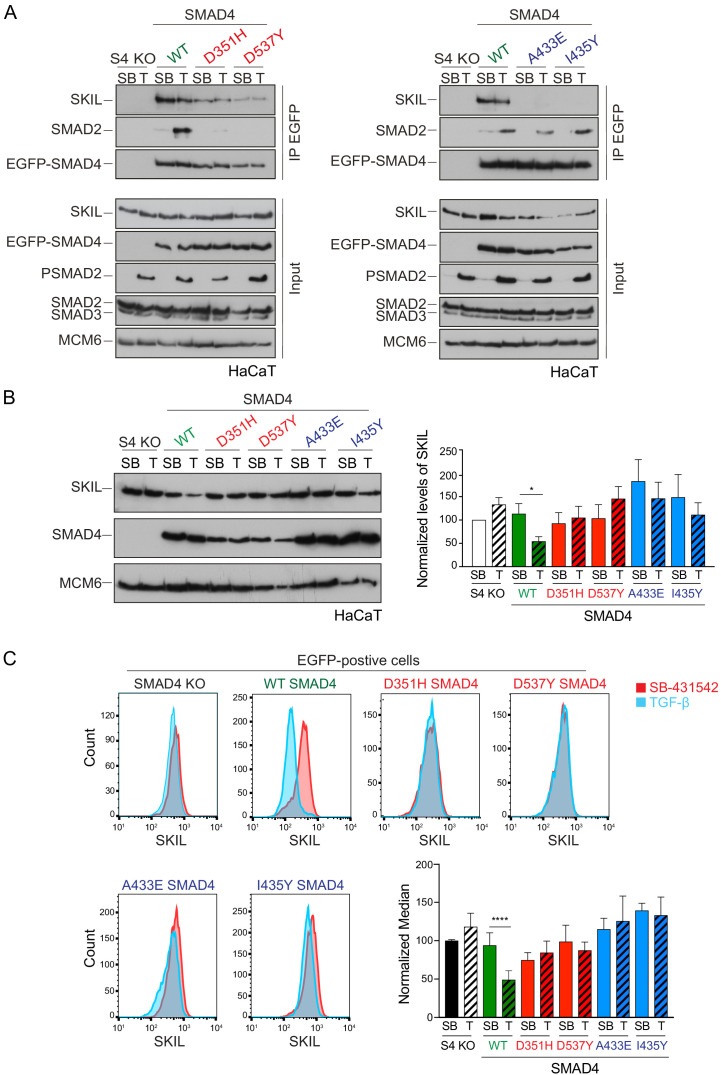
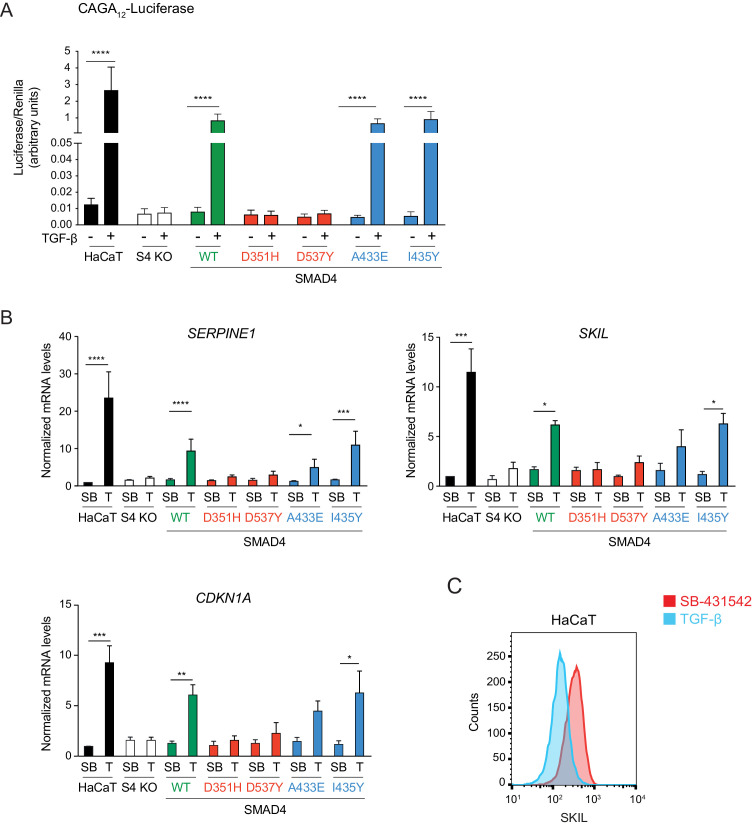
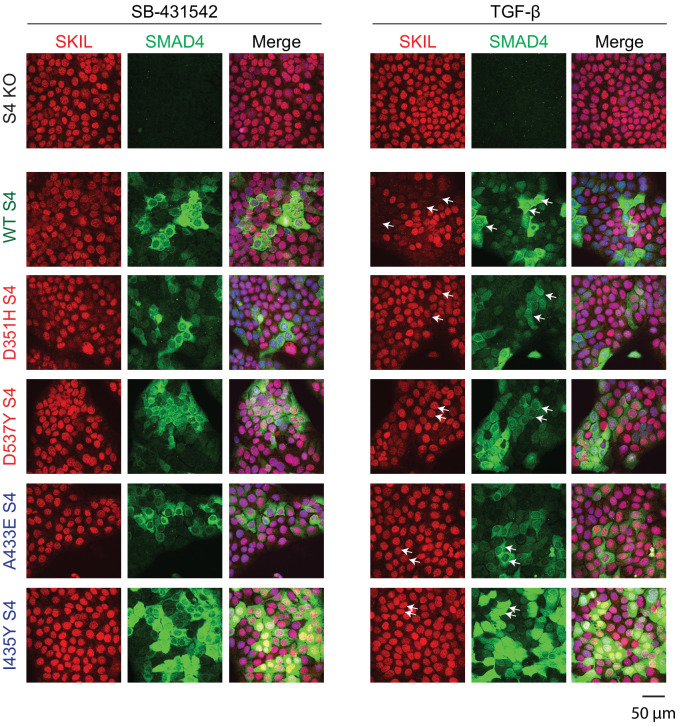
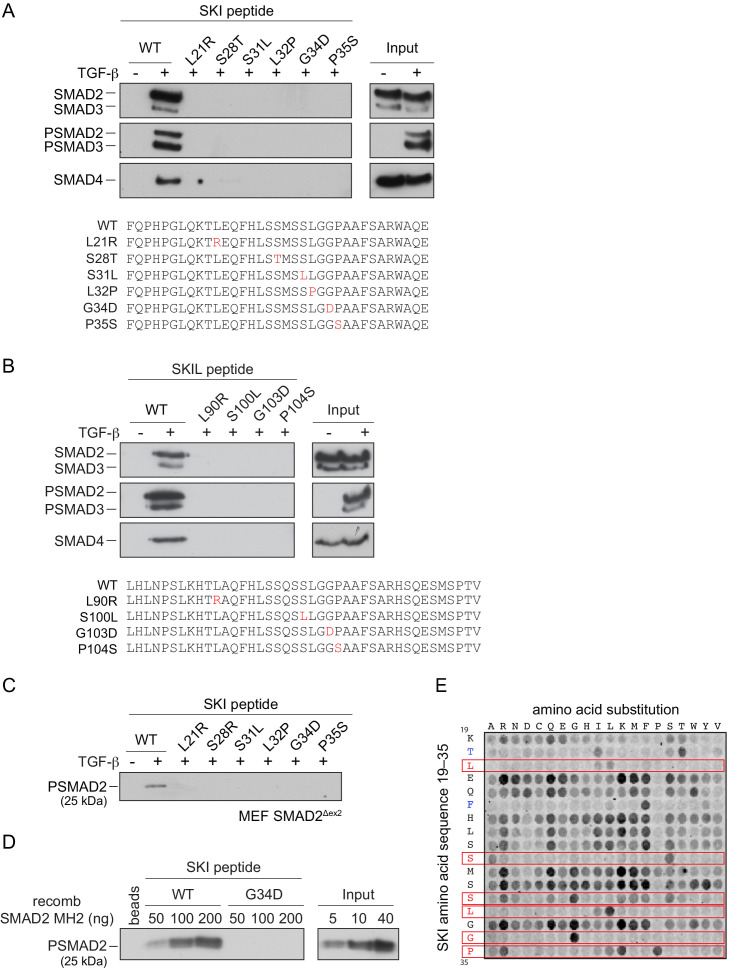
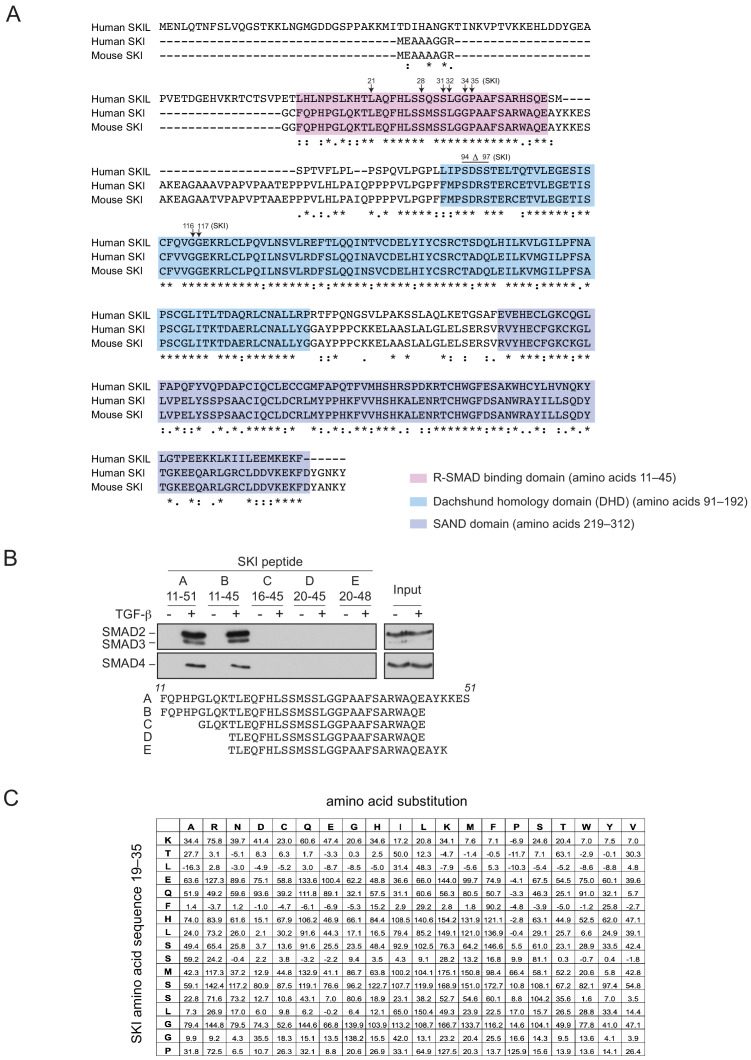
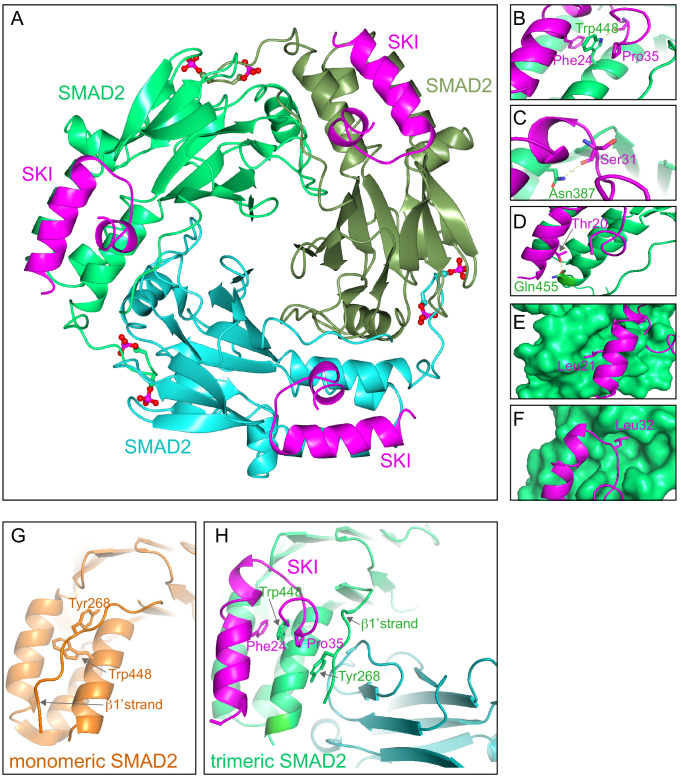
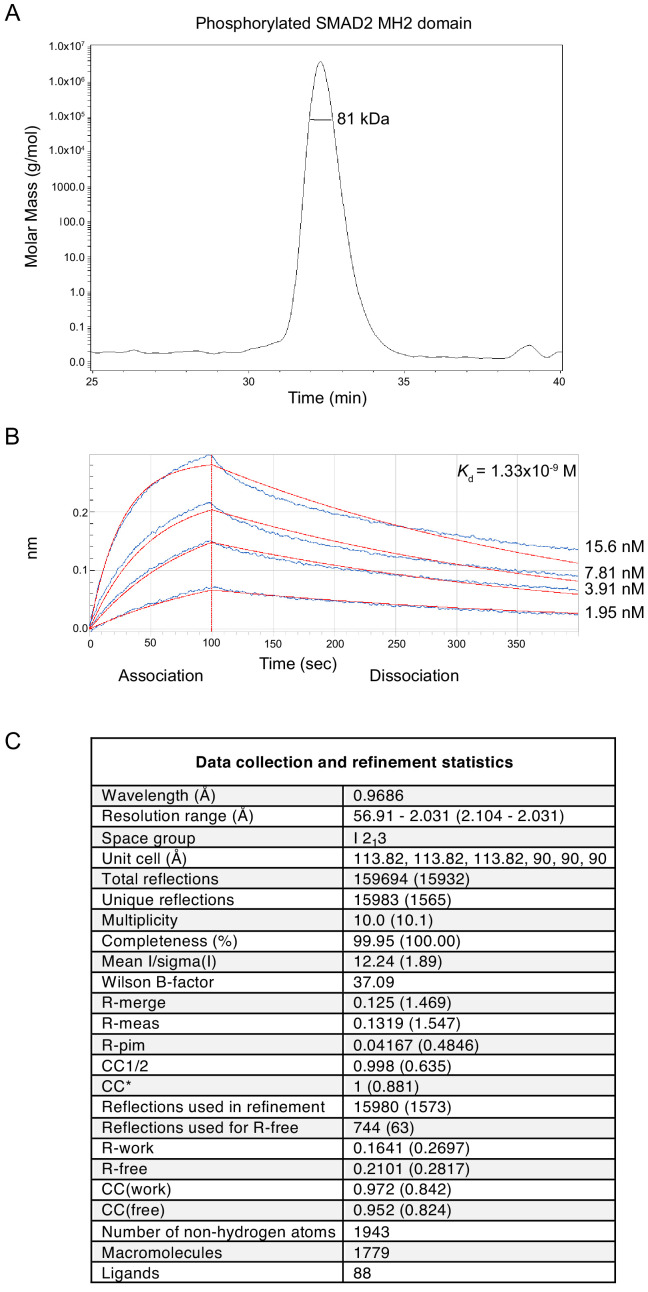
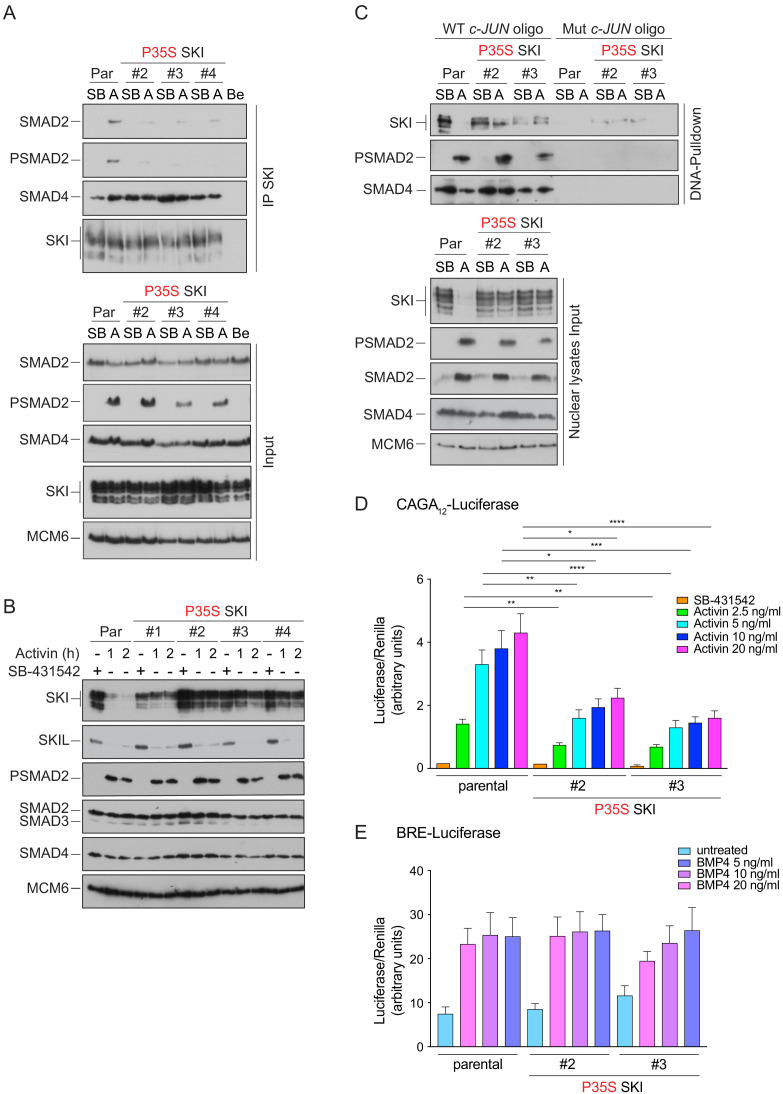
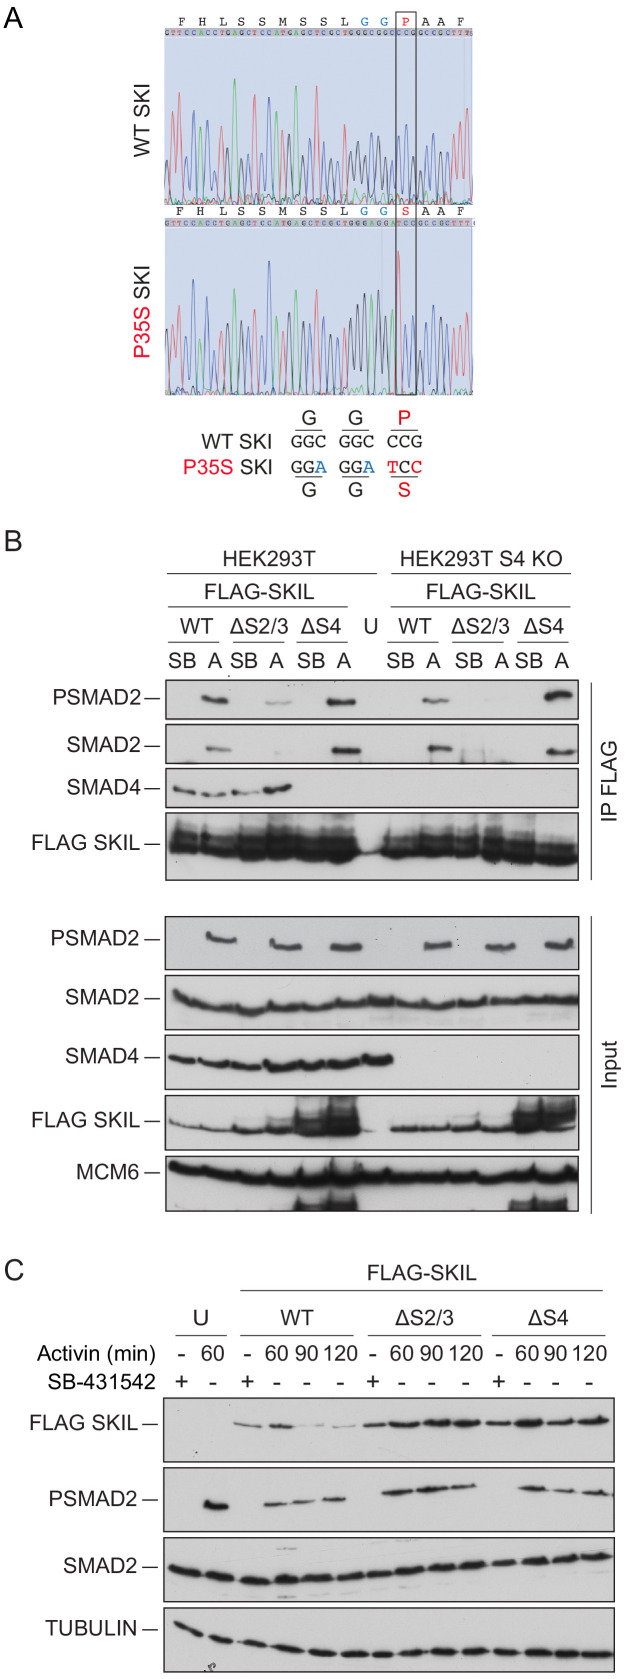
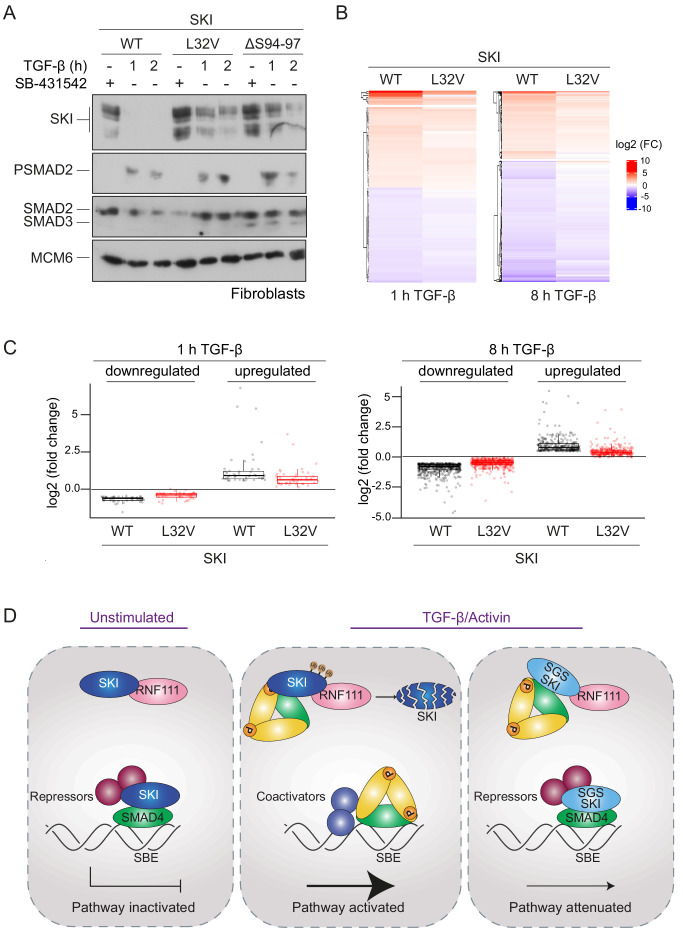
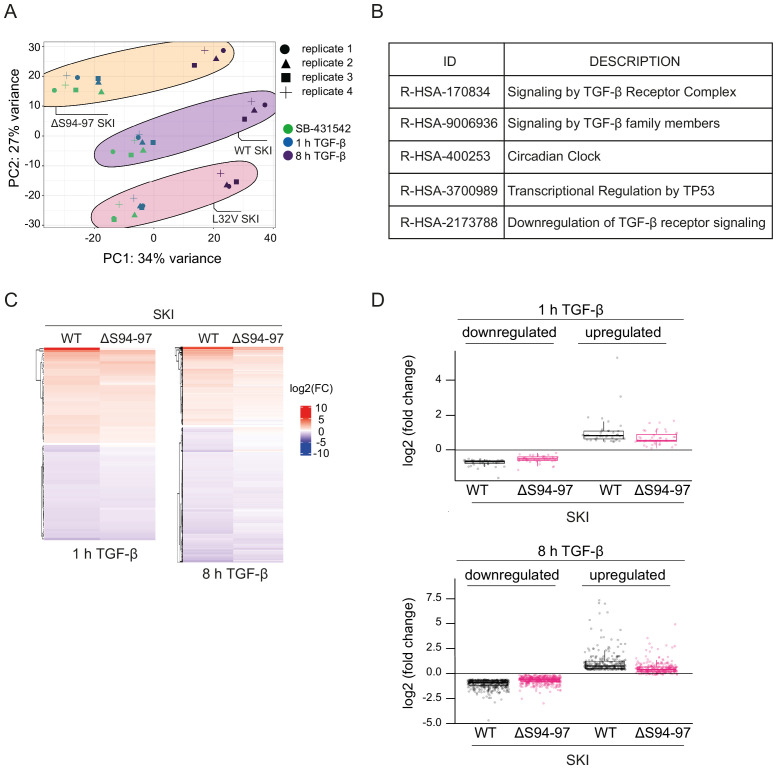
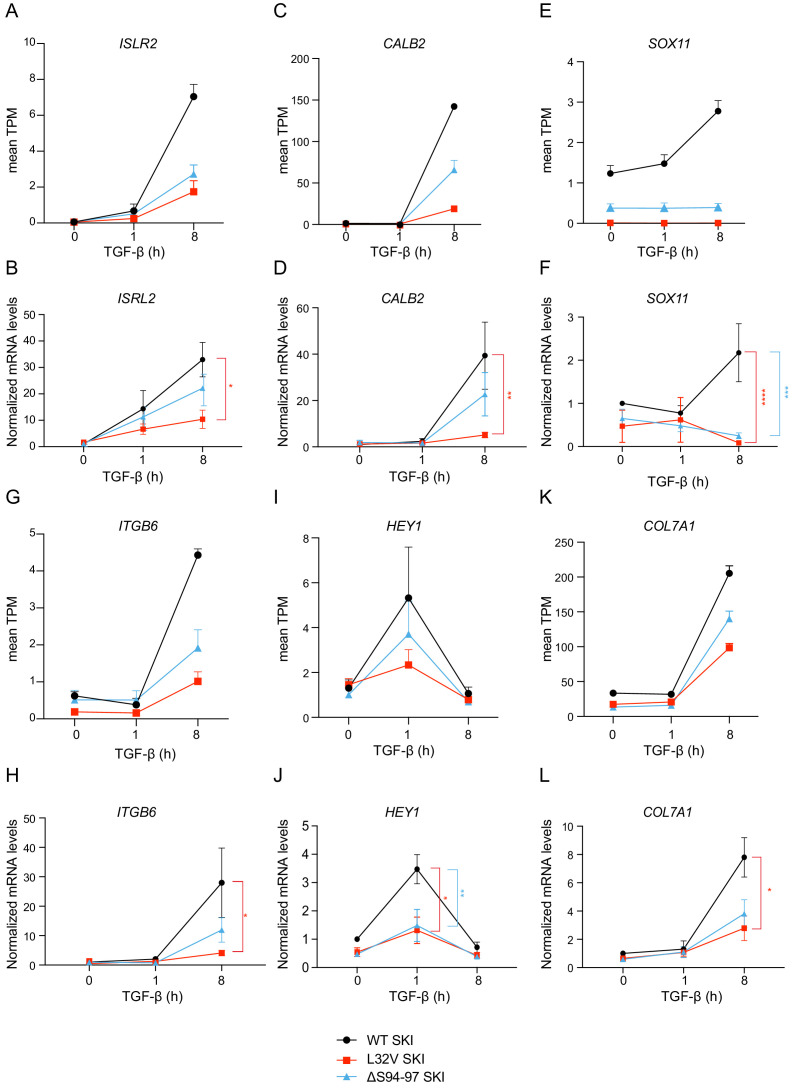
Shprintzen-Goldberg syndrome (SGS) is a multisystemic connective tissue disorder, with considerable clinical overlap with Marfan and Loeys-Dietz syndromes. These syndromes have commonly been associated with enhanced TGF-β signaling. In SGS patients, heterozygous point mutations have been mapped to the transcriptional co-repressor SKI, which is a negative regulator of TGF-β signaling that is rapidly degraded upon ligand stimulation. The molecular consequences of these mutations, however, are not understood. Here we use a combination of structural biology, genome editing, and biochemistry to show that SGS mutations in SKI abolish its binding to phosphorylated SMAD2 and SMAD3. This results in stabilization of SKI and consequently attenuation of TGF-β responses, both in knockin cells expressing an SGS mutation and in fibroblasts from SGS patients. Thus, we reveal that SGS is associated with an attenuation of TGF-β-induced transcriptional responses, and not enhancement, which has important implications for other Marfan-related syndromes.

Keywords: Activin; Marfan syndrome; SKI; SMAD; Shprintzen-Goldberg syndrome; TGF-β; biochemistry; chemical biology; chromosomes; gene expression; human.


Conflict of interest statement

IG, RG, AP, SS, RR, RO, VC, LF, DJ, SK, CH No competing interests declared

Figures

Figure 1.
Figure 1.. Requirement of SMAD2 or SMAD3 and SMAD4 for SKI and SKIL degradation.
(A and C) The parental HEK293T cell line and two individual SMAD4 knockout clones (A) or two individual SMAD2, SMAD3 knockout clones, or two SMAD2 and SMAD3 double knockout clones (C) were incubated overnight with 10 μM SB-431542, washed out, then incubated with full media containing either SB-431542 or 20 ng/ml Activin A for 1 hr, as indicated. Whole-cell extracts were immunoblotted with the antibodies indicated. (B) Parental HaCaT and four individual SMAD4 knockout clones were treated as above, except that they were treated with 2 ng/ml TGF-β for 1 hr instead of Activin A. Nuclear lysates were immunoblotted using the antibodies indicated. SB, SB-431542; A, Activin A; T, TGF-β; S2, SMAD2; S3, SMAD3; S2/3, SMAD2 and SMAD3; S4, SMAD4; KO, knockout; dKO, double knockout.
Figure 1—figure supplement 1.
Figure 1—figure supplement 1.. SMAD4 is essential for TGF-β/Activin-induced transcriptional responses.
(A and B) HEK293T (A) or HaCaT (B) parental cells and individual clones of SMAD4 knockout cells were transiently transfected with CAGA12-Luciferase together with TK-Renilla as an internal control and a plasmid expressing human SMAD4 as indicated (A and B). Cells were incubated with 0.5% fetal bovine serum-containing media overnight and then treated with 20 ng/ml Activin (A) or 2 ng/ml TGF-β (B) for 8 hr. Cell lysates were prepared and Luciferase/Renilla activity was measured. Plotted are the means ± SEM of three independent experiments. The p-values are from one-way ANOVA with Tukey’s post hoc correction. *p<0.05; ***p<0.001; ****p<0.0001. (C) HaCaT parental and four independent clones of SMAD4 knockout cells were either untreated or incubated with either 2 ng/ml TGF-β or 20 ng/ml BMP4 for 1 hr (SMAD7, JUNB, ID1, and ID3) or 6 hr (SERPINE1 and SKIL). Total RNA was extracted and qPCR was used to assess the levels of mRNA for the genes shown. The data are the average of three or four experiments ± SEM. The p-values are from one-way ANOVA with Tukey’s post hoc correction. **p<0.01; ***p<0.001; ****p<0.0001. Par, parental; S4 KO, SMAD4 knockout.
Figure 2.
Figure 2.. Characterization of the role of SMAD4 in TGF-β-induced SKIL degradation.
(A–C) HaCaT SMAD4 knockout (S4 KO) cells were stably transfected with EGFP alone, or EGFP SMAD4 (WT) or with four different EGFP-SMAD4 mutants (D351H, D537Y, which abolish interaction with the R-SMADs, and A433E and I435Y, which do not interact with SKIL). (A) Cells were incubated overnight with 10 µM SB-431542, washed out and pre-incubated with 25 μM MG-132 for 3 hr, and then treated either with 10 μM SB-431542 or 2 ng/ml TGF-β for 1 hr. Whole-cell extracts were immunoprecipitated (IP) with GFP-trap agarose beads. The IPs were immunoblotted using the antibodies shown. Inputs are shown below. (B) Nuclear lysates were prepared from the HaCaT S4 KO cells stably transfected with EGFP alone or with EGFP-SMAD4 constructs as indicated, treated as in (A), but without the MG-132 step and immunoblotted using the antibodies shown. On the right the quantifications are the normalized average ± SEM of five independent experiments. The quantifications are expressed as fold changes relative to SB-431542-treated S4 KO cells. (C) Levels of SKIL in the EGFP-positive S4 KO rescue cell lines treated as in (B), assayed by flow cytometry. Each panel shows an overlay of the indicated treatment conditions. The red line indicates the SB-431542-treated sample, whereas the cyan line indicates the TGF-β-treated sample. Quantifications are shown bottom right. For each group, the percentage of the median fluorescence intensity normalized to the SB-431542-treated sample is quantified. Data are the mean ± SEM of five independent experiments. The p-values are from one-way ANOVA with Sidak’s post hoc correction *p<0.05; ****p<0.0001. SB, SB-431542; T, TGF-β.
Figure 2—figure supplement 1.
Figure 2—figure supplement 1.. Transcriptional activity of the SMAD4 mutants compared to WT SMAD4.
(A) Parental HaCaT, SMAD4 knockout clone 2 stably transfected with EGFP alone (S4 KO), or with EGFP fusions of WT SMAD4 or the four indicated SMAD4 mutants were transiently transfected with CAGA12-Luciferase together with TK-Renilla as an internal control. Cells were untreated or treated with 2 ng/ml TGF-β for 8 hr. Luciferase/Renilla activity was measured on whole-cell lysates. Plotted are the means ± SEM of four independent experiments. The p-values are from one-way ANOVA with Tukey’s post hoc correction. ****p<0.0001. (B) Parental HaCaT and SMAD4 knockout clone 2 cells stably transfected as in (A) were incubated overnight with 10 μM SB-431542, washed out, and then retreated with SB-431542 (SB) or with 2 ng/ml TGF-β (T) for 6 hr. Total RNA was extracted and qPCR was performed for the genes shown. Plotted are the means ± SEM of four independent experiments. The p-values are from two-way ANOVA with Sidak’s post hoc test. *p<0.05; **p<0.01; ***p<0.001; ****p<0.0001. (C) Levels of SKIL in parental HaCaT cells were measured by flow cytometry 1 hr after incubation with 10 μM SB-431542 or after treatment for 1 hr with 2 ng/ml TGF-β. The panel shows an overlay of the indicated treatment conditions. The red line indicates the SB-431542-treated sample, while the cyan line represents the TGF-β-treated sample.
Figure 3.
Figure 3.. Visualization of TGF-β-induced SKIL degradation.
HaCaT SMAD4 knockout (S4 KO) cells or those stably expressing EGFP SMAD4 WT or EGFP SMAD4 mutants were incubated overnight with 10 μM SB-431542, washed out, and incubated for 1 hr with 10 µM SB-431542 or with 2 ng/ml TGF-β. Cells were fixed and stained for EGFP (for SMAD4), SKIL, and with DAPI (blue) to mark nuclei and imaged by confocal microscopy. The merge combines SKIL, SMAD4, and DAPI staining. Arrows indicate examples of EGFP-expressing cells and corresponding levels of nuclear SKIL. Scale bar corresponds to 50 µm.
Figure 4.
Figure 4.. SGS mutations inhibit binding of SKI to SMAD2/3.
(A and B) HaCaT cells were treated or not with 2 ng/ml TGF-β. A peptide pulldown assay was performed on whole cells extracts and pulldowns were immunoblotted with the antibodies indicated. Inputs are shown on the right. (A) Wild-type (WT) SKI peptides corresponding to amino acids 11–45 or containing SGS point mutations as shown in red were used. (B) WT SKIL peptides corresponding amino acids 80–120 or containing mutations (in red) corresponding to SGS mutations in SKI were used. (C) WT SKI peptides or those containing SGS point mutations were used in pulldown assays with whole-cell extracts of SMAD2-null mouse embryonic fibroblasts that express just the MH2 domain of SMAD2 (MEF SMAD2Δex2) (Das et al., 2009), treated with 2 ng/ml TGF-β. The untreated sample is only shown for the WT SKI peptide. A PSMAD2 immunoblot is shown. (D) A recombinant trimer of phosphorylated SMAD2 MH2 domain was used in a peptide pulldown assay with WT and G34D SKI peptides. A PSMAD2 immunoblot is shown, with inputs on the right. (E) Mutational peptide array of SKI peptides (amino acids 11–45), mutated at all residues between amino acids 19 and 35, was probed with a recombinant PSMAD3–SMAD4 complex, which was visualized using a SMAD2/3 antibody conjugated to Alexa 488. On each row, the indicated amino acid is substituted for every other amino acid. A representative example is shown. See Figure 4—figure supplement 1C and Figure 4—source data 2 for quantification of the peptide arrays.
Figure 4—figure supplement 1.
Figure 4—figure supplement 1.. SGS mutations in SKI.
(A) Alignment of the first 317 amino acids of human SKI with the corresponding regions of mouse SKI and human SKIL is shown. Key domains are shown: pink corresponds to the R-SMAD-binding domain; blue, DHD domain; purple, SAND domain. SGS mutations are indicated by arrows. (B) SKI peptides corresponding to amino acids 11–51 and truncated versions as shown were analyzed in peptide pulldown assays with whole cell extracts from HaCaT cells treated with or without 2 ng/ml TGF-β. The pulldowns were immunoblotted using the antibodies shown. Inputs are shown on the right. (C) Quantification of the mutational peptide array of SKI peptides (amino acids 11–45), a representative of which is shown in Figure 4E. Each intensity measure is normalized to the average intensity of 60 positive controls of the WT peptide after subtracting the background, measured from the average intensity of 60 negative controls (truncated SKI peptide C as indicated in B). The values shown are the mean normalized intensities for each mutated peptide. See also Figure 4—source data 2.
Figure 5.
Figure 5.. Crystal structure of PSMAD2 MH2 domain and N-terminal SKI peptide.
(A) Crystal structure of the phosphorylated SMAD2 MH2 domain trimer (the three monomers are shown in bright green, cyan, and olive) with the N-terminal SKI peptide amino acids 11–45 (magenta). A ribbon representation is shown. The C-terminal phosphates are indicated with a ball and stick representation (red and magenta). (B–F) Close ups on key residues for SKI binding. SKI residues are shown in magenta, and SMAD2 residues are in green. In (B–D), a ribbon representation is shown. In (E and F), SMAD2 is shown as a surface representation and SKI as a ribbon. (G) A detail from the structure of monomeric SMAD2 MH2 domain with a peptide from ZFYVE9 (formerly called SARA) (Wu et al., 2000). Note that the β1’ strand that contains Tyr268 is locked in a hydrophobic pocket, forcing Trp448 into flattened orientation, incompatible with SKI binding. (H) A detail from the structure in (A) indicating how SMAD2 complex formation shifts the position of the β1’ strand and more particularly, Tyr268, allowing Trp448 to flip 90°, enabling it to stack with SKI residues Phe24 and Pro35.
Figure 5—figure supplement 1.
Figure 5—figure supplement 1.. Analysis of the phosphorylated SMAD2 MH2 domain complex used for structural studies.
(A) The trimeric arrangement of the phosphorylated SMAD2 MH2 domain was confirmed by SEC-MALLS. The SEC-MALLS chromatogram is shown. The calculated molecular weight was 81 kDa, which was very close to the expected molecular weight of 78.5 kDa. (B) The interaction between the phosphorylated SMAD2 MH2 domain and the SKI peptide (amino acids 11–45) was measured by biolayer interferometry. The biosensors were loaded with biotinylated SKI peptide and incubated with different concentrations of phosphorylated SMAD2 MH2 domain as shown. The calculated Kd was 1.33 × 10⁻⁹ ± 2.12 x10⁻¹¹ M. (C) Data collection and refinement statistics for the crystal structure of the phosphorylated SMAD2 MH2 domain complex with the N-terminal region of SKI shown in Figure 5A.
Figure 6.
Figure 6.. Knockin of an SGS mutation into SKI in HEK293T cells inhibits SKI degradation and inhibits Activin-induced transcription.
(A) Parental HEK293T and three independent P35S SKI knockin clones were incubated overnight with 10 μM SB-431542, washed out, and treated for 3 hr with 25 μM MG-132 and then with either SB-431542 or 20 ng/ml Activin A for an additional 1 hr. Whole-cell lysates were immunoprecipitated (IP) with SKI antibody or beads alone (Be). The IPs were immunoblotted using the antibodies shown. Inputs are shown below. (B) Parental HEK293T and four independent P35S SKI knockin clones were incubated with 10 μM SB-431542 overnight, washed out, and incubated with either SB-431542 or 20 ng/ml Activin for the times indicated. Whole-cell lysates were immunoblotted using the antibodies indicated. (C) Cells were treated as in (B), and nuclear lysates were prepared and analyzed by DNA pulldown assay using the wild-type c-Jun SBE oligonucleotide or a version mutated at the SMAD3–SMAD4 binding sites (top panel). Inputs are shown in the bottom panel. HEK293T parental and two independent P35S SKI knockin clones were stably transfected with the CAGA12-Luciferase reporters (D) or the BRE-Luciferase reporter (E) with TK-Renilla as an internal control. Cells were serum starved with media containing 0.5% fetal bovine serum and 10 μM SB-431542 overnight. Subsequently, cells were washed and treated with Activin A (D) or BMP4 (E) at the concentrations indicated for 8 hr. Cell lysates were prepared and assayed for Luciferase and Renilla activity. Plotted are the means and SEM of seven (D) or four (E) independent experiments, with the ratio of Luciferase:Renilla shown. *p<0.05; **p<0.01; ***p<0.001; ****p<0.0001. The p-values are from two-way ANOVA with Tukey’s post hoc test. A, Activin; SB, SB-431542; Par, parental.
Figure 6—figure supplement 1.
Figure 6—figure supplement 1.. Mutation of the R-SMAD binding domain or SAND domain in SKI/SKIL prevents ligand-induced SKI/SKIL degradation.
(A) Characterization of P35S SKI mutation in HEK293T cells compared to parental cells by PCR followed by Sanger sequencing analysis. The black box indicates the change in nucleotides that give rise to the desired mutation. The details of the knocked in changes are given below. (B) HEK293T parental and SMAD4 knockout (S4 KO) cells were transiently transfected with FLAG-SKIL WT or FLAG-SKIL G103V (ΔS2/3) or FLAG-SKIL R314A, T315A, H317A, and W318E (ΔS4) as indicated, or left untransfected (U). Cells were incubated overnight with 10 μM SB-431542, then washed out, and pre-treated with 25 μM MG-132 for 3 hr, followed by incubation with SB-431542 or with 20 ng/ml Activin A for 1 hr. Whole cell extracts were immunoprecipitated (IP) with FLAG beads. The IPs were immunoblotted using the antibodies shown. Inputs are shown below. (C) HEK293T cells were untransfected (U) or transfected with the plasmids indicated as in (B). Cells were incubated overnight with 10 μM SB-431542, then washed out, and subsequently treated with SB-431542 or with 20 ng/ml Activin A for the times shown. Whole-cell extracts were immunoblotted using the antibodies shown. SB, SB-431542; A, Activin A.
Figure 7.
Figure 7.. SGS mutations in SKI inhibit TGF-β-induced transcriptional responses in fibroblasts derived from SGS patients.
(A) Fibroblasts derived from a healthy subject carrying WT SKI and from two SGS patients carrying the L32V or the ΔS94-97 heterozygous mutations in SKI were incubated overnight with 10 μM SB-431542, washed out, and either re-incubated with SB-431542 or 2 ng/ml TGF-β for the times indicated. Whole-cell lysates were immunoblotted using the antibodies indicated. (B) Hierarchically clustered heatmaps of log2FC values (relative to the SB-431542-treated samples) showing the expression of TGF-β-responsive genes in the healthy fibroblasts and the L32V SKI fibroblasts after 1 hr and 8 hr of TGF-β treatment, analyzed by RNA-seq. Four biological replicates per condition were analyzed. The genes shown are those for which the TGF-β inductions were statistically significant in the healthy fibroblasts, but non-significant in the L32V fibroblasts. (C) The same data as in (B) are presented as box plots. (D) Model for the mechanism of action of WT SKI and mutated SKI. The left panel shows the unstimulated condition. In the nuclei, SKI (blue) is complexed with RNF111 (pink) and is also bound to DNA at SBEs with SMAD4 (green) forming a transcriptionally repressive complex with other transcriptional repressors (maroon). In the middle panel, TGF-β/Activin stimulation induces the formation of phosphorylated R-SMAD–SMAD4 complexes (yellow and green), which induce WT SKI degradation by RNF111. This allows an active PSMAD3–SMAD4 complex to bind SBEs and activate transcription. In the right panel, SGS-mutated SKI (light blue) is not degraded upon TGF-β/Activin stimulation, due to its inability to interact with PSMAD2 or PSMAD3. It therefore remains bound to SMAD4 on DNA, leading to attenuated transcriptional responses.
Figure 7—figure supplement 1.
Figure 7—figure supplement 1.. Dermal fibroblasts from SGS patients exhibit an attenuated TGF-β transcriptional response.
(A) Principal component analysis (PCA) plot is shown for RNA-seq on normal fibroblasts containing WT SKI, and fibroblasts from SGS patients containing either the L32V SKI mutation or the ΔS94-97 SKI mutation, treated as indicated. PCA measures sample to sample variation using rlog transformed read count of all genes expressed above one read in at least one sample. Four replicates are shown for each condition. (B) Enriched Reactome pathways common between the pairwise comparisons of time points (SB-431542-treated versus 1 hr TGF-β or 8 hr TGF-β) of fibroblasts derived from a healthy subject containing WT SKI. (C) Hierarchically clustered heatmaps of log2FC values (relative to SB-431542 condition) showing the expression of TGF-β-responsive genes in the healthy (WT SKI) and the ΔS94-97 SKI-containing fibroblasts after 1 hr and 8 hr treatment with TGF-β, analyzed by RNA-seq. Four biological replicates per condition were analyzed. The genes shown are those for which the TGF-β inductions were statistically significant in the healthy fibroblasts, but non-significant in the ΔS94-97 fibroblasts. (D) The same data as in (C) are presented as box plots.
Figure 7—figure supplement 2.
Figure 7—figure supplement 2.. Validation of RNA-seq data by qPCR.
(A–L) Healthy dermal fibroblasts (WT SKI) and dermal fibroblasts from SGS patients containing either the L32V SKI mutation or the ΔS94-97 SKI mutation were treated overnight with 10 µM SB-431542, washed out, and incubated with either SB-431542 or 2 ng/ml TGF-β for 1 hr and 8 hr. Total RNA was extracted, and either RNA-seq or qPCR analysis was performed. Transcript levels for a subset of target genes are displayed as plots of the mean transcripts per million (TPM) from the RNA-seq data (A, C, E, G, I, K) or were measured by qPCR and plotted normalized to SB-431542-treated healthy fibroblasts (B, D, F, H, J, L). Plotted are the means and SEM of at least of four independent experiments. The p-values are from two-way ANOVA with Tukey’s post hoc test. *p<0.05; **p<0.01; ***p<0.001; ****p<0.0001.

Similar articles

Cited by

References

    1. Afonine PV, Grosse-Kunstleve RW, Echols N, Headd JJ, Moriarty NW, Mustyakimov M, Terwilliger TC, Urzhumtsev A, Zwart PH, Adams PD. Towards automated crystallographic structure refinement with phenix.refine. Acta Crystallographica Section D Biological Crystallography. 2012;68:352–367. doi: 10.1107/S0907444912001308. - DOI - PMC - PubMed
    1. Anderton MJ, Mellor HR, Bell A, Sadler C, Pass M, Powell S, Steele SJ, Roberts RR, Heier A. Induction of heart valve lesions by small-molecule ALK5 inhibitors. Toxicologic Pathology. 2011;39:916–924. doi: 10.1177/0192623311416259. - DOI - PubMed
    1. Angelov SN, Hu JH, Wei H, Airhart N, Shi M, Dichek DA. TGF-β (Transforming growth Factor-β) Signaling protects the thoracic and abdominal aorta from angiotensin II-Induced pathology by distinct mechanisms. Arteriosclerosis, Thrombosis, and Vascular Biology. 2017;37:2102–2113. doi: 10.1161/ATVBAHA.117.309401. - DOI - PMC - PubMed
    1. Bonnon C, Atanasoski S. c-Ski in health and disease. Cell and Tissue Research. 2012;347:51–64. doi: 10.1007/s00441-011-1180-z. - DOI - PubMed
    1. Briones-Orta MA, Levy L, Madsen CD, Das D, Erker Y, Sahai E, Hill CS. Arkadia regulates tumor metastasis by modulation of the TGF-β pathway. Cancer Research. 2013;73:1800–1810. doi: 10.1158/0008-5472.CAN-12-1916. - DOI - PMC - PubMed

Publication types

Supplementary concepts