. 2021 Jan 8:10:e61722.
doi: 10.7554/eLife.61722.

A Bayesian analysis of the association between Leukotriene A4 Hydrolase genotype and survival in tuberculous meningitis

Affiliations

A Bayesian analysis of the association between Leukotriene A4 Hydrolase genotype and survival in tuberculous meningitis

Laura Whitworth et al. Elife. .

Abstract

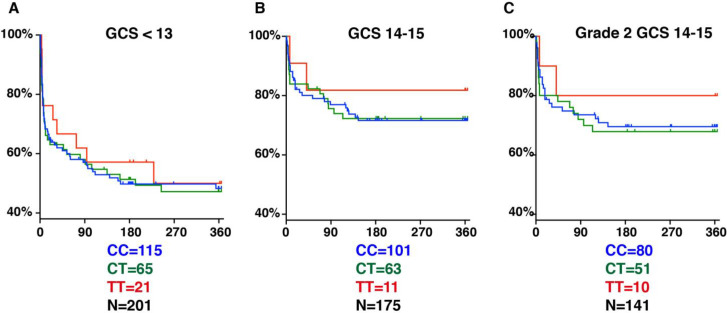
Tuberculous meningitis has high mortality, linked to excessive inflammation. However, adjunctive anti-inflammatory corticosteroids reduce mortality by only 30%, suggesting that inflammatory pathophysiology causes only a subset of deaths. In Vietnam, the survival benefit of anti-inflammatory corticosteroids was most pronounced in patients with a C/T promoter variant in the leukotriene A4 hydrolase (LTA4H) gene encoding an enzyme that regulates inflammatory eicosanoids. LTA4H TT patients with increased expression had increased survival, consistent with corticosteroids benefiting individuals with hyper-inflammatory responses. However, an Indonesia study did not find an LTA4H TT genotype survival benefit. Here using Bayesian methods to analyse both studies, we find that LTA4H TT genotype confers survival benefit that begins early and continues long-term in both populations. This benefit is nullified in the most severe cases with high early mortality. LTA4H genotyping together with disease severity assessment may target glucocorticoid therapy to patients most likely to benefit from it.

Keywords: Bayesian inference; TB meningitis; dexamethasone; genetics; genomics; human; infectious disease; leukotriene A4 hydrolase; microbiology; pharmacogenomics.

Plain language summary

Tuberculous meningitis is a serious infection of the lining of the brain, which affects over 100,000 people a year. Without treatment, it is always fatal: even with proper antibiotics, about a quarter of patients do not survive and many will have permanent brain damage. Overactive inflammation is thought to contribute to this process. Corticosteroid drugs, which dampen the inflammatory process, are therefore often used during treatment. However, they merely reduce mortality by 30%, suggesting that only some people benefit from them. Two recent studies have linked the genetic makeup of individuals who have tuberculous meningitis to how they respond to corticosteroids. There were, in particular, differences in the LTA4H gene that codes for an inflammation-causing protein. According to these results, only individuals carrying high-inflammation versions of the LTA4H gene would benefit from the treatment. Yet a third study did not find any effect of the genetic background of patients. All three papers used frequentist statistics to draw their conclusions, only examining the percentage of people who survived in each group. Yet, this type of analysis can miss important details. It also does not work well when the number of patients is small, or when the effectiveness of a drug varies during the course of an illness. Another method, called Bayesian statistics, can perform better under these limitations. In particular, it takes into account the probability of an event based on prior knowledge – for instance, that the risk of dying varies smoothly with time. Here, Whitworth et al. used Bayesian statistics to reanalyse the data from these studies, demonstrating that death rates were correlated with the type of LTA4H gene carried by patients. In particular, corticosteroid treatment worked best for people with the high inflammation versions of the gene. However, regardless of genetic background, corticosteroids were not effective if patients were extremely sick before being treated. The work by Whitworth et al. demonstrates the importance of using Bayesian statistics to examine the effectiveness of medical treatments. It could help to design better protocols for tuberculous meningitis treatment, tailored to the genetic makeup of patients.


Conflict of interest statement

LW, JC, Av, NT, SD, BA, AG, Rv, GT, MT, PE, RS, LR No competing interests declared

Figures

Figure 1.
Figure 1.. Glasgow Coma Scores (GCS) for Vietnam and Indonesia patients.
Frequency of GCS values indicated on the Y-axis as a percentage of the total cohort (n = 376 Indonesia, n = 439 Vietnam). Bayesian posterior probabilities of significant differences between Vietnam (VN) and Indonesia (IN) for mean GCS comprising Grade 2, VN > IN P 0.99996 (15 VN > IN p=0.99999; 11–14 VN < IN P ranging from 0.99985 (13) to 0.98 (14); rest of the values non-significant); for GCS comprising Grade 3, VN > IN, P 0.01 (GCS4, 0.98; GCS9, 0.04; all others not significant).
Figure 2.
Figure 2.. Effect of LTA4H rs17525495 genotype on patient survival.
Survival probability over all grades in Vietnam (A) and Indonesia (E), and stratified by grade (B–D, F–H). Coloured lines represent mean posterior survival probability curves for the nine-month observation period. Shaded areas represent 95% Bayesian confidence limits for posterior probability. Comparisons where TT (purple) to non-TT (green) differences were significant have boxed insets showing hazard rates for the first 30 days; all other comparisons, not significant. The number of patients at the starting time point are indicated in parentheses. In Vietnam, overall (A), TT survival was significantly higher than non-TT from day 39 onwards with maximum probability 0.98, survival gap 11%; non-TT hazard rate was significantly higher than TT from day 4 to day 120, with their ratio peaking at 3 on day six and remaining >1 until day 223. (D) Grade 3 TT survival was significantly higher from day 3 onwards with maximum probability 0.97, survival gap 30%. The TT hazard rate dropped from the start, while the non-TT hazard peaked at 16 times higher than TT on day 3; non-TT over TT hazard rate ratio remained >1 throughout. In Indonesia, overall (E), TT survival was non-significantly higher than non-TT (maximum probability 0.92); the non-TT hazard rate was greater than the TT hazard rate from day 1 to day 13, significantly so (and by 2-fold) on days 2 and 3 (maximum probability 0.97). (F) Grade 1 comparisons were uninformative due to TT sample size (n = 1). (G) Grade 2 TT survival was significantly higher on days 4–32 with maximum probability 0.99, survival gap 9%. The TT hazard rate dropped from the start, while the non-TT hazard peaked at five times higher than TT on day 3. The non-TT over TT hazard rate ratio remained >1 until day 15.
Figure 3.
Figure 3.. Patient survival, stratified by grade.
Mean posterior survival probability curves (coloured lines) overlaid by Kaplan-Meier survival plots (black lines) for Vietnam (A) and Indonesia (B), and mean posterior hazard rate curves for the first 30 days for Vietnam (C) and Indonesia (D). Shaded areas represent the 95% Bayesian confidence limits for posterior probability. The number of patients in each group at the starting time point are indicated in parentheses. (A) Vietnam Grade 1 over Grade 2 survival was significantly greater from day 7 onwards with maximum probability 0.999, survival gap 14%; Grade 2 over Grade 3 survival was significantly greater from day 1 onwards with maximum probability 0.999, survival gap 16%. (B) Indonesia Grade 1 over Grade 2 survival was significantly greater from day 2 onwards with maximum probability 0.999, survival gap 21%; Grade 2 over Grade 3 survival was significantly greater from day 2 onwards with maximum probability 0.999, survival gap 25%. (C) Vietnam hazard rate ratio was >1 for both grade comparisons (inset magnifies Grade 1 and Grade 2 differences) with Grade 2 over 1 ratio peaking at 5.5 on day 7 and Grade 3 over 2 ratio peaking at 13.9 on day 1. (D) Indonesia Grade 2 over 1 hazard rate ratio was >1 up to day 215 and Grade 3 over 2 ratio was >1 throughout, peaking at 11.2 on day 1 for Grade 2 over 1, and at 2.3 on day 5 for Grades 3 over 2.
Figure 4.
Figure 4.. Direct comparison of grade-stratified survival of Vietnam and Indonesia patients.
Comparison of survival curves (A, C, E) and hazard rate curves for the first 30 days (B, D, F) in Vietnam (orange lines) and Indonesia (green lines). The number of patients at the starting time point are indicated in parentheses. (A) Grade 1 survival did not differ significantly between Vietnam and Indonesia. (B) Indonesia hazard rate was ~2 fold higher than Vietnam in Grade 1 from day 0 to day 150, but the difference did not reach significance. (C) Grade 2 survival was significantly lower in Indonesia than Vietnam from day 1 onwards with maximum probability 0.999, survival gap 18%. (D) The hazard rate ratio in Grade 2 for Indonesia over Vietnam peaked at 8.4 on day 1 and remained >1 until day 180. (E) Grade 3 survival was significantly lower in Indonesia than Vietnam from day 2 onwards with maximum probability 0.999, survival gap 24%. (F) Grade 3 hazard rate ratio for Indonesia over Vietnam peaked at 3.6 on day 3 and remained >1 until day 165.
Figure 5.
Figure 5.. LTA4H rs17525495 genotype as predictor for 365 day mortality in HIV-negative TBM patients in Indonesia.
Panels A and B are comparable to Figure S2B of van Laarhoven et al., 2017. (A) All patients with GCS < 13. (B) Patients with GCS = 14 or 15 (note that one patient with TT genotype, GCS = 15 was censored on day 30 in the original data set but later found to have died on day 41). (C) The subset of patients from (B) with GCS 14 or 15 excluding those in BMRC Grade 1 (GCS 15 without neurological signs).
Appendix 2—figure 1.
Appendix 2—figure 1.. Output of test run using synthetic data for which the right answer is known.
The true survival probability curve is shown in green, with the Kaplan-Meier plot for the generated data in black. In blue are shown many samples from the posterior distribution on the survival probability curve, calculated from P(θ|𝐱^), which indicate the uncertainty in the inferred distribution. The synthetic dataset comprised 300 hypothetical patients of whom the time of death of 153 was censored.
Appendix 2—figure 2.
Appendix 2—figure 2.. Output of test run using synthetic data for which the right answer is known.
The true hazard rate curve is shown in green. In blue are shown many samples from the posterior distribution on the hazard rate curve, calculated from P(θ|𝐱^), which indicate the uncertainty in the inferred distribution. The synthetic dataset comprised 300 hypothetical patients of whom the time of death of 153 was censored.
Appendix 2—figure 3.
Appendix 2—figure 3.. Output of test run using synthetic data for which the right answer is known.
The true survival probability curve is shown in green, with the Kaplan-Meier plot corresponding to the generated data in black. In blue is the posterior mean survival probability against time, calculated from P(θ|𝐱^), and in dotted lines the 2.5% and 97.5% centiles, which indicate the uncertainty in the inferred distribution. The synthetic dataset comprised 300 hypothetical patients of whom the time of death of 153 was censored.
Appendix 2—figure 4.
Appendix 2—figure 4.. Comparison of two runs generated independently from two subsets of patients, subset 1 (red) consisting of 20 patients and subset 2 (green) consisting of 182 patients.
The Kaplan-Meier plot for subset 1 is in solid black and that for subset 2 in dot-dashed black. Since there were many more patients in subset 2 than in subset 1, we expect greater variance in the inferred survival probabilities for subset 1 than for subset 2.
Appendix 2—figure 5.
Appendix 2—figure 5.. As for Appendix 2—figure 4 but zoomed in to the top left hand corner, showing greater separation and less overlap of the red and green curves at 10 days than at 1 day or 100 days.
Appendix 2—figure 6.
Appendix 2—figure 6.. Corresponding to Appendix 2—figures 4 and 5 this shows the probability that survival for subset 1 is greater than that for subset 2 at each time point.
Appendix 2—figure 7.
Appendix 2—figure 7.. Prior on J, the number of different modes of death.
Appendix 2—figure 8.
Appendix 2—figure 8.. Prior on k.
Appendix 2—figure 9.
Appendix 2—figure 9.. Prior on m.
Appendix 2—figure 10.
Appendix 2—figure 10.. Prior on p.
Appendix 2—figure 11.
Appendix 2—figure 11.. Prior on r.
Appendix 2—figure 12.
Appendix 2—figure 12.. Samples from resulting prior on survival probability against time.
Appendix 2—figure 13.
Appendix 2—figure 13.. Samples from resulting prior on hazard rate against time.
Appendix 2—figure 14.
Appendix 2—figure 14.. Mean and 2.5% and 97.5% centiles of prior on survival probability against time.
Appendix 2—figure 15.
Appendix 2—figure 15.. Mean and 2.5% and 97.5% centiles of prior on hazard rate against time.
Appendix 2—figure 16.
Appendix 2—figure 16.. Samples captured from two runs on the same data started from different random values of the parameters, illustrating that the resulting distributions are essentially identical.
Appendix 2—figure 17.
Appendix 2—figure 17.. Comparison probabilities (analogous to Appendix 2—figure 6) for survival probability against time from two runs on the same data (and the same priors) started from different random values of the parameters.
If the two distributions are identical (as they should be up to uncertainty caused by the non-infinite number of samples drawn during the MCMC runs), then at each time the probability that the ‘red’ distribution is greater than the ‘green’ (see Appendix 2—figure 16) should be 0.5 . Thus this plot, together with Appendix 2—figure 16, shows that the two distributions are essentially identical, and that the runs have converged to a common distribution.
Appendix 2—figure 18.
Appendix 2—figure 18.. Example of inference whose interpretation is explained in detail in section 4 of this document.
See also Appendix 2—figure 19. Prior mean and 2.5% and 97.5% centiles in magenta; posterior TT mean and centiles in red; posterior non-TT mean and centiles in green; Kaplan-Meier plots for TT in solid black and for non-TT in dash-dot black. There are 1 TT patient and 33 non-TT patients. (The Kaplan-Meier plot for group 1 (TT) and the upper centile plots for both prior and group 1 posterior are approximately coincident along the top of the graph).
Appendix 2—figure 19.
Appendix 2—figure 19.. Example of comparison probabilities for inference whose interpretation is explained in detail in section 4 of this document.
See also Appendix 2—figure 18.
Appendix 2—figure 20.
Appendix 2—figure 20.. Samples of the survival probability against time for an alternative prior.
Appendix 2—figure 21.
Appendix 2—figure 21.. As for Appendix 2—figure 6, showing samples of the survival probability against time for an alternative prior.

References

    1. Bradburn MJ, Clark TG, Love SB, Altman DG. Survival analysis part II: multivariate data analysis--an introduction to concepts and methods. British Journal of Cancer. 2003;89:431–436. doi: 10.1038/sj.bjc.6601119. - DOI - PMC - PubMed
    1. Dagpunar J. Principles of Random Variate Generation. Oxford: Clarendon Press; 1988.
    1. Donald PR, Schoeman JF. Tuberculous meningitis. New England Journal of Medicine. 2004;351:1719–1720. doi: 10.1056/NEJMp048227. - DOI - PubMed
    1. Donovan J, Phu NH, Thao LTP, Lan NH, Mai NTH, Trang NTM, Hiep NTT, Nhu TB, Hanh BTB, Mai VTP, Bang ND, Giang DC, Ha DTM, Day J, Thuong NT, Vien NN, Geskus RB, Hien TT, Kestelyn E, Wolbers M, Chau NVV, Thwaites GE. Adjunctive dexamethasone for the treatment of HIV-uninfected adults with tuberculous meningitis stratified by leukotriene A4 hydrolase genotype (LAST ACT): Study protocol for a randomised double blind placebo controlled non-inferiority trial. Wellcome Open Research. 2018;3:32. doi: 10.12688/wellcomeopenres.14007.1. - DOI - PMC - PubMed
    1. Donovan J, Phu NH. Adjunctive dexamethasone for the treatment of HIV-infected adults (ACT HIV): Study protocol for a randomised controlled trial. [October 14, 2020];2020 https://wellcomeopenresearch.org/articles/3-31 - PMC - PubMed

Publication types

Substances