. 2021 Feb 1;218(2):e20180853.
doi: 10.1084/jem.20180853.

Heterogeneous disease-propagating stem cells in juvenile myelomonocytic leukemia

Affiliations

Heterogeneous disease-propagating stem cells in juvenile myelomonocytic leukemia

Eleni Louka et al. J Exp Med. .

Abstract

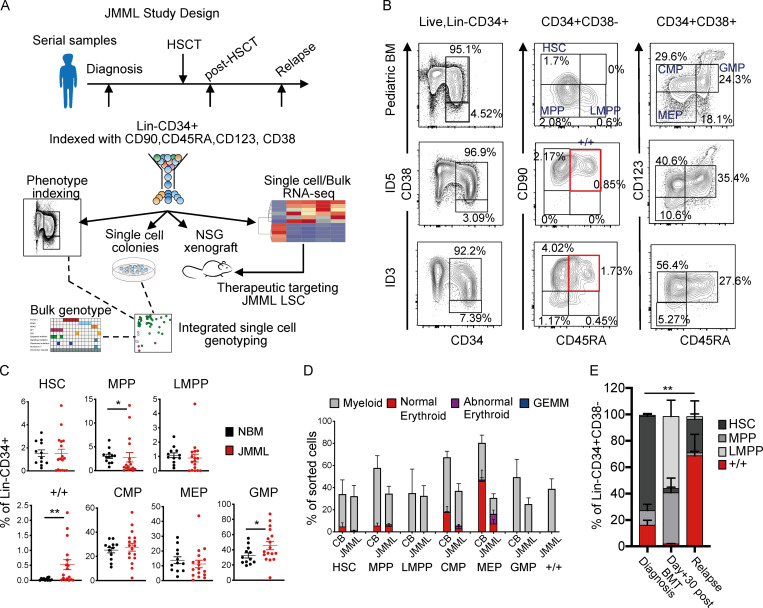
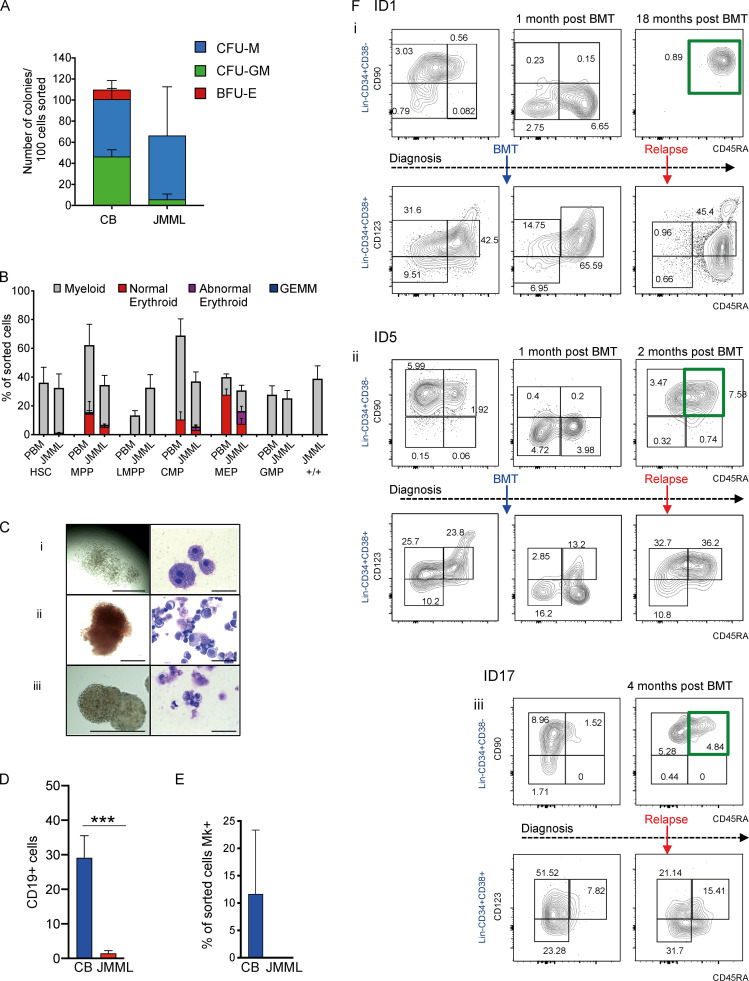
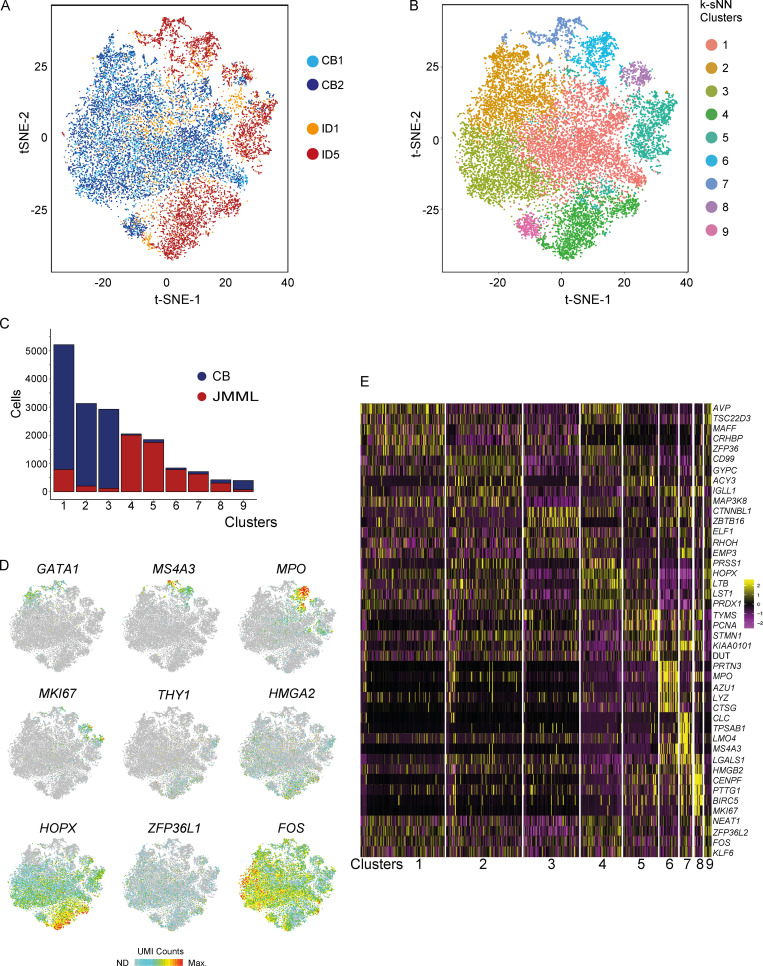
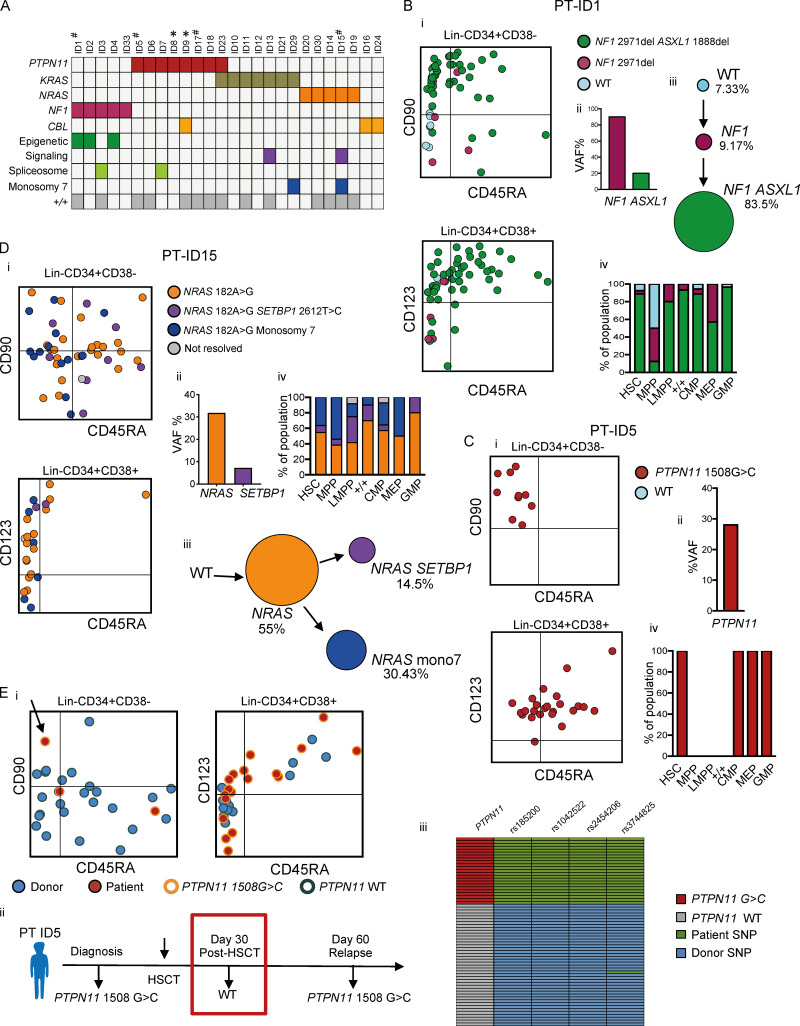
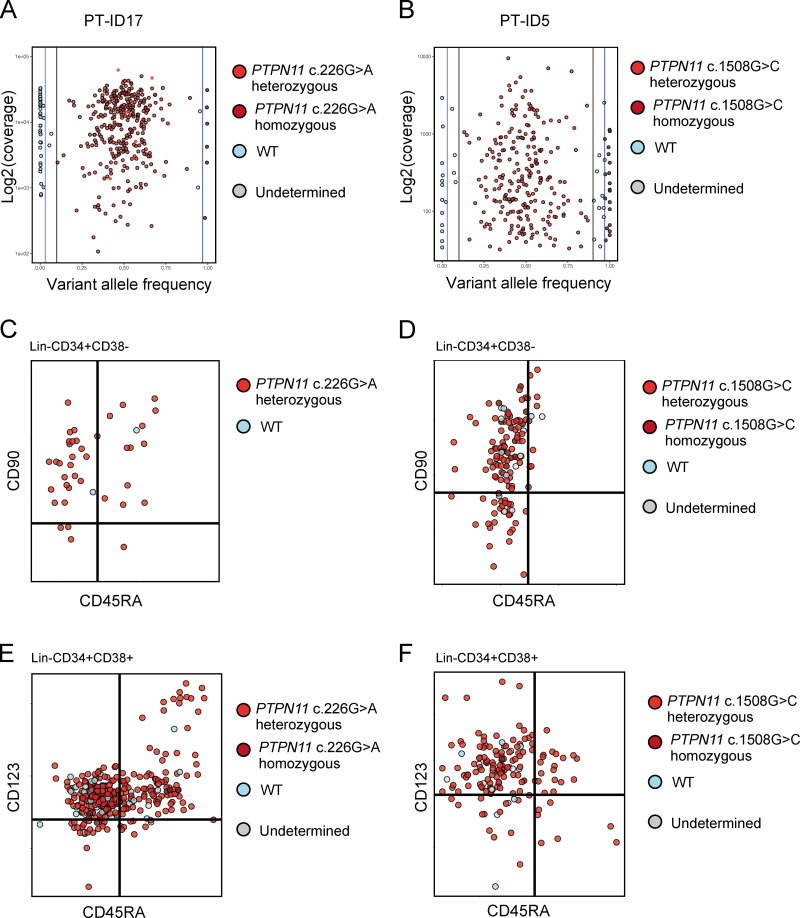
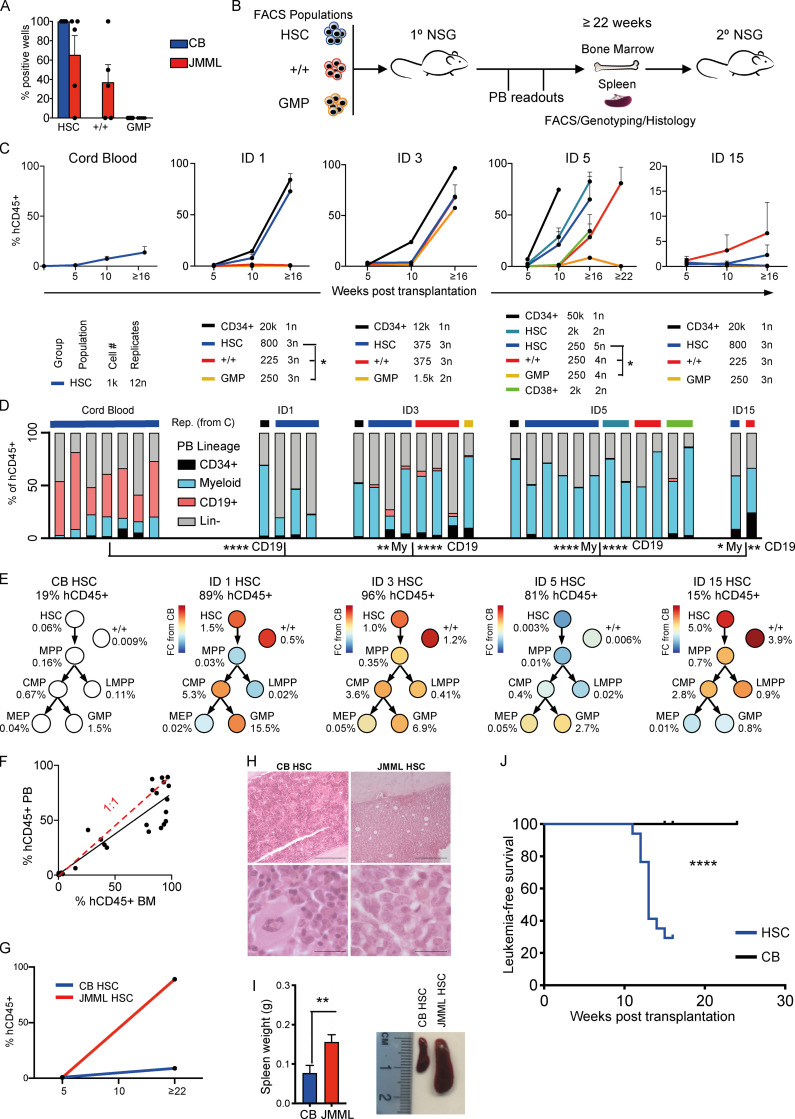
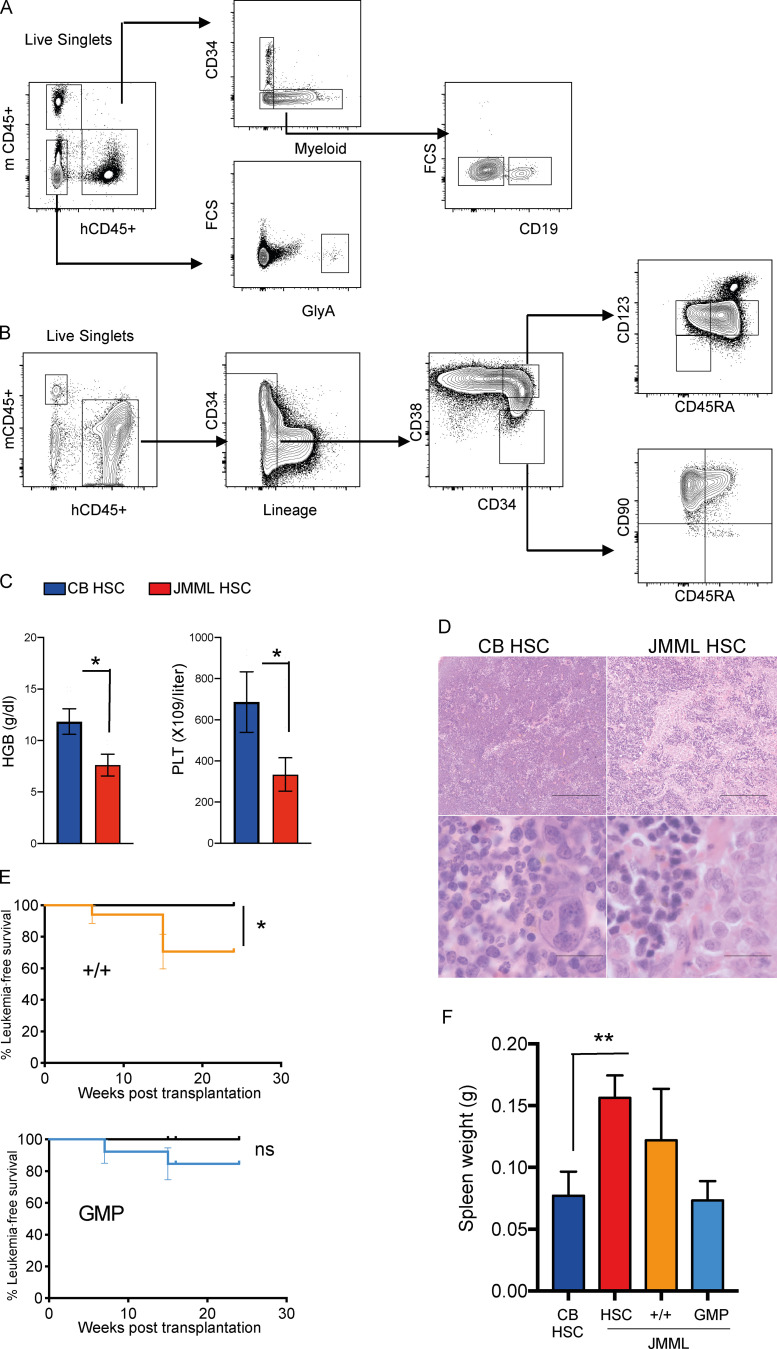
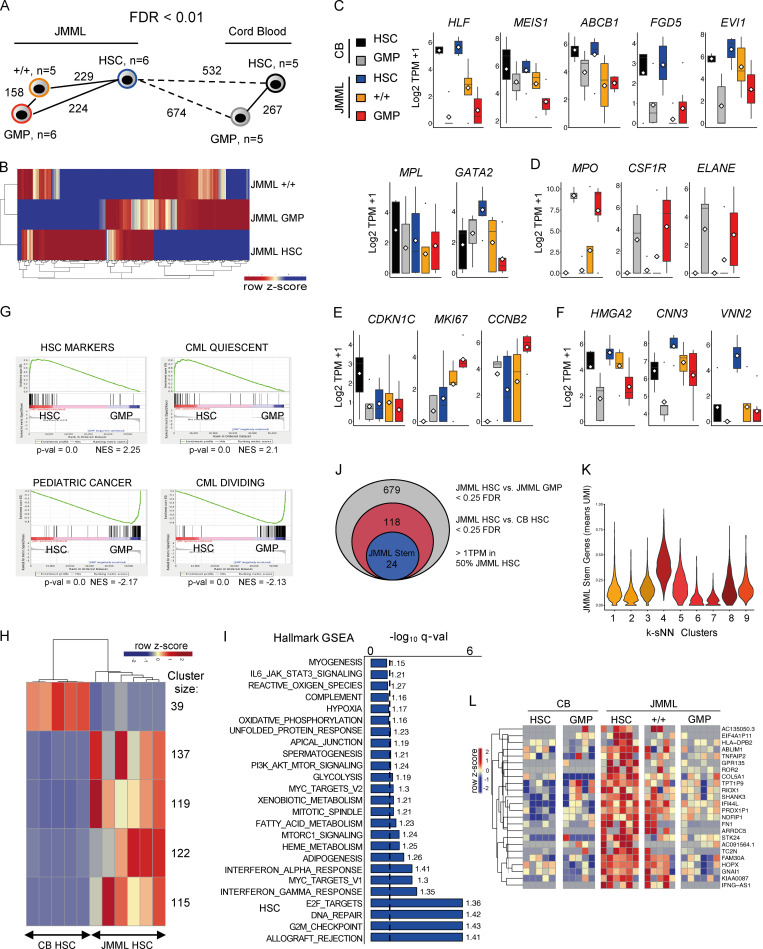
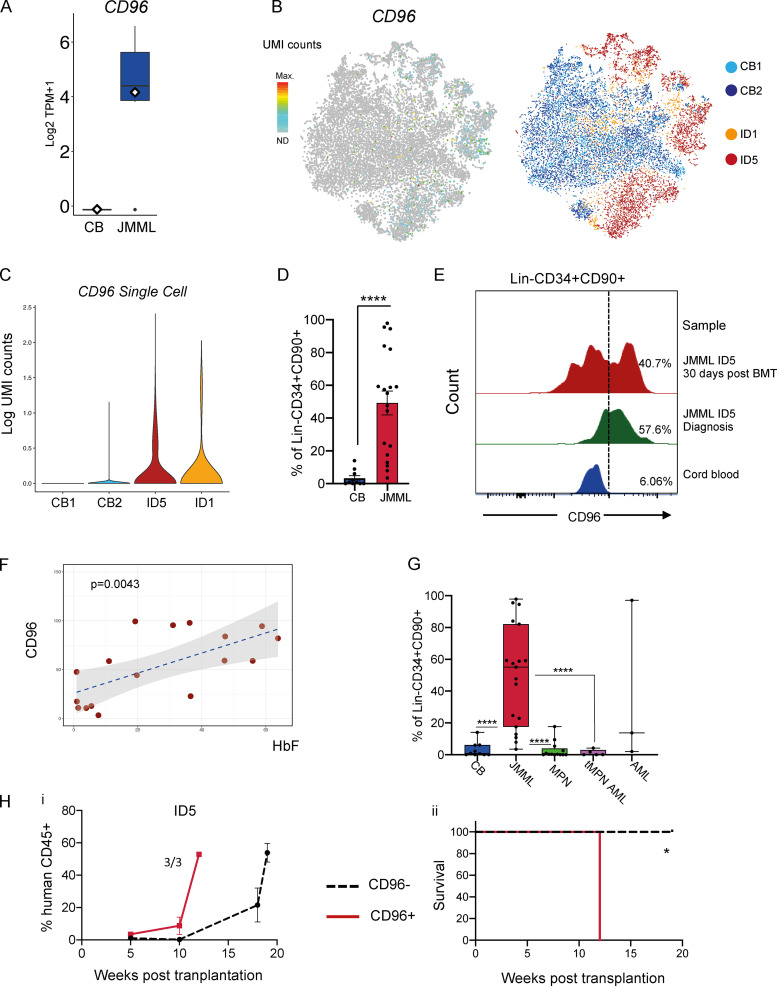
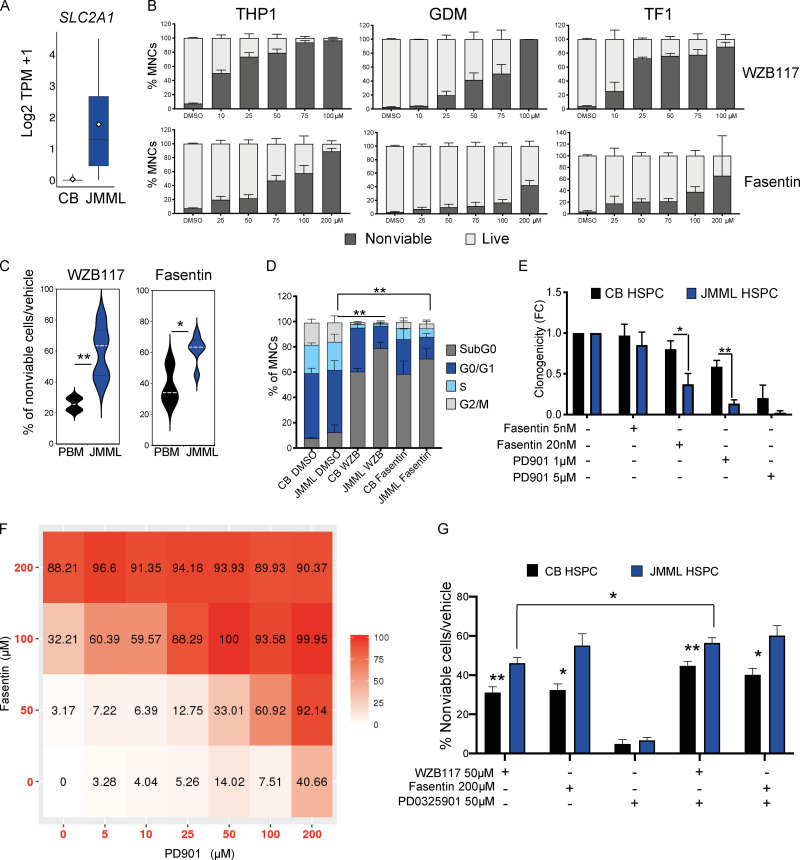
Juvenile myelomonocytic leukemia (JMML) is a poor-prognosis childhood leukemia usually caused by RAS-pathway mutations. The cellular hierarchy in JMML is poorly characterized, including the identity of leukemia stem cells (LSCs). FACS and single-cell RNA sequencing reveal marked heterogeneity of JMML hematopoietic stem/progenitor cells (HSPCs), including an aberrant Lin-CD34+CD38-CD90+CD45RA+ population. Single-cell HSPC index-sorting and clonogenic assays show that (1) all somatic mutations can be backtracked to the phenotypic HSC compartment, with RAS-pathway mutations as a "first hit," (2) mutations are acquired with both linear and branching patterns of clonal evolution, and (3) mutant HSPCs are present after allogeneic HSC transplant before molecular/clinical evidence of relapse. Stem cell assays reveal interpatient heterogeneity of JMML LSCs, which are present in, but not confined to, the phenotypic HSC compartment. RNA sequencing of JMML LSC reveals up-regulation of stem cell and fetal genes (HLF, MEIS1, CNN3, VNN2, and HMGA2) and candidate therapeutic targets/biomarkers (MTOR, SLC2A1, and CD96), paving the way for LSC-directed disease monitoring and therapy in this disease.


Conflict of interest statement

Disclosures: S. O’Byrne reports personal fees from Becton, Dickinson and Company (employee as of August 2020) outside the submitted work. M. Salio reports personal fees from Nucleome Therapeutics outside the submitted work. N. Sousos reports expenses reimbursement from Pfizer Limited for attending the Pfizer-organized meeting titled "Leaders in Leukaemia," July 12-13, 2019, in London, UK. N. Sousos reports expenses reimbursement from Constellation Pharmaceuticals for attending the Constellation 0610-02 MANIFEST Study EU Investigator Meeting, January 31-February 1, 2019, in Rome, Italy. N. Sousos reports an educational travel grant from AOP Orphan Pharmaceuticals AG for attending the European Hematology Association meeting "Diagnosis and Management of Myeloproliferative Neoplasms," October 12-14, 2017, in Budapest, Hungary. No other disclosures were reported.

Figures

Figure 1.
Figure 1.
Single-cell phenotypic and functional analysis reveals heterogeneity of HSPCs in JMML. (A) Outline of experimental design used in this study. (B) Top panels: Representative FACS profiles of samples of normal pediatric BM (age 14 yr); middle and bottom panels: BM samples from two JMML patients (ID5 and ID3) at diagnosis. Samples gated on singlets, live, and Lin cells (left column); CD34+CD38 cells (middle); CD34+CD38+ cells (right). Percentages on figure represent percentage of LinCD34+ cells. Red boxes indicate the aberrant Lin-CD34+CD38CD90+CD45RA+ population. (C) Frequency of immunophenotypically defined HSCs and progenitors in total LinCD34+ cells from normal pediatric BM (NBM; biological replicates, n = 12; black dots) and JMML BM (biological replicates, n = 17; red dots); HSC P = 0.52, MPP P = 0.0476 (*), LMPP P = 0.13, +/+ P = 0.0082 (**), CMP P = 0.57, MEP P = 0.45, and GMP P = 0.05 (*). Data acquired over four independent experiments. Error bars represent mean ± SEM. Statistical analysis performed by Mann-Whitney test and Welch t test for data that were normally distributed. (D) Clonogenic output of single HSC and progenitor cells sorted into methylcellulose; expressed as the percentage of sorted cells that generated a colony and the type of colony generated. Results for seven different biological replicates from JMML BM samples (ID1, ID2, ID5, ID6, ID7, ID15, and ID18) compared with five different biological replicate normal (CB) controls. Data acquired over 10 independent experiments. Error bars represent mean ± SEM. (E) Bar chart showing the percentage of HSPCs at different time points from diagnosis, day +30 after BMT, and at relapse (biological replicates, n = 3: ID1, ID5, and ID17). P value indicated on figure represents comparison of +/+ at diagnosis and relapse (P = 0.0047 [**]). HSC comparison at diagnosis versus relapse (P = 0.0175). Data acquired over six independent experiments. Statistical analysis performed by two-way ANOVA. Error bars represent mean ± SEM. GEMM, granulocyte/erythroid/megakaryocyte/monocyte; LMPP, lymphoid primed multipotent progenitor.
Figure S1.
Figure S1.
Single-cell phenotypic and functional analysis reveals heterogeneity of HSPCs in JMML (related to Fig. 1). (A) Bulk clonogenicity in methylcellulose, 100 cells sorted per assay (CB control, n = 2 different biological replicates; JMML, n = 2 different biological replicates); one experiment. CFU-M, CFU-macrophage; CFU-GM, CFU–granulocyte macrophage. (B) Clonogenic output of purified HSCs and progenitor populations from normal pediatric BM (PBM; n = 3 different biological replicates) and JMML (n = 7 different biological replicates) in single-cell methylcellulose assays. 11 independent experiments performed. (C) Representative examples of colonies (left column) and MGG-stained cells from individual plucked colonies (right column) from clonogenic assays in methylcellulose. (Ci) Macrophage colonies from the JMML LinCD34+CD38CD90+CD45RA+ population; scale bars, 1,000 µm (left), 50 µm (right). (Cii) “Normal-appearing” erythroid colonies; scale bar, 200 µm (left), 50 µm (right). (Ciii) Abnormal erythroid colonies derived from JMML MEP; scale bar, 400 µm (left), 50 µm (right). (D) Lymphoid output of sorted HSCs (100 cells) from four different biological replicates from JMML BM samples (red bar) compared with four different biological replicates from normal controls (CB; blue bars). Cells cultured on MS-5 stromal lines, and output measured as percent CD19+ cells on gated hCD45+ cells (mean ± SEM) after 4 wk. Mann Whitney test, *** P = 0.0006. Data acquired over two independent experiments. (E) Percentage of wells with CD42+CD41+ megakaryocytes (Mk) in single-cell liquid cultures of normal CB (n = 2) and JMML (n = 2). Two independent experiments performed. (F) Representative FACS plots of serial patient samples from diagnosis, after BMT, and at clinical relapse: ID1 (Fi); ID5 (Fii); and ID17 (Fiii). Top panels for each patient represent LinCD34+CD38 compartment and bottom panel LinCD34+CD38+ compartments. Percentage of each population shown in the figure represents the percentage of LinCD34+. Green boxes indicate the aberrant Lin-CD34+CD38-CD90+CD45RA+ population. Data acquired over six independent experiments. BFU-E, burst-forming unit–erythroid; GEMM, granulocyte/erythroid/megakaryocyte/monocyte; LMPP, lymphoid primed multipotent progenitor.
Figure 2.
Figure 2.
Single-cell RNA-seq of JMML HSPCs reveals distinct clustering. (A) tSNE analysis of LinCD34+ single-cell RNA-seq dataset based on 593 variable genes. 17,547 single cells that passed filtering from two CB controls (light and dark blue) and two JMML BM samples (orange and red) are shown. (B) Single-cell RNA-seq clusters identified by the k-SNN method and projected by tSNE plot. Colors correspond to computationally identified clusters of single cells. (C) Number of single cells within each cluster from CB (blue) and JMML (red). (D) Selected highly variable genes from top principal components plotted on tSNE analysis from A. Color scale represents normalized UMI counts (gray, not detected [ND]; red, maximum count [Max]). (E) Heatmap depicting the top five positively identifying genes that distinguish each cluster of single cells shown in B. Data acquired in one experiment.
Figure 3.
Figure 3.
Single-cell mutation tracing to phenotypic HSCs in JMML. (A) Mutations detected through a customized MDS/JMML targeted sequencing panel in whole JMML BM and/or PB samples (n = 26) at diagnosis except where indicated; each column represents an individual patient. All patients had RAS gene pathway mutations, in two cases involving two different RAS-pathway genes (ID9 and ID23). Secondary mutations were detected in 7/26 in epigenetic regulators (ASXL1, TET2), signaling (SETBP1), and spliceosome (SRSF2) genes; also two patients with monosomy 7 (see Table S1). Patients where the aberrant +/+ population was detected by FACS are shown in the bottom row; #, samples for single-cell genotyping; *, relapse or early posttreatment samples. (B–D) Single-cell mutational profiling for three JMML BM samples (ID1 [B], ID5 [C], and ID15 [D]). For each panel: (i) FACS indexing of CD34+ single cells with points colored by mutational status; top CD38; bottom CD38+; (ii) variant allele frequency (VAF) at diagnosis for each mutation detected in bulk BM; (iii) inferred mutation hierarchy and proportion of each subclone (for ID1 and ID15 only); and (iv) proportion of each subclone in the indicated HSPC subpopulation. (Ei) FACS indexing of posttransplant (day +30) BM CD34+ cells from patient ID5 with single cells colored by donor/patient and mutational status; left: LinCD34+CD38; right: LinCD34+CD38+. Arrow indicates a mutant HSC detected in the posttransplant sample. (Eii) Timeline of pre- and posttransplant PTPN11 mutation detection by targeted sequencing of bulk BM cells showing that the mutation was not detected by NGS at day +30. Marked day 30 sample used for single-cell genotyping. (Eiii) Heatmap of the 65 single cell–derived colonies analyzed showing PTPN11 mutational status and patient- and donor-derived SNPs. Details for number of cells sorted, processed, and analyzed are outlined in the relevant Materials and methods section.
Figure S2.
Figure S2.
Colony genotyping mutation tracing to phenotypic HSCs in JMML–QC (related to Fig. 3). (A) Diagram of the workflow for single-cell genotyping. (B) Pathway for samples analysis. (C–E) Variant allele frequency (VAF) and coverage of amplicons sequenced and that passed QC from patient-derived colonies and CB controls. (ID1, n = 129 cells used for analysis; ID15, n = 71 cells used for analysis; and ID5, n = 34 cells used for analysis). (F) VAF and coverage of amplicons sequenced from patient-derived colonies (ID5) after BMT and CB controls (ID5 after BMT, n = 65 cells used for analysis). (G) Examples of coverage of amplicons from heterozygous SNPs used to calculate the allelic dropout of the method. (H) Summary of amplicons from heterozygous SNPs for each sequencing run; coverage applied and allelic dropout for each amplicon. Six independent experiments; details for number of colonies are outlined in the Materials and methods section.
Figure S3.
Figure S3.
Single-cell genotyping using TARGET-seq (related to Fig. 3). (A) Variant allele frequency (VAF) and coverage of PTPN11 c.226G>A amplicon sequenced from patient ID17 (total of 384 single cells sorted, 365 cells passed QC, coverage cutoff 100). (B) VAF and coverage of PTPN11 c.1508G>C amplicon sequenced from patient ID5 (total of 384 cells single sorted, 280 cells passed QC, coverage cutoff 30). (C) Single-cell mutation profiling: cells plotted as per FACS index data and colored according to their mutational status. Plots showing LinCD34+CD38 cells from patient ID17. (D) Single-cell mutation profiling: cells plotted as per FACS index data and colored according to their mutational status. Plots showing LinCD34+CD38 cells from patient ID5. (E) Single-cell mutation profiling: cells plotted as per FACS index data and colored according to their mutational status. Plots showing LinCD34+CD38+ cells from patient ID17. (F) Single-cell mutation profiling: cells plotted as per FACS index data and colored according to their mutational status. Plots showing LinCD34+CD38+ cells from patient ID5. Data acquired with two independent experiments (one per biological replicate).
Figure 4.
Figure 4.
Heterogeneity of LSCs in JMML. (A) LTC-IC assay. 100 cells from each population from JMML BM samples (five different biological replicates) and CB controls (five different biological replicates) sorted and cultured for 8 wk. Results shown as the percentage of cells from each sample with clonogenic activity. Data acquired over three independent LTC-IC experiments. Error bars represent mean ± SEM. (B) Schematic of in vivo transplantation experiments with purified HSPC populations into NSG mice. (C) Percentage of human (h)CD45+ cells in PB from xenograft CB and JMML HSPCs. Below: Key for each patient for population, number of cells transplanted, and number of replicates. Student's t test, * P < 0.05. ID1 HSC versus ID1 +/+, * P = 0.041; ID1 HSC versus ID1 GMP, * P = 0.040. ID5 HSC (n = 250) versus ID5 +/+ (n = 250), * P = 0.044; ID5 HSC (n = 250) versus ID5 GMP (n = 250), * P = 0.02. Four different JMML BM samples were used (ID1, ID3, ID5, and ID15) and four different CB controls. Number of animals per group is shown in Fig. 4 C. (D) Lineage of PB reconstitution of mice with >1% human engraftment at terminal time point. Color bars (top) correspond to population and cell number groups as in C. Two-way ANOVA, compared with CB controls. CB lymphoid versus ID1 lymphoid, **** P < 0.0001; CB lymphoid versus ID3 lymphoid, **** P < 0.0001; CB lymphoid versus ID5 lymphoid, **** P < 0.0001; CB lymphoid versus ID15 lymphoid, ** P < 0.0024; CB myeloid (My) versus ID3 myeloid, ** P = 0.0038; CB myeloid versus ID5 myeloid **** P < 0.0001, and CB myeloid versus ID15 myeloid, * P = 0.016. Rep., representative. (E) BM analysis of mice transplanted with HSCs from CB (n = 12) or JMML BM (n = 4 samples; 16 mice). Mean percent human engraftment at terminal time point (top); percent engraftment (of total hCD45+ cells) for each HSPC population shown below each population; and log fold-change (FC) for JMML compared with CB controls indicated by the color chart. (F) Comparison of percent hCD45+ cells in PB versus BM at terminal time point with best fit (black) and a 1:1 ratio (red). (G) PB hCD45+ cell percentage in secondary transplantation of CB and JMML HSCs. (H) Photomicrograph of Giemsa-stained BM sections from mice transplanted with purified CB (left) or JMML (right) HSCs. Scale bars, 100 µm. (I) Left panel: Terminal spleen weight from mice transplanted with CB versus JMML HSCs, ** P = 0.0087, Mann-Whitney test. Right panel: Representative images of increased spleen size in JMML versus CB HSC-transplanted mice. (J) Kaplan-Meier leukemia-free survival curve of mice transplanted with purified JMML HSCs or CB HSCs. Significance by log-rank test, **** P < 0.0001. LMPP, lymphoid primed multipotent progenitor.
Figure S4.
Figure S4.
Functional characterization of JMML HSPCs (related to Fig. 4). Number of animals per group as outlined in index of Fig. 1 C. (A) Representative FACS analysis of PB from JMML xenograft showing gating strategy. FSC, forward scatter. (B) Representative FACS analysis of BM from JMML xenograft overall showing gating strategy. (C) Terminal PB analysis from mice transplanted with CB or JMML HSCs; * P < 0.05, Student’s t test. t test hemoglobin CB versus JMML, P = 0.018; platelets CB versus JMML, P = 0.0311. Error bars represent mean ± SEM. HGB, hemoglobin; PLT, platelets. (D) Representative histology photographs of spleen CB HSC control (left) and JMML HSC (right). Scale bars, 100 µm. (E) Kaplan-Meier survival curves for JMML +/+ and JMML GMP compared with CB control; log-rank test, * P = 0.024. (F) Spleen size of NSG mice at termination from CB HSC controls; JMML HSC, JMML +/+, and JMML GMP; ** P = 0.0087; Student’s t test. Error bars represent mean ± SEM. ns, not significant.
Figure 5.
Figure 5.
Conservation of molecular hierarchy of JMML HSPCs and novel therapeutic targets for JMML HSCs. (A) Nearest neighbor analysis of purified HSPC populations from CB and JMML. Numbers represent significant differentially expressed genes <0.1 false discovery rate (FDR). JMML BM, n = 6 different biological replicates, and normal CB control, n = 5 different biological replicates. (B) Heatmap of top differentially expressed genes between JMML HSC, JMML +/+, and JMML GMP. (C–F) Gene expression for CB HSC (black), CB GMP (gray), JMML HSC (blue), JMML CD90+/CD45RA+ (+/+; orange), and JMML GMP (red) for known stem cell genes (C); myeloid genes up-regulated in JMML and CB GMP (D); cell cycle–related genes (E); and expression in JMML HSPCs of known fetal HSC genes (F). (G) GSEA of JMML HSCs versus JMML GMPs with up-regulation of gene sets for HSC markers and CML quiescence in HSCs (top) and up-regulation of gene sets for pediatric cancer and CML proliferation gene sets in GMPs (bottom). NES, normalized enrichment score. (H) Heatmap depicting k-means clustering of top differentially expressed genes between JMML HSCs and CB HSCs with an FDR cutoff <0.1. Cluster size corresponds to the number of genes within each significant cluster. (I) Hallmark GSEA between JMML HSCs and CB HSCs depicting up-regulated gene sets in JMML. Dashed line represents an FDR cutoff of <0.1; numbers next to the bars represent NES. (J) Identification of a JMML LSC–specific gene signature from bulk RNA-seq. (K) Single-cell gene expression of the JMML stem cell genes identified in Fig. 5 J. Clusters are as identified in Fig. 2 B. Expression plotted as mean UMI. (L) Heatmap of top differentially expressed genes between JMML HSC, JMML +/+, and JMML GMP. Data acquired over two independent experiments. TPM, transcripts per million.
Figure 6.
Figure 6.
CD96 expression in JMML HSPCs. (A) CD96 expression by bulk RNA-seq in JMML and CB HSCs, P < 0.05 Benjamini-Hochberg–corrected false discovery rate. Data acquired through bulk RNA-seq. (B) CD96 expression by single-cell RNA-seq (left) on tSNE analysis from CB and JMML (right). (C) Violin plots of single-cell CD96 expression in JMML and CB CD34+ HSPCs. (D) CD96 expression by FACS in CB and JMML LinCD34+CD90+ cells showing percentage of LinCD34+90+ cells expressing surface CD96 (JMML, n = 19 different biological replicates; CB controls, n = 11 different biological replicates). Data acquired over five independent experiments. Statistical analysis performed by Mann-Whitney test, **** P < 0.0001. Error bars represent mean ± SEM. (E) Presence of LinCD34+CD90+CD96+ cells in paired diagnostic and posttransplant samples in patient ID5 detected by flow cytometry. Data acquired over two independent experiments; representative plots from one experiment shown. Dashed line represents the CD96 gate. (F) Dot plot showing correlation between CD96 expression on LinCD34+CD90+ cells from JMML patients (age > 6 mo) at diagnosis and fetal hemoglobin (HbF) percentage at the same time point. Pearson's correlation and P value generated by ggplot2 and ggExtra R package (P = 0.0043). JMML, n = 17 different biological replicates. Data acquired over five independent experiments. (G) CD96 expression by FACS in LinCD34+CD90+ cells in JMML patient samples (n = 19 different biological replicates), CB controls (n = 11 different biological replicates), and different pediatric and adult myeloid malignancies (MPN: essential thrombocytopenia, n = 3 different biological replicates; myelofibrosis, n = 3 different biological replicates; CML, n = 3 different biological replicates; polycythemia vera, n = 3 different biological replicates; MPN transformed to AML (tMPN AML), n = 5 different biological replicates; and pediatric AML cases, n = 3 different biological replicates. **** P < 0.0001. Error bars represent mean ± SEM. Data acquired over six independent experiments. (Hi) Percent human CD45+ cells in PB from mice transplanted with CD96+ (red line) or CD96 (black dashed line) LinCD34+CD38 cells. Data acquired from one independent experiment. Error bars represent mean ± SEM. (Hii) Kaplan-Meier leukemia-free survival curve of mice transplanted with purified JMML LinCD34+CD38 CD96+ (n = 1,802 cells per recipient) or JMML LinCD34+CD38 CD96 cells (n = 382 cells per recipient). Three animals transplanted per group. Significance by log-rank test, * P = 0.025. TPM, transcripts per million.
Figure S5.
Figure S5.
Aberrant CD96 expression in JMML (related to Fig. 6). (Ai) Histograms of CD96 expression on the aberrant LinCD34+CD38CD90+CD45RA+ cells from patient samples (ID1, ID3, ID5, ID6, ID14, and ID15) and LinCD34+CD38CD90+ cells from a normal CB sample. Dashed line represents the CD96 gate. Six biological replicates; representative data shown from one experiment. (Aii) CD96 expression by FACS in CB LinCD34+CD38CD90+ and JMML LinCD34+CD38CD90+CD45RA+ samples showing percentage of cells expressing CD96 (JMML, n = 12; CB, n = 4). Mann-Whitney test; ** P = 0.0049. Error bars represent mean ± SEM. Data shown from two independent experiments. (Aiii) Representative FACS plots of CD96 expression on the aberrant LinCD34+CD38CD90+CD45RA+ cells from patient samples (ID3 and ID5) and CD96 expression of LinCD34+CD90+ cells from a normal CB sample. Representative data shown from one experiment. (B) Histogram showing CD96 expression on LinCD34+CD90+ cells of a JMML sample (ID19) compared with pediatric BM at diagnosis and 1 mo after transplantation. Dashed line represents the CD96 gate. Patient subsequently relapsed, requiring a second BMT 6 mo after the first BMT. Representative data from one experiment. (C) Representative FACS profile of CD96 expression on mature hematopoietic populations in three JMML patients (ID2, ID5, and ID6). Dashed line represents the CD96 gate. Representative data from one experiment. (D) Representative FACS plots of CD96 expression on LinCD34+CD90+ cells in JMML (ID13), chronic phase MPN (CML), and transformed MPN (tMPN AML). Representative data from one experiment. FSCA, forward scatter area.
Figure 7.
Figure 7.
GLUT1: A novel therapeutic target for JMML HSCs. (A) Gene expression of SLC2A1 by bulk RNA-seq in JMML HSCs and CB HSCs. (B) Percentage of nonviable cells (Annexin-V+ and propidium iodide–positive) from THP1 cell line (left panels), GDM-1 cell line (middle panels), and TF1 cell line (right panels) treated with GLUT1 inhibitors (WZB117: top three panels; fasentin: bottom three panels) and analyzed 24 h after treatment. THP1, four independent experiments with at least two replicates per dose; GMD1, three independent experiments with at least two replicates per dose; TF1, four independent experiments with at least two replicates per dose. Error bars represent mean ± SEM. (C) Percent Annexin-V+ CD34+ cells in vehicle control–treated normal pediatric BM (PBM) controls (n = 4) and JMML CD34+ cells (n = 4) 24 h after treatment with WZB117 50 μM, ** P = 0.0028 (top panel), or fasentin 200 μM, * P = 0.047 (bottom panel). Two independent experiments. Error bars represent mean ± SEM. Statistical analysis performed by Mann-Whitney test. (D) Cell cycle analysis of JMML CD34+ (n = 3) and CB CD34+ controls (n = 4) 7 d after treatment with GLUT1 inhibitors. Two independent experiments. Error bars represent mean ± SEM. Two-way ANOVA: JMML DMSO versus JMML WZB117 (G0-G1), ** P = 0.0083; JMML DMSO versus JMML fasentin (G0-G1), ** P = 0.0041; and JMML DMSO versus JMML WZB117 (S/G2/M), ** P = 0.0021. (E) In vitro single-cell clonogenicity of CB (n = 3) and JMML CD34+CD38 HSPCs (n = 5) with selected targeted inhibitors. Error bars represent mean ± SEM. Three independent experiments, 30 cells from each biological replicate plated per condition. Mann-Whitney test, * P = 0.0411; ** P = 0.0079. FC indicates fold change. (F) Matrix illustrating drug synergy between GLUT1 inhibitor (fasentin) and MEK-inhibitor (PD901), representative result of two independent experiments on THP1 cell lines measuring percentage of nonviable cells after 24 h after treatment, synergy z-score 27.488. (G) Percent Annexin-V+ over vehicle control–treated CB CD34+ (n = 4) and JMML CD34+ (n = 4) 24 h after treatment with WZB117 50 μM, fasentin 200 μM, PD901 50 μM, and combinations of WZB117 with PD901 and fasentin with PD901 at the same doses. Three independent experiments; error bars represent mean ± SEM. CB WZB117 versus JMML WZB117, ** P = 0.002; CB WZB117 + PD901 versus JMML WZB117 + PD901, ** P = 0.0019; CB fasentin versus JMML fasentin, * P = 0.029; CB fasentin + PD901 versus JMML fasentin + PD901, * P = 0.028; and JMML WZB117 versus JMML WZB117 + PD901, * P = 0.013; Mann-Whitney test. TPM, transcripts per million.

Comment in

  • Stem cell origins of JMML.
    Sundaravel S, Steidl U. Sundaravel S, et al. J Exp Med. 2021 Feb 1;218(2):e20202152. doi: 10.1084/jem.20202152. J Exp Med. 2021. PMID: 33427877 Free PMC article.

References

    1. Caye, A., Strullu M., Guidez F., Cassinat B., Gazal S., Fenneteau O., Lainey E., Nouri K., Nakhaei-Rad S., Dvorsky R., et al. . 2015. Juvenile myelomonocytic leukemia displays mutations in components of the RAS pathway and the PRC2 network. Nat. Genet. 47:1334–1340. 10.1038/ng.3420 - DOI - PubMed
    1. Caye, A., Rouault-Pierre K., Strullu M., Lainey E., Abarrategi A., Fenneteau O., Arfeuille C., Osman J., Cassinat B., Pereira S., et al. . 2020. Despite mutation acquisition in hematopoietic stem cells, JMML-propagating cells are not always restricted to this compartment. Leukemia. 34:1658–1668. 10.1038/s41375-019-0662-y - DOI - PMC - PubMed
    1. Chávez-González, A., Dorantes-Acosta E., Moreno-Lorenzana D., Alvarado-Moreno A., Arriaga-Pizano L., and Mayani H.. 2014. Expression of CD90, CD96, CD117, and CD123 on different hematopoietic cell populations from pediatric patients with acute myeloid leukemia. Arch. Med. Res. 45:343–350. 10.1016/j.arcmed.2014.04.001 - DOI - PubMed
    1. Dimitriou, M., Woll P.S., Mortera-Blanco T., Karimi M., Wedge D.C., Doolittle H., Douagi I., Papaemmanuil E., Jacobsen S.E.W., and Hellström-Lindberg E.. 2016. Perturbed hematopoietic stem and progenitor cell hierarchy in myelodysplastic syndromes patients with monosomy 7 as the sole cytogenetic abnormality. Oncotarget. 7:72685–72698. 10.18632/oncotarget.12234 - DOI - PMC - PubMed
    1. Gallipoli, P., Abraham S.A., and Holyoake T.L.. 2011. Hurdles toward a cure for CML: the CML stem cell. Hematol. Oncol. Clin. North Am. 25:951–966: v. 10.1016/j.hoc.2011.09.001 - DOI - PubMed

Publication types

Substances