. 2021 Mar 8;39(3):361-379.e16.
doi: 10.1016/j.ccell.2020.12.007. Epub 2021 Jan 7.

Proteogenomic insights into the biology and treatment of HPV-negative head and neck squamous cell carcinoma

Chen Huang  1 Lijun Chen  2 Sara R Savage  1 Rodrigo Vargas Eguez  2 Yongchao Dou  1 Yize Li  3 Felipe da Veiga Leprevost  4 Eric J Jaehnig  1 Jonathan T Lei  1 Bo Wen  1 Michael Schnaubelt  2 Karsten Krug  5 Xiaoyu Song  6 Marcin Cieślik  7 Hui-Yin Chang  4 Matthew A Wyczalkowski  3 Kai Li  1 Antonio Colaprico  8 Qing Kay Li  2 David J Clark  2 Yingwei Hu  2 Liwei Cao  2 Jianbo Pan  9 Yuefan Wang  2 Kyung-Cho Cho  2 Zhiao Shi  1 Yuxing Liao  1 Wen Jiang  1 Meenakshi Anurag  10 Jiayi Ji  6 Seungyeul Yoo  11 Daniel Cui Zhou  3 Wen-Wei Liang  3 Michael Wendl  3 Pankaj Vats  12 Steven A Carr  5 D R Mani  5 Zhen Zhang  2 Jiang Qian  13 Xi S Chen  8 Alexander R Pico  14 Pei Wang  11 Arul M Chinnaiyan  7 Karen A Ketchum  15 Christopher R Kinsinger  16 Ana I Robles  16 Eunkyung An  16 Tara Hiltke  16 Mehdi Mesri  16 Mathangi Thiagarajan  17 Alissa M Weaver  18 Andrew G Sikora  19 Jan Lubiński  20 Małgorzata Wierzbicka  21 Maciej Wiznerowicz  22 Shankha Satpathy  5 Michael A Gillette  23 George Miles  1 Matthew J Ellis  10 Gilbert S Omenn  24 Henry Rodriguez  16 Emily S Boja  16 Saravana M Dhanasekaran  25 Li Ding  3 Alexey I Nesvizhskii  7 Adel K El-Naggar  26 Daniel W Chan  27 Hui Zhang  28 Bing Zhang  29 Clinical Proteomic Tumor Analysis Consortium
Collaborators, Affiliations

Proteogenomic insights into the biology and treatment of HPV-negative head and neck squamous cell carcinoma

Chen Huang et al. Cancer Cell. .

Abstract

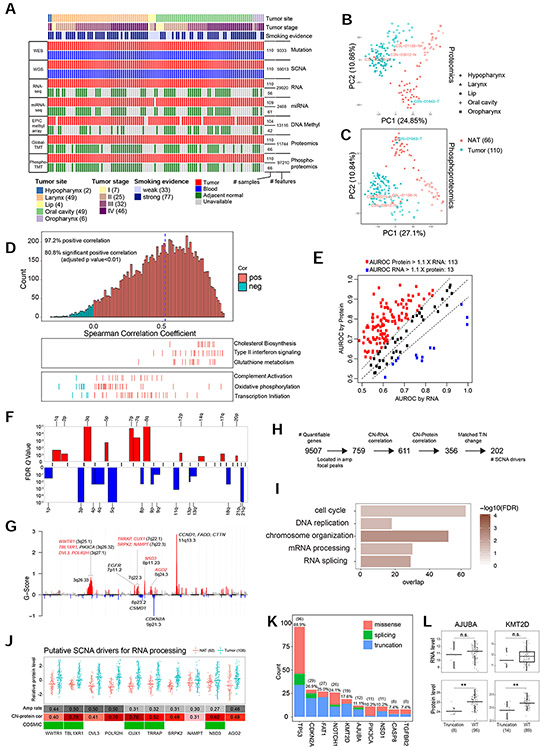
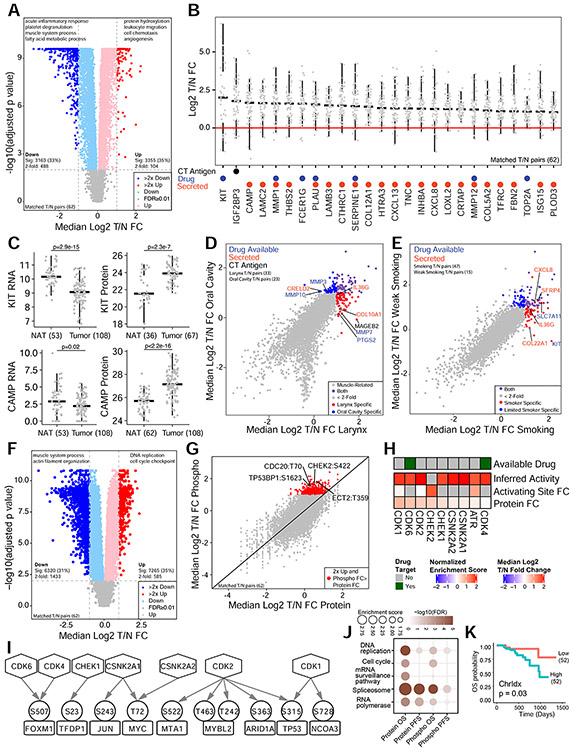
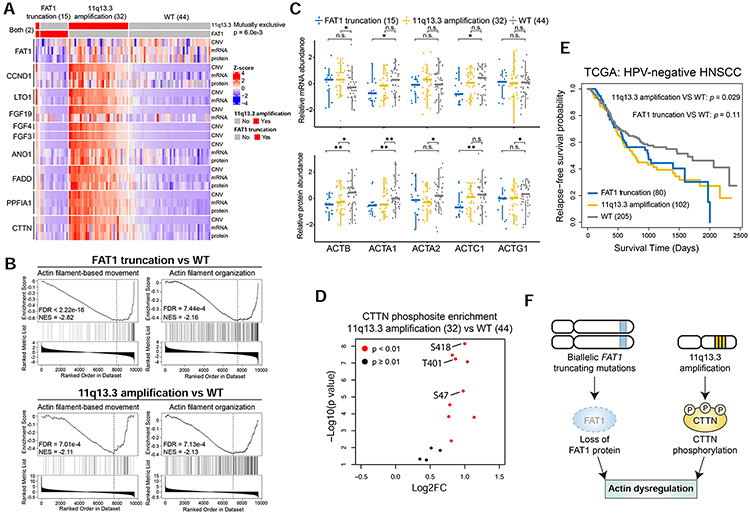
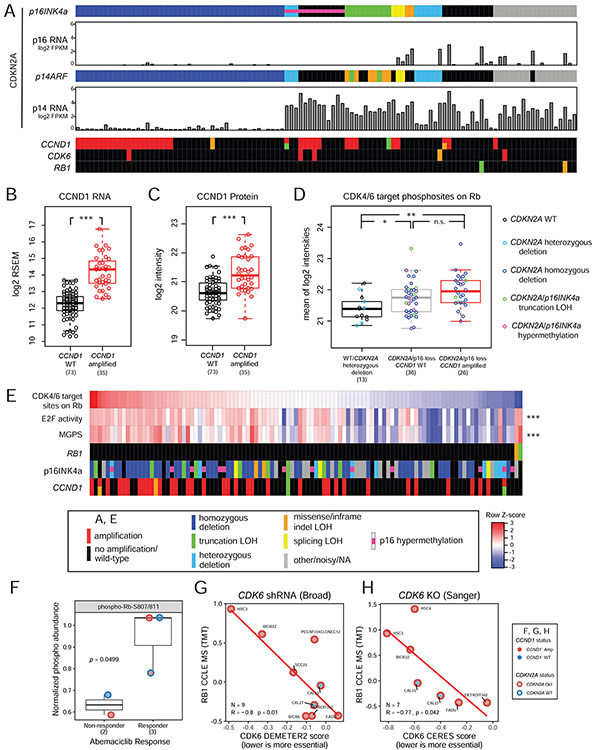
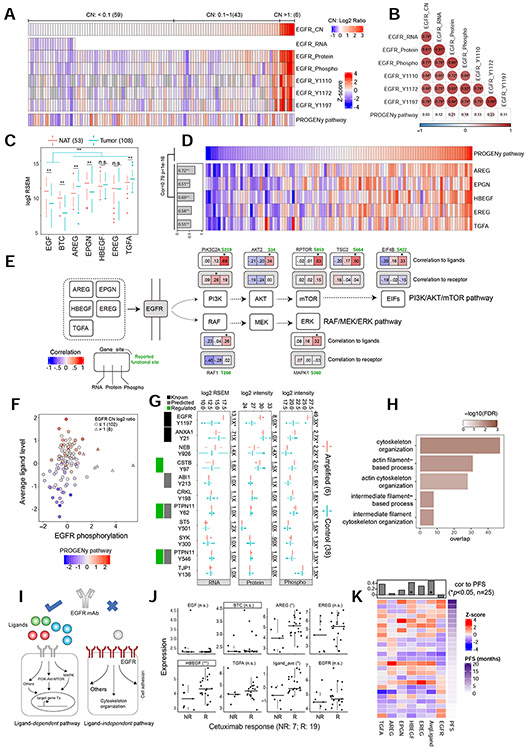
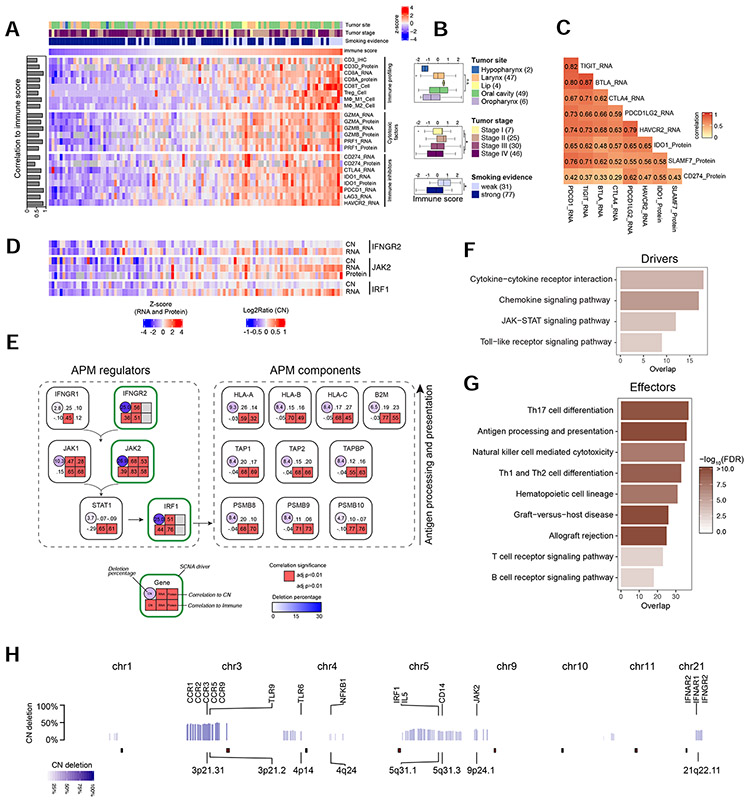
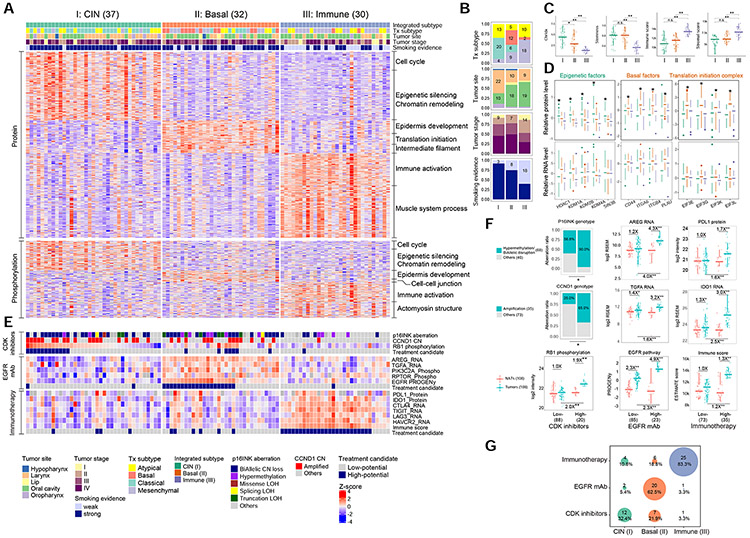
We present a proteogenomic study of 108 human papilloma virus (HPV)-negative head and neck squamous cell carcinomas (HNSCCs). Proteomic analysis systematically catalogs HNSCC-associated proteins and phosphosites, prioritizes copy number drivers, and highlights an oncogenic role for RNA processing genes. Proteomic investigation of mutual exclusivity between FAT1 truncating mutations and 11q13.3 amplifications reveals dysregulated actin dynamics as a common functional consequence. Phosphoproteomics characterizes two modes of EGFR activation, suggesting a new strategy to stratify HNSCCs based on EGFR ligand abundance for effective treatment with inhibitory EGFR monoclonal antibodies. Widespread deletion of immune modulatory genes accounts for low immune infiltration in immune-cold tumors, whereas concordant upregulation of multiple immune checkpoint proteins may underlie resistance to anti-programmed cell death protein 1 monotherapy in immune-hot tumors. Multi-omic analysis identifies three molecular subtypes with high potential for treatment with CDK inhibitors, anti-EGFR antibody therapy, and immunotherapy, respectively. Altogether, proteogenomics provides a systematic framework to inform HNSCC biology and treatment.

Keywords: CDK inhibitor; CPTAC; EGFR mAb; HNSCC; combination immune checkpoint blockade; immune evasion; immunotherapy; predictive biomarker; proteogenomics; proteomics.


Conflict of interest statement

Declaration of interests S.A.C. is a member of the scientific advisory boards of Kymera, PTM BioLabs, and Seer and a scientific advisor to Pfizer and Biogen. The other authors have no conflicts of interest to declare. M.J.E. reports ownership and royalties associated with Bioclassifier LLC through sales by Nanostring LLC and Veracyte for the "Prosigna" breast cancer prognostic test. M.J.E. also reports ad hoc consulting for AstraZeneca, Foundation Medicine, G1 Therapeutics, Novartis, Sermonix, Abbvie, Lilly and Pfizer.

Figures

Figure 1.
Figure 1.. Proteogenomic profiling and impact of genetic aberrations on proteins.
(A) Cohort clinical features and omic data generation. (B) Global proteomics and (C) peptide-level phosphoproteomics PCA plots. (D) Gene-wise mRNA-protein correlation and pathway enrichment. (E) Area under the receiver operating characteristic curve (AUROC) for KEGG pathway membership prediction using RNA and protein data. Red and blue indicate pathways with >10% difference between the two. (F) Arm-level SCNAs. (G) Focal-level SCNAs with known drivers and RNA processing genes (red) annotated. (H) Prioritization of genes in focal amplification peaks. (I) GO terms enriched for prioritized SCNA drivers (Fisher’s exact test). (J) Protein abundance of RNA processing genes in tumors and NATs, annotated with amplification rate, copy number-protein correlation (Pearson’s correlation), and presence (green) in the COSMIC Cancer Gene Census. (K) Mutation frequency and type for the most frequently mutated genes. (L) Comparisons of RNA and protein levels for AJUBA and KMT2D between samples with truncating mutations and wild-type (WT) samples. **p<0.01, Student’s t-test. n.s., not significant. Numbers in parentheses represent the sample sizes for the involved groups. See also Figure S1 and Table S1-2.
Figure 2.
Figure 2.. Proteomic alterations associated with tumorigenesis and prognosis.
(A) Protein abundance differences between tumors and NATs (Wilcoxon signed-rank test). Representative GO terms for 2-fold increased and decreased proteins are listed. (B) Abundance fold changes (FC) for selected highly elevated proteins annotated with potential clinical utilities. (C) Comparisons of RNA and protein levels for KIT and CAMP between tumors and NATs, Student’s t-test. (D) Comparison of protein changes in two anatomic sites. Dot colors indicate shared or site-specific elevations, and font colors indicate different types of clinical utilities. (E) Comparison of protein changes in tumors with strong and weak smoking evidence, colored as panel D. (F) Phosphosite abundance differences between tumors and NATs (Wilcoxon signed-rank test). Representative GO terms for proteins with 2-fold increased or decreased phosphosites are listed. (G) Comparison of abundance changes between phosphosites and their corresponding proteins. (H) Kinases with increased activity inferred from phosphorylation of its substrates (normalized enrichment score) or increased phosphorylation of its activating site. (I) Increased phosphorylation (circle) on transcription factor substrates (rectangle) of kinases (hexagon) with increased activity. All transcription factors had increased inferred activity from the RNA targets. (J) The common pathways enriched with proteins or phosphoproteins associated with OS or PFS (Fisher’s exact test). (K) Kaplan-Meier plot comparing OS for patients stratified by the median Chrldx score, logrank test. Numbers in parentheses represent the sample sizes for the involved groups. See also Figure S2 and Table S3.
Figure 3.
Figure 3.. Mutually exclusive FAT1 truncating mutations and 11q13.3 amplification converge to protein-level actin dysregulation.
(A) Heatmap visualizing multi-omic profiles of FAT1 and the nine coding genes in 11q13.3. (B) GSEA plots for actin-related pathways in FAT1 truncation or 11q13.3 amplification vs WT comparisons. (C) Relative mRNA and protein abundance in the FAT1 truncation, 11q13.3 amplification, and WT groups for five actin isoforms. *p<0.05, **p<0.01, Student’s t-test. n.s., not significant. (D) CTTN phosphosite abundance differences between the 11q13.3 amplification and WT groups (Student’s t-test). (E) Relapse-free survival in HPVneg HNSCC TCGA patients with FAT1 truncation or 11q13.3 amplification compared to WT (logrank test). (F) Proposed model explaining the mutual exclusivity between FAT1 truncating mutations and 11q13.3 amplification. Numbers in parentheses represent the sample sizes for the involved groups. See also Figure S3 and Table S4.
Figure 4.
Figure 4.. Proteogenomic delineation of the cyclin D-CDK4/6-Rb pathway.
(A) Genetic and epigenetic aberrations in pathway genes. Impact of CDKN2A aberrations for two major isoforms, p16INK4a (p16) and p14ARF (p14), on respective transcript mRNA levels are shown separately. LOH: loss of heterozygosity. (B-C) Cis-effects of CCND1 amplification on RNA (B) and protein abundance (C). ***p<1e-4, Wilcoxon rank sum test, n=108. (D) Comparison of Rb phosphorylation levels (average of all CDK4/6 target sites) among three tumor groups. *p<0.05. **p<0.001, Wilcoxon rank sum test. (E) Heatmap comparing Rb phosphorylation, E2F activity, and the mean of cell cycle regulated genes (MGPS), with genomic aberrations annotated. ***p<1e-4, Pearson’s correlation with Rb phosphorylation. (F) Comparison of phospho-Rb-S807/811 in non-responsive and responsive HPVneg HNSCC PDX models to abemaciclib, Student’s t-test. (G-H) Associations between mass spectrometry (MS)-based Rb abundance and CDK6 essentiality scores derived from shRNA (DEMETER2, G) or CRISPR (CERES, H)-based genetic perturbations, respectively, in seven HPVneg HNSCC cell lines. R: Pearson’s correlation coefficient. Numbers in parentheses represent the sample sizes for the involved groups. See also Figure S4 and Table S4.
Figure 5.
Figure 5.. Proteogenomic characterization of EGFR ligand-dependent and -independent pathways.
(A) Heatmap comparing EGFR multi-omics profiles and the inferred PROGENy EGFR pathway activity and (B) their Pearson’s correlation coefficients. *p<0.01. (C) EGFR ligand mRNA abundance in tumors and NATs. **p < 0.001, Student’s t-test. (D) Pearson’s correlation between EGFR pathway activity and mRNA abundance of individual ligands. (E) For genes in the ligand-dependent pathways downstream of EGFR, the Pearson’s correlations between each omics feature and average ligand abundance (correlation to ligands) or EGFR abundance (correlation to receptor) are shown. *p < 0.01. Reported functional sites are colored green. (F) Relationship between PROGENy EGFR pathway activity (color gradients) and average ligand abundance or EGFR phosphorylation level. The six triangles represent samples with the high EGFR amplification. (G) Abundance comparisons between amplified samples and controls for 11 tyrosine phosphosites and cognate mRNA and proteins. Green box indicates known regulation by EGFR, black and gray indicate known and predicted EGFR substrates, respectively. Numbers on the side indicate fold changes. *p<0.01, Student’s t-test. (H) GO biological processes enriched with proteins with EGFR CN-associated phosphorylation (Fisher’s exact test). (I) Diagram depicting two modes of EGFR activation with implications for EGFR mAb therapies. (J) Comparisons between non-responsive (NR) and responsive (R) HPVneg HNSCC PDX models to Cetuximab treatment for average ligand (ligand_ave), individual ligands, and EGFR mRNA abundance. *p<0.05; **p<0.01 Student’s t-test. (K) Spearman’s correlations between mRNA abundance and PFS using data from a clinical trial testing panitumumab in HNSCC patients. Numbers in parentheses represent the sample sizes for the involved groups. See also Figure S5 and Table S5.
Figure 6.
Figure 6.. Immuno-proteogenomic analysis reveals immunosuppressive SCNA drivers.
(A) Pearson’s correlations between ESTIMATE immune score and proteogenomic profiles of immune infiltration, cytotoxic factors, and immune inhibitors. (B) Comparisons of the immune score across clinical attributes (*p<0.01, Student’s t-test). (C) Correlations among immune checkpoints and suppressors. (D) Copy number (CN), mRNA abundance, and protein abundance of three SCNA driver genes. (E) Diagram showing the information flow from antigen processing and presenting machinery (APM) regulators to APM components. The top row for each gene shows the cis-effect of CN on RNA and protein abundance, and the bottom row shows the correlation between immune score and each omics type. (F) Pathways enriched for immune-associated genes whose expression was suppressed by SCNA (i.e., immunosuppressive SCNA drivers). (G) Pathways enriched for immune-associated genes whose expression was not associated with SCNA (i.e., effectors of the immune-suppressive CN deletions). (H) The distribution of immunosuppressive SCNAs across the genome. Selected immune genes are highlighted. Numbers in parentheses represent the sample sizes for the involved groups. See also Figure S6 and Table S6.
Figure 7.
Figure 7.. Integrated multi-omics subtypes and subtype-specific targeted therapies.
(A) Proteomic and phosphoproteomic profiles of the signature proteins and the enriched biological processes of the three integrated subtypes. (B) Sample distribution across different clinical attributes. (C) Comparisons of the three subtypes for four molecular phenotypes. *p<0.01, **p<0.001, Student’s t-test. (D) mRNA and protein levels of protein-specific gene signatures related to epigenetic, basal, and translation initiation factors for different subtypes. Each feature was tested for its differential abundance between the given subtype and the other two subtypes. *: adjusted p<0.01 for both comparisons, Student’s t-test. (E) Heatmap visualizing proteogenomic measurements of the suggested biomarkers for targeted therapies and candidacy for treatment with CDK inhibitors (upper), EGFR mAb (middle), and immune checkpoint blockade (bottom). (F) Comparisons of the proposed biomarkers between high-potential and low-potential tumors, and between each group of tumors and NATs. Numbers at the top denote fold changes. *p<0.01 **p<0.001. Student’s t-test. (G) The proportions of high-potential candidates for each target therapy in the three subtypes. Numbers in parentheses represent the sample sizes for the involved groups. See also Figure S7 and Table S7.

Similar articles

Cited by

References

    1. Adkins D, Ley J, Neupane P, Worden F, Sacco AG, Palka K, Grilley-Olson JE, Maggiore R, Salama NN, Trinkaus K, et al. (2019). Palbociclib and cetuximab in platinum-resistant and in cetuximab-resistant human papillomavirus-unrelated head and neck cancer: a multicentre, multigroup, phase 2 trial. Lancet Oncol 20, 1295–1305. - PubMed
    1. Almeida LG, Sakabe NJ, deOliveira AR, Silva MCC, Mundstein AS, Cohen T, Chen Y-T, Chua R, Gurung S, Gnjatic S, et al. (2009). CTdatabase: a knowledge-base of high-throughput and curated data on cancer-testis antigens. Nucleic Acids Res 37, D816–819. - PMC - PubMed
    1. Alvarez MJ, Shen Y, Giorgi FM, Lachmann A, Ding BB, Ye BH, and Califano A (2016). Functional characterization of somatic mutations in cancer using network-based inference of protein activity. Nat Genet 48, 838–847. - PMC - PubMed
    1. Ang KK, Zhang Q, Rosenthal DI, Nguyen-Tan PF, Sherman EJ, Weber RS, Galvin JM, Bonner JA, Harris J, El-Naggar AK, et al. (2014). Randomized phase III trial of concurrent accelerated radiation plus cisplatin with or without cetuximab for stage III to IV head and neck carcinoma: RTOG 0522. J Clin Oncol 32, 2940–2950. - PMC - PubMed
    1. Aran D, Hu Z, and Butte AJ (2017). xCell: digitally portraying the tissue cellular heterogeneity landscape. Genome Biol 18, 220. - PMC - PubMed

Publication types

Substances