. 2021 Feb 8;39(2):240-256.e11.
doi: 10.1016/j.ccell.2020.12.002. Epub 2021 Jan 7.

An Embryonic Diapause-like Adaptation with Suppressed Myc Activity Enables Tumor Treatment Persistence

Affiliations

An Embryonic Diapause-like Adaptation with Suppressed Myc Activity Enables Tumor Treatment Persistence

Eugen Dhimolea et al. Cancer Cell. .

Abstract

Treatment-persistent residual tumors impede curative cancer therapy. To understand this cancer cell state we generated models of treatment persistence that simulate the residual tumors. We observe that treatment-persistent tumor cells in organoids, xenografts, and cancer patients adopt a distinct and reversible transcriptional program resembling that of embryonic diapause, a dormant stage of suspended development triggered by stress and associated with suppressed Myc activity and overall biosynthesis. In cancer cells, depleting Myc or inhibiting Brd4, a Myc transcriptional co-activator, attenuates drug cytotoxicity through a dormant diapause-like adaptation with reduced apoptotic priming. Conversely, inducible Myc upregulation enhances acute chemotherapeutic activity. Maintaining residual cells in dormancy after chemotherapy by inhibiting Myc activity or interfering with the diapause-like adaptation by inhibiting cyclin-dependent kinase 9 represent potential therapeutic strategies against chemotherapy-persistent tumor cells. Our study demonstrates that cancer co-opts a mechanism similar to diapause with adaptive inactivation of Myc to persist during treatment.

Keywords: CDK9; CRISPR; MYC; adaptation to stress; breast cancer; cancer; diapause; drug persistence; prostate cancer; residual tumor.


Conflict of interest statement

Declaration of Interests E.D. and C.S.M. are co-inventors on a patent related to the use of 3D cultures. Y.C. reports personal fees from Oric Pharmaceuticals outside the submitted work. R.J. reports research funding from Pfizer and Lilly and consulting for Carrick and Luminex. M.B. reports sponsored research support from Novartis; serves on the science advisory board (SAB) of and received fees from Kronos Bio, GV20 Oncotherapy, and H3 Biomedicine; and holds equity in Kronos Bio and GV20 Oncotherapy. N.S.G. is a founder, SAB member, and equity holder in Gatekeeper, Syros, Petra, C4, Allorion, Jengu, Inception, B2S, and Soltego (board member) and his lab receives or has received research funding from Novartis, Takeda, Astellas, Taiho, Jansen, Kinogen, Her2llc, Deerfield, and Sanofi. C.S.M. discloses research funding from Janssen/Johnson & Johnson, Teva, EMD Serono, Abbvie, Arch Oncology, Karyopharm, Sanofi, and Nurix; employment of a relative with Takeda; and consultant/honoraria from Fate Therapeutics, Ionis Pharmaceuticals, and FIMECS.

Figures
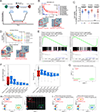
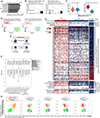
Figure 1.
Figure 1.. Modeling treatment-persistent residual tumors in 3-D organoid cultures.
(A) Schematic representation of treatment-persister residual tumor cells and their distinction from treatment-naïve tumor cells or post-treatment tumors at the time of relapse. (B) Longitudinal viability of MDAMB-231 3-D organoids and 2-D cultures (quadruplicates; mean ± SEM) to indicated cytotoxic drugs (100nM) over time (top; plateauing of the viability curve indicates drug-persistent organoid fractions) and H&E staining images of day-15 docetaxel-persistent MDAMB-231 organoid fractions and respective control (bottom); scale bar 100 μm. (C) Viability of 253 cancer cell lines (each transduced with its own DNA barcode distinct from the other cell lines of this panel; see Methods) grown as 3-D organoids or 2-D cultures (triplicates) exposed to docetaxel (100nM; 3 time-points). % Cell viability is shown in logarithmic scale; horizontal bars indicate median. (D) Longitudinal response of HCI-002 PDOs (quadruplicates; mean ± SEM) to chemotherapeutic agents (100nM); curve plateau indicates treatment-persister residual tumor cells (top) and representative H&E staining images of indicated organoids (bottom); scale bar 100 μm. (E) Transcriptional changes in clinical residual tumors (vs. respective baselines; aggregate of PROMIX trial patients) depicted as enrichment plots for genes upregulated or downregulated in HCI002 TP-organoids (similar results were obtained with other TP-organoid models). (F) Gene-level pairwise comparison of clinical chemotherapy-persistent residual BrCa tumors (PROMIX trial, after 2 chemotherapy cycles (Kimbung et al., 2018), dataset GSE87455) and our BrCa TP-organoid models: graphs depict the Spearman correlation FDR (left) and coefficient (right) values of pairwise comparisons of each patient tumor vs. all other patient tumors in this cohort (red); and between each patient tumor vs. each of the BrCa TP-organoid/PDX models (blue) treated with docetaxel (Doc) or afatinib (Afa). The analysis was performed on the subset of 1401 genes that were differentially expressed on the aggregate patients residual tumors vs. respective baseline (FDR≤0.05) from limma t-test analysis of the global two-group comparison. (G-I) UMAP plot of single-cell RNA sequencing profiles in baseline and chemo-persister residual TNBC patient tumor (G; separate clusters indicate newly-acquired transcriptional profile in the residual cancer cells) and respective UMAP plots for expression in these single cells of the transcriptional signatures derived from docetaxel-persister organoids (vs. respective controls) in TNBC 3D-culture models of MDAMB-231 (H) and HCI002 (I) cells.
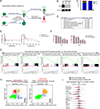
Figure 2.
Figure 2.. Treatment persistence in preclinical models is not driven by selection of de novo mutations or rare pre-existing clones.
(A) Two-dimensional density plot of single nucleotide variant allelic frequencies from whole-exome sequencing of docetaxel-persister vs. treatment-naïve 3D MDAMB-231 organoids. (B) Schematic representation of the DNA barcode-based clonal tracking in vivo experiment. (C) Treatment of MDAMB-231 barcoded xenografts (mean ± SEM) induces tumor regression segued by treatment-persister residual tumors. (D) Barcode abundance in the tumor cell population prior to engraftment (T0, gray), and in tumors treated with DMSO vehicle-control (V, yellow), Docetaxel (D, blue) or Epirubicin (E, green). Barcodes are ordered vertically according to their initial abundance (lowest to highest from top to bottom) at T0 and barcodes with >1% abundance are assigned random colors. (E) Beta Diversity (Bray Curtis) scores for the barcodes observed for tumors in each of the treatment groups. (F) Barcode distribution in residual tumors and vehicle-control, separately for each group (left) or superimposed (right).
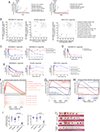
Figure 3.
Figure 3.. The transcriptional adaptation in treatment-persistent tumors encompasses suppression of Myc activity and mimics embryonic diapause.
(A) Transcriptional signatures that are suppressed in docetaxel-persistent residual MDAMB-231 xenografts. (B) GSEA enrichment plots of Myc target genes in treatment-persistent residual tumor cells (compared to baseline) in preclinical models (left) and in clinical samples (right; PROMIX trial dataset GSE87455). Aggregate enrichment in organoid/PDX models or patient cohort is shown. (C) Single-cell analysis of MYC gene copy number and transcriptional activity in baseline and chemo-persister residual cells of TNBC patient (Kim et al., 2018). (D) UMAP plot of single-cell RNA profile from baseline and residual patient tumor with MYC amplification, showing the expression patterns in individual cells of the transcriptional signature induced by CRISPR-Cas9 mediated editing of MYC in MDAMB-231 cells. (E) Schematic representation of adaptive cellular states examined. (F) GSEA results from comparisons of mouse embryonic diapause vs. normal epiblast (Boroviak et al., 2015; Scognamiglio et al., 2016); drug-persistent patient tumors vs. their respective pretreatment baseline (Kimbung et al., 2018); and BrCa/PrCa TP-organoid (ORG) and PDX residual tumors after treating with docetaxel (DOC), afatinib (AFA) or vinblastine (VINBL) vs. their respective vehicle-treated samples. Normalized enrichment scores (NES) is shown. (G) Heatmap depicting the MSigDB gene sets significantly (FDR<0.05) alterered in embryonic diapause and their respective enrichment status in drug-persistent residual tumor fractions in examined patient datasets (aggregate expression); in individual BrCa patients from PROMIX trial (dataset GSE87455); and in our preclinical models; notice association between the EDL score (see Methods) and the enrichment status of Myc target gene sets (the 14 MSigDB gene sets with negative enrichment [FDR<0.05] in either embryonic diapause or the clinical dataset are shown). The additional patient dataset of I-SPY trial is shown in Suppl. Figure S5D. (H) 2D GO pathway expression analyses (including CPDB pathways and GO terms; see Methods) comparing docetaxel-persistent MDAMB-231 TP-organoids with different mouse embryo developmental stages (Boroviak et al., 2015). Spearman correlation coefficients indicate significant similarity of the TP-organoids to the diapaused E4.5 epiblast but not to other embryonic stages [comparisons similar to those performed by (Bulut-Karslioglu et al., 2016) and (Scognamiglio et al., 2016)].
Figure 4.
Figure 4.. Suppression of Myc activity induces diapause-like molecular profile and reduces the effect of cytotoxic treatment in cancer cells.
(A) 2D GO enrichment comparison between transcriptional changes induced in MDAMB-231 cells by CRISPR-based MYC KO (vs. OR10G2 KO, as control) with those in mouse embryonic diapause (vs. normal epiblast; left) and those in docetaxel-persistent MDAMB-231 organoids (vs. treatment-naïve; right). (B-C) Viability of MDAMB-231 cells with knocked-out MYC or OR10G2 (as control) exposed to 1μM docetaxel for 24h, visualized microscopically (B; scale bar 200 μm) or measured as % of live cells (C; trypan blue assay); (quadruplicates; mean ± SEM). (D) The effect of docetaxel on the viability of MDAMB-231 and MCF7 BrCa cells with KO of MYC or control genes OR10G2 and OR10G3 in 2-D cultures (24h time point); (quadruplicates; mean ± SEM). (E and F) Abrogation of chemotherapy-induced cytotoxicity in MDAMB-231 (E, 7 days) and MCF7 and ZR75–1 (F, 5 days) organoid cultures by co-treatment with JQ1; (quadruplicates; mean ± SEM).
Figure 5.
Figure 5.. Suppression of Myc activity in cancer cells reduces redox stress and attenuates apoptotic priming
(A) Epirubicin-induced redox stress in treatment-naïve and docetaxel-persister MDAMB-231 organoids; 24h (triplicates; mean ± SEM). (B) JQ1 (500nM) effect on redox stress levels in MDAMB-231 cells in the presence of cytotoxic chemotherapy (epirubicin 1μM; 12h, triplicates; mean ± SEM)). (C) MDAMB-231 3-D organoids treated with docetaxel or epirubicin in the presence vs. absence of N-acetylcysteine or JQ1 (6 day time-point; quadruplicates; mean ± SEM) (D and E) Apoptosis (D, 12h) and viability (E, 24h) of MDAMB-231 cells treated with H2O2 (150μM) in the presence or absence of JQ1 (500nM); quadruplicates; mean ± SEM. (F) Transcriptional changes (compared to vehicle) of apoptotic genes in treatment-persister organoids and PDX models. (G) Sensitivity of naïve and docetaxel-persister organoid models to venetoclax (72h); quadruplicates, mean ± SEM. (H) Sensitivity of MDAMB-231 cells to venetoclax in presence or absence of JQ1 or N-acetylcysteine (72h); (quadruplicates, mean ± SEM. (I) Comparing apoptotic priming between docetaxel-persister TP-organoids and their naïve counterparts using the BH3 profiling method (Montero et al., 2015); triplicates; mean ± SEM. (J) Western blot showing downregulation of Myc protein in MDAMB-231 cells via doxycycline-inducible CRISPRi. (K and L) Comparing apoptotic priming, using BH3 profiling, in MDAMB-231 cells with CRISPRi against MYC or (as controls) downregulated OR10G3 or OR6S1 (K); or JQ1 (L); triplicates; mean ± SEM.
Figure 6.
Figure 6.. The diapause-like treatment-persister adaptation involves distinct features beyond proliferative quiescence.
(A) Schematic representation of the experiment. (B) Dephosphorylation of Rb in MDAMB-231 organoids after treatment with 500nM abemaciclib. (C and D) Suppression of transcriptional signatures for cell-cycle molecular mechanisms (C, top 10 terms for negative enrichment in cell cycle-arrested organoids) and of cell cycle progression (D, cell cycle analysis) in MDAMB-231 organoids after treatment with abemaciclib (8 days). (E and F) Dose (E) and time-lapse (F) response of non-arrested and abemaciclib-arrested MDAMB-231 organoids to cytotoxic agents (quadruplicates; mean ± SEM). (G) Gene set enrichment plots depicting transcriptional changes in chemo-persister cell cycle-arrested organoid fractions (obtained by longitudinal treatment of abemaciclib-arrested organoids with docetaxel to generate persister cell population) vs. their respective cell cycle-arrested baseline (obtained by treatment with abemaciclib only). (H) 2D GO analysis showing correlation of transcriptional changes induced in cell cycle-arrested (abemaciclib-arrested vs. untreated; left), or in cell cycle-arrested treatment-persister (abemaciclib-arrested and chemo-persister vs. abemaciclib-arrested; right), MDAMB-231 organoids with transcriptional changes in embryonic diapause. (I) Expression of hallmark transcriptional modules of embryonic diapause in cell cycle-arrested and in arrested treatment-persister MDAMB-231 organoids.
Figure 7.
Figure 7.. Diapause-like persister organoids have distinct therapeutic vulnerabilities.
(A) Effect of JQ1 and INK128 on the regrowth of EDL epirubicin-persister or docetaxel-persister MDAMB-231 organoids after chemotherapeutic washout (triplicates; mean ± SEM) (B-D) Sensitivity of docetaxel-naïve and docetaxel-persister organoid models MDAMB-231, HCI002 and MSK-PrCa1 to 176 compounds of various classes (B) and examples of validation by time-lapse and/or fixed time-point assays for selected chemotherapeutics (C, 72h) and epigenetic (D, 96h) agents; quadruplicates; mean ± SEM. (E) Sensitivity of naïve and docetaxel-persister organoids a heterobifunctional degrader of CDK9 (ZZ1–33; see methods) and CDK9 inhibitors (NVP2 and SNS032) (48h) (Olson et al., 2018); quadruplicates; mean ± SEM. (F-H) Transcriptional changes induced in MDAMB-231 TP-organoids after 24h exposure to CDK9 inhibitor NVP2, depicted as gene set enrichment plots for biosynthetic and metabolic activity (F), Myc activity (G), and mouse embryonic diapause signature (H). (I and J) In vivo effect of chemotherapy, CDK9 inhibitor NVP2, and combination treatment on MDAMB-231 xenograft growth. Tumor responses after 4 weeks treatment (I; mean values and SEM shown in blue) and images of harvested tumors at the end of the experiment (J).

Comment in

References

    1. Aguirre-Ghiso JA (2007). Models, mechanisms and clinical evidence for cancer dormancy. Nature reviews Cancer 7, 834–846. - PMC - PubMed
    1. Alzahrani AS (2019). PI3K/Akt/mTOR inhibitors in cancer: At the bench and bedside. Seminars in cancer biology. - PubMed
    1. Ashburner M, Ball CA, Blake JA, Botstein D, Butler H, Cherry JM, Davis AP, Dolinski K, Dwight SS, Eppig JT, et al. (2000). Gene ontology: tool for the unification of biology. The Gene Ontology Consortium. Nat Genet 25, 25–29. - PMC - PubMed
    1. Barlow JH, Faryabi RB, Callen E, Wong N, Malhowski A, Chen HT, Gutierrez-Cruz G, Sun HW, McKinnon P, Wright G, et al. (2013). Identification of early replicating fragile sites that contribute to genome instability. Cell 152, 620–632. - PMC - PubMed
    1. Benjamini Y, and Hochberg Y (1995). Controlling the False Discovery Rate: A Practical and Powerful Approach to Multiple Testing. Journal of the Royal Statistical Society Series B (Methodological) 57, 289–300.

Publication types

MeSH terms

Substances