. 2021 Jan 12;34(2):108630.
doi: 10.1016/j.celrep.2020.108630. Epub 2020 Dec 26.

D614G Mutation Alters SARS-CoV-2 Spike Conformation and Enhances Protease Cleavage at the S1/S2 Junction

Affiliations

D614G Mutation Alters SARS-CoV-2 Spike Conformation and Enhances Protease Cleavage at the S1/S2 Junction

Sophie M-C Gobeil et al. Cell Rep. .

Abstract

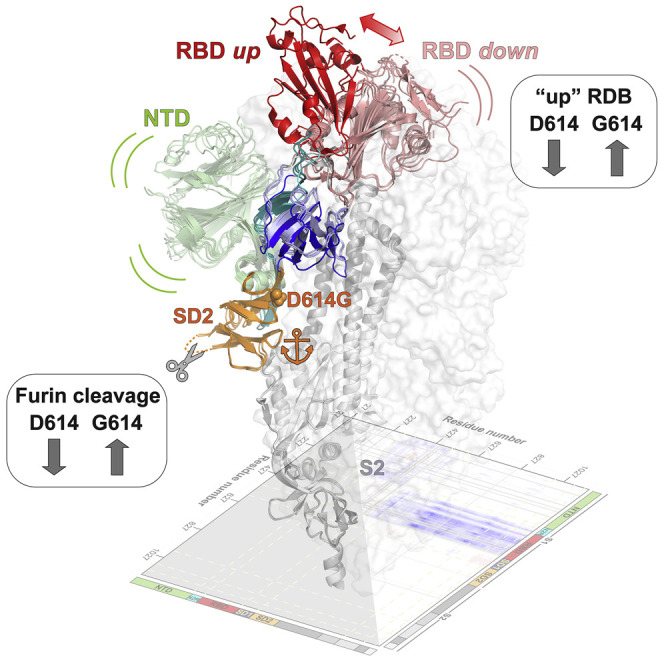
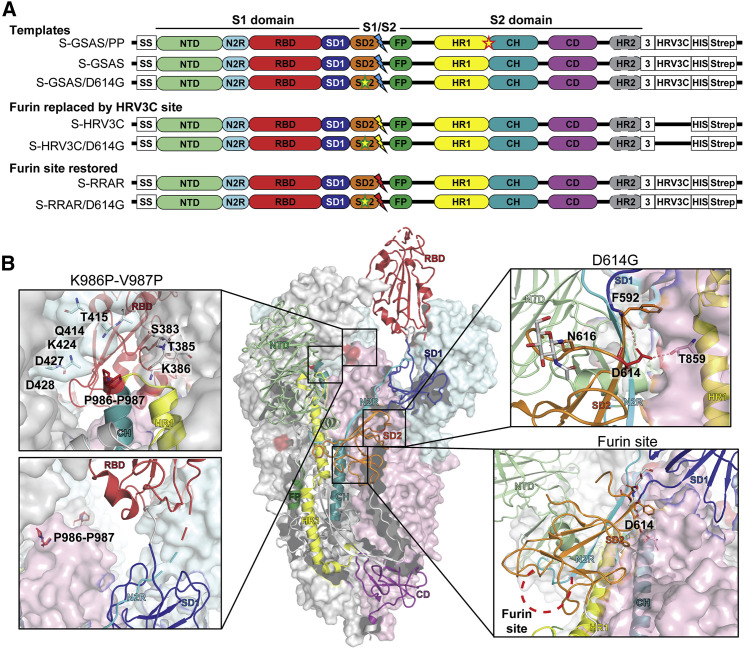
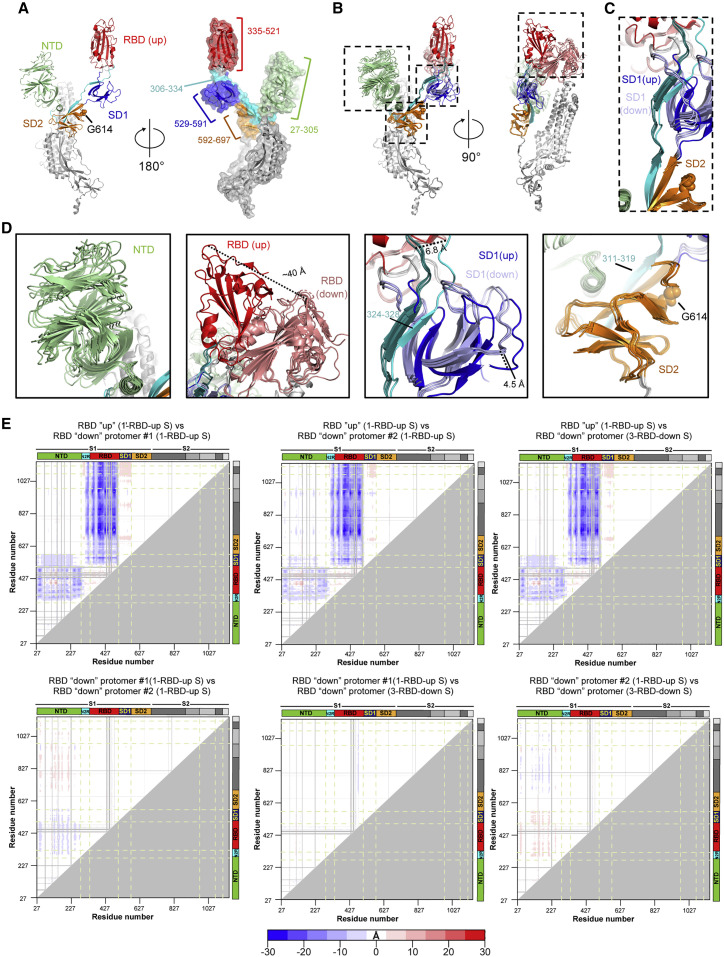
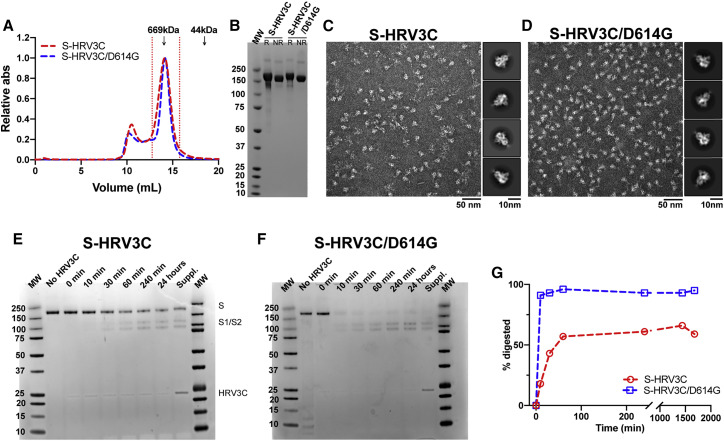
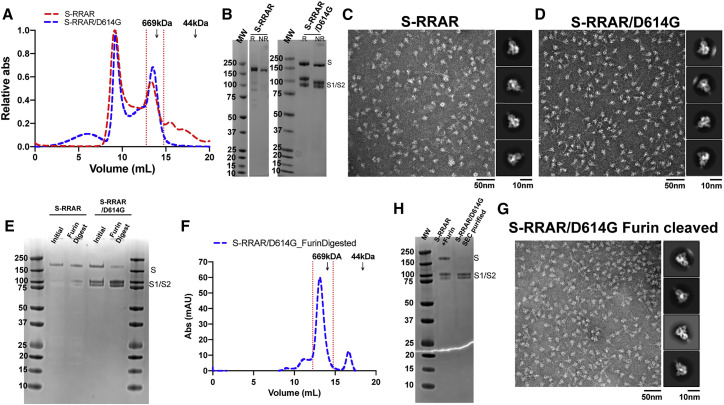
The severe acute respiratory coronavirus 2 (SARS-CoV-2) spike (S) protein is the target of vaccine design efforts to end the coronavirus disease 2019 (COVID-19) pandemic. Despite a low mutation rate, isolates with the D614G substitution in the S protein appeared early during the pandemic and are now the dominant form worldwide. Here, we explore S conformational changes and the effects of the D614G mutation on a soluble S ectodomain construct. Cryoelectron microscopy (cryo-EM) structures reveal altered receptor binding domain (RBD) disposition; antigenicity and proteolysis experiments reveal structural changes and enhanced furin cleavage efficiency of the G614 variant. Furthermore, furin cleavage alters the up/down ratio of the RBDs in the G614 S ectodomain, demonstrating an allosteric effect on RBD positioning triggered by changes in the SD2 region, which harbors residue 614 and the furin cleavage site. Our results elucidate SARS-CoV-2 S conformational landscape and allostery and have implications for vaccine design.

Keywords: 2P; COVID-19; D614G; SARS-CoV-2; allostery; cryo-EM; furin cleavage; spike.


Conflict of interest statement

Declaration of Interests The authors declare no competing interests.

Figures

None
Graphical abstract
Figure 1
Figure 1
SARS-CoV-2 Spike (S) Protein Ectodomain Platform for Characterizing the Structures, Antigenicity, and Protease Susceptibility of the S Protein and D614G Mutant (A) Domain architecture of the SARS-CoV-2 S protomer. The S1 subunit contains a signal sequence (SS), the NTD (N-terminal domain, pale green), N2R (NTD-to-RBD linker, cyan), RBD (receptor-binding domain, red), and SD1 and SD2 (subdomains 1 and 2, dark blue and orange) subdomains. The S2 subunit contains the FP (fusion peptide, dark green), HR1 (heptad repeat 1, yellow), CH (central helix, teal), CD (connector domain, purple), and HR2 (heptad repeat 2, gray) subdomains. The transmembrane domain (TM) and cytoplasmic tail (CT) have been truncated and replaced by a foldon trimerization sequence (3), an HRV3C cleavage site (HRV3C), a his-tag (His), and a strep-tag (Strep). The D614G mutation is in the SD2 domain (yellow star, green contour). The S1/S2 furin cleavage site (RRAR; red lightning) has been mutated to GSAS (blue lightning) or to an HRV3C protease cleavage site (yellow lightning). The K986P-V987P mutations between the HR1 and CH domains are indicated by a yellow star (red contour) on the S-GSAS/PP template. (B) Representation of the trimeric SARS-CoV-2 S ectodomain with one RBD-up in a prefusion conformation (PDB: 6VSB). The S1 domain on an RBD-down protomer is shown as pale green molecular surface, while the S2 domain is shown in pale red. The subdomains on an RBD-up protomer are colored according to (A) on a ribbon diagram. Each inset corresponds to the S regions understudy and is highlighted in red on the trimeric structure (K986P-V987P, D614G, and the furin protease cleavage site).
Figure 2
Figure 2
Biophysics, Antigenicity, and Structure of the S-GSAS Ectodomain in Relation to S-GSAS/PP (A) Size-exclusion chromatography (SEC) elution profile on a Superose 6 10/300 column of the S-GSAS/PP (black) and S-GSAS (red) ectodomains. Fractions isolated for further characterization are indicated by vertical red dotted lines. Elution volumes of molecular weight standards at 669 (thyroglobulin) and 44 kDa (ovalbumin) are labeled for reference. (B) SDS-PAGE of the SEC purified ectodomains. (C) Representative NSEM micrograph of S-GSAS and 2D class averages (related to Data S1). (D) Binding of ACE2 receptor ectodomain (RBD-directed), CR3022 (RBD-directed neutralizing antibody), 2G12 (S2-directed), Ab712199 (RBD-directed neutralizing antibody), and Ab511584 (S2-directed non-neutralizing antibody) to S-GSAS (red) and S-GSAS/PP (black) measured by ELISA. The schematic shows the assay format. Serially diluted S protein was bound in individual wells of 384-well plates, which were previously coated with streptavidin. Proteins were incubated and washed; then antibodies at 10 μg/mL or ACE2 with a mouse Fc tag at 2 μg/mL were added. Antibodies were incubated and washed, and binding was detected with goat anti-human horseradish peroxidase (HRP). (E) Differential scanning fluorimetry (DSF) of the S-GSAS (red) and S-GSAS/PP (black) S ectodomains. Thermal melting inflection points (Ti) are indicated on the first derivative graph and reported in the table below from a triplicate. (F) Side and top view of the cryo-EM reconstructions of the 1-RBD-up (EMD:22822) and the 3-RBD-down (EMD:22821) states of the S-GSAS ectodomain colored by chain. The up positioned RBD in the map is identified by an asterisk (related to Table S1 and Data S1). (G) Superposition of the 1-up (left; PDB: 7KDH and 6VYB) and 3-down (right; PDB: 7KDG and 6VXX) structures of S-GSAS (red) and S-GSAS/PP (green). All Cα atoms were used for the superpositions. (H) Magnified view of one protomer from the 1-RBD-up model showing residues K986 and V987 from S-GSAS (colored according to F, overlaid with S-GSAS/PP; PDB: 6VYB; yellow), showing residues P986 and P987 in sticks (related to Figure S1).
Figure 3
Figure 3
Biophysics and Structure of the S-GSAS/D614G Ectodomain (A) (Left) SEC elution profile on a Superose 6 10/300 column of the S-GSAS/D614G (blue) ectodomain. Fractions isolated for further characterization are indicated by vertical red dotted lines. Elution volumes of standard at 669 and 44 kDa are labeled for reference. (Middle) SDS-PAGE of the SEC purified ectodomain. (right) Differential scanning fluorimetry (DSF) of S-GSAS/D614G (blue). Thermal melting inflection points (Ti) are indicated on the first derivative graph and reported in the table below from a triplicate. (B) Representative NSEM micrograph of S-GSAS/D614G and 2D class averages (related to Data S2). (C) Side view of the cryo-EM reconstruction of the 1-RBD-up (EMD: 22826) and the 3-RBD-down (EMD: 22825) states of the S-GSAS/D614G ectodomain colored by chain. The up positioned RBD in the map is identified by an asterisk (related to Table S1 and Data S2). (D) (Left) Top view of the 1-RBD-up S trimer shown in (C). (Right) Subpopulations obtained by further classification (EMD: 22835, 22836, 22837, and 22838) (related to Figure S2 and Data S3). (E) (Left) Top view of the 3-RBD-down S trimer shown in (C). (Right) Subpopulations obtained by further classification (EMD: 22831, 22832, 22833, and 22834) (related to Figure S2 and Data S3).
Figure 4
Figure 4
Domain Motions in the S-GSAS/D614G Ectodomain (A) RBD-up chain from the structure shown in Figure 3C (PDB: 7KDL) with the S1 subunit colored by domain and the S2 subunit colored gray. RBD is colored red, NTD green, SD1 dark blue, SD2 orange, and the linker between the NTD and RBD cyan. (B) Overlay of the individual protomers in the 1-RBD-up structure and a protomer in the C3 symmetric 3-RBD-down structure (PDB: 7KDK) shown in Figure 3C. The structures were superimposed using S2 subunit residues 908–1,035 (spanning the HR1 and CH regions). The domain colors of the up-RBD chain are as described in (A). The down-RBDs are colored salmon, and the SD1 domains from the down RBD chains are colored light blue. The linker between the NTD and RBD in the down RBD chains is colored deep teal. (C) Zoomed-in view showing the association of the linker connecting the NTD and RBD with the SD1 and SD2 domains. (D) Zoomed-in views of individual domains marked in (B). The N2R linker spanning residues 306–334 connects the NTD and the RBD. Residues 324–328 of the N2R linker contribute a β strand to the SD1 subdomain together forming the SD1′ “super” subdomain. Residues 311–319 of the N2R linker contribute a β strand to the SD2 subdomain together forming the SD2′ “super” subdomain. (E) Difference distance matrices (DDMs) showing structural changes between different protomers for the structures shown in Figure 3C. The blue to white to red coloring scheme is illustrated at the bottom (related to Figure S3).
Figure 5
Figure 5
The Engineered S-HRV3C/D614G Ectodomain Is More Susceptible to S1/S2 Cleavage by the HRV3C Protease Than S-HRV3C (A) SEC elution profile on a Superose 6 10/300 column of the S-HRV3C (red) and S-HRV3C/D614G (blue) ectodomains. Fractions isolated for further characterization are indicated by vertical red dotted lines. Elution volumes of standards at 669 and 44 kDa are labeled for reference. (B) SDS-PAGE of the SEC purified ectodomains. (C and D) Representative NSEM micrograph of (C) S-HRV3C and (D) S-HRV3C/D614G ectodomains and 2D class averages (related to Data S4). (E and F) SDS-PAGE of an HRV3C digestion of the (E) S-HRV3C and (F) S-HRV3C/D614G engineered ectodomains at 25°C for 24 h in the presence of 0.03 U of enzyme per microgram of ectodomain. Aliquots corresponding to 1 μg protein at the time points before HRV3C addition, at addition (0 min) and 10 min, 30 min, 60 min, 240 min, and 24 h following HRV3C addition are presented. After 24 h, 0.03 supplementary unit of the HRV3C enzyme per microgram of ectodomain was added, and aliquots were analyzed after 4 additional hours of incubation aiming at completion of the digestion (labeled Suppl.). (G) Quantification of S protomer (200 kDa) band intensity on SDS-PAGE at the time points presented on (E) and (F) (S-HRV3C in red, S-HRV3C/D614G in blue). NR, non-reduced sample; R, reduced sample.
Figure 6
Figure 6
The S-RRAR/D614G Ectodomain Is More Susceptible to S1/S2 Cleavage by Furin Than S-RRAR (A) SEC elution profile of the S-RRAR (in red) and S-RRAR/D614G (in blue) ectodomains. Fractions isolated for further characterization are indicated by vertical red dotted lines. Elution volumes of standards at 669 and 44 kDa are labeled for reference. (B) SDS-PAGE of the SEC purified ectodomains. The S1 and S2 domains corresponding bands are identified (the left gel is a continuum of gel presented on Figure 5B; marker lane was copied). (C and D) Representative NSEM micrograph of (C) S-RRAR and (D) S-RRAR/D614G ectodomains and 2D class averages (related to Data S5). (E) SDS-PAGE of furin digestion of the S-RRAR and S-RRAR/D614G ectodomains at 25°C for 3 h in the presence of 0.3 U of enzyme per microgram of ectodomain in buffer containing 0.2 mM CaCl2. Aliquots corresponding to 1 μg of protein at the time points before furin addition and 3 h post-addition are presented. (F) SEC elution profile of the S-RRAR/D614G furin digested (in blue). Fractions isolated for further characterization are indicated by vertical red dotted lines. (G) SDS-PAGE of the S-RRAR/D614G furin digested and SEC purified ectodomain. The S1 and S2 domains corresponding bands are identified. In lane 2, the S-RRAR ectodomain was further incubated for 16 h with 0.3 U of furin per microgram of ectodomain aiming at completing the digestion. (H) Representative NSEM micrograph and 2D class averages of the S-RRAR/D614G furin digested and SEC purified following digestion.
Figure 7
Figure 7
Structure and Antigenicity of the Furin-Cleaved S-RRAR/D614G Ectodomain (A) Side view of the cryo-EM reconstruction of the 1-RBD-up (EMD: 22824) and the 3-RBD-down (EMD: 22823) states of the furin-cleaved S-RRAR/D614G ectodomain colored by chain. The up positioned RBD in the map is identified by an asterisk. The NTDs in the asymmetric 1-RBD-up structure are labeled (related to Table S1 and Data S5). (B) Binding of ACE2 receptor ectodomain (RBD-directed), CR3022 (RBD-directed neutralizing antibody), 2G12 (S2-directed), Ab712199 (RBD-directed neutralizing antibody), and Ab511584 (S2-directed non-neutralizing antibody) to S-GSAS/D614G (in blue) and the furin-cleaved S-RRAR/D614G ectodomain (in green) measured by ELISA. The assay format was the same as in Figure 2D. (C) Overlay of the individual protomers in the 1-RBD-up structure (PDB: 7KDJ) and a protomer in the C3 symmetric 3-down-RBD structure (PDB: 7KDI) shown in (A). RBD-up chain with the S1 subunit colored by domain and the S2 subunit colored gray. RBD is colored red, NTD green, SD1 dark blue, SD2 orange, and the linker between the NTD and RBD cyan. The down RBDs are colored salmon, and the SD1 domains from the down RBD chains are colored light blue. The linker between the NTD and RBD in the down RBD chains is colored deep teal. Insets show zoomed-in views of individual domains similar to the depiction in Figure 4D. (D) (Left) The protomers of the 1-RBD-up structure of the furin-cleaved S-RRAR/D614G ectodomain superimposed using residues 908–1,035 and colored by the color of their NTD as depicted in (A). Zoomed-in views show region of the SD2 domain proximal to the NTD.

Update of

References

    1. Acharya P., Williams W., Henderson R., Janowska K., Manne K., Parks R., Deyton M., Sprenz J., Stalls V., Kopp M. A glycan cluster on the SARS-CoV-2 spike ectodomain is recognized by Fab-dimerized glycan-reactive antibodies. bioRxiv. 2020 doi: 10.1101/2020.06.30.178897. - DOI
    1. Afonine P.V., Poon B.K., Read R.J., Sobolev O.V., Terwilliger T.C., Urzhumtsev A., Adams P.D. Real-space refinement in PHENIX for cryo-EM and crystallography. Acta Crystallogr. D Struct. Biol. 2018;74:531–544. - PMC - PubMed
    1. Bestle D., Heindl M.R., Limburg H., Van Lam van T., Pilgram O., Moulton H., Stein D.A., Hardes K., Eickmann M., Dolnik O. TMPRSS2 and furin are both essential for proteolytic activation of SARS-CoV-2 in human airway cells. Life Sci. Alliance. 2020;3:e202000786. - PMC - PubMed
    1. Corbett K.S., Edwards D.K., Leist S.R., Abiona O.M., Boyoglu-Barnum S., Gillespie R.A., Himansu S., Schäfer A., Ziwawo C.T., DiPiazza A.T. SARS-CoV-2 mRNA vaccine design enabled by prototype pathogen preparedness. Nature. 2020;586:567–571. - PMC - PubMed
    1. de Wit E., van Doremalen N., Falzarano D., Munster V.J. SARS and MERS: recent insights into emerging coronaviruses. Nat. Rev. Microbiol. 2016;14:523–534. - PMC - PubMed

Publication types