. 2021 Jan 7;184(1):226-242.e21.
doi: 10.1016/j.cell.2020.11.018.

Colorectal Cancer Cells Enter a Diapause-like DTP State to Survive Chemotherapy

Affiliations

Colorectal Cancer Cells Enter a Diapause-like DTP State to Survive Chemotherapy

Sumaiyah K Rehman et al. Cell. .

Abstract

Cancer cells enter a reversible drug-tolerant persister (DTP) state to evade death from chemotherapy and targeted agents. It is increasingly appreciated that DTPs are important drivers of therapy failure and tumor relapse. We combined cellular barcoding and mathematical modeling in patient-derived colorectal cancer models to identify and characterize DTPs in response to chemotherapy. Barcode analysis revealed no loss of clonal complexity of tumors that entered the DTP state and recurred following treatment cessation. Our data fit a mathematical model where all cancer cells, and not a small subpopulation, possess an equipotent capacity to become DTPs. Mechanistically, we determined that DTPs display remarkable transcriptional and functional similarities to diapause, a reversible state of suspended embryonic development triggered by unfavorable environmental conditions. Our study provides insight into how cancer cells use a developmentally conserved mechanism to drive the DTP state, pointing to novel therapeutic opportunities to target DTPs.

Keywords: MRD; autophagy; barcode; chemotherapy; colorectal cancer; diapause; drug tolerant persisters; equipotent; mTOR; slow-cycling.


Conflict of interest statement

Declaration of Interests J.M. is a shareholder in Northern Biologics and Pionyr Immunotherapeutics and an advisor for Century Therapeutics and Aelian Biotechnology.

Figures
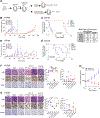
Figure 1 –
Figure 1 –. Response of CRC patient-derived xenografts to treatment with chemotherapy.
A:In vivo treatment schematic for two CRC patient-derived xenograft (PDX) models (POP66, CSC28). B and C: Tumor growth curves (B) and Kaplan-Meier survival curves (C) of POP66 PDXs treated with Saline, DMSO, 5-FU/LV, CPT-11, or FOLFIRI. D and E: Tumor growth curves (D) and Kaplan-Meier survival curves (E) of CSC28 PDXs treated with Saline, DMSO, 5-FU/LV, CPT-11, or FOLFIRI. Numbers in parentheses indicate biological replicates in that group. Dotted line indicates when treatment was stopped. Each point on growth curve is the mean tumor volume ± SEM, two-way ANOVA. Median time to reach tumor volume 400mm3 is listed for the POP66 and CSC28 PDXs, log-rank test. F and G: IHC (H&E, Ki-67, TUNEL stain, 20x) analysis of tumors for POP66 (F) from Figure 1B and CSC28 (G) from Figure 1D at endpoint. CPT-11 DTP state tumors were harvested on day 28 of treatment. Scale bar, 50 µm. Percent Ki-67 positive cells and percent area Necrosis are plotted, one-way ANOVA. H: Reinjection of CPT-11-treated tumors that regrew (Figure 1B, CPT-11 Regrowth tumors) and re-treatment with DMSO or CPT-11. Numbers in parentheses indicate biological replicates in that group, t-test. *P<0.05, **P<0.01, ***P<0.001. See also Table S1, Figures S1 and S2.
Figure 2 –
Figure 2 –. Barcode complexity in PDXs post-chemotherapy.
A: Barcoding and in vivo treatment schematic for the POP66 and CSC28 CRC PDX models from Figure 1. B and C: Clonal composition of tumors grown in mice from barcoded POP66 (B) or CSC28 (C) models from Figures 1B and C, following control treatment (Saline, DMSO) or chemotherapy. Barcodes are arranged along the Y-axis according to their starting abundance (T0). Each barcode is assigned a random color for plotting. Only barcodes enriched to at least 1% in one or more tumors are shown. D and E: Shannon Diversity Index for the clones observed in the top 98% of reads for tumors in each treatment group for POP66 (D) and CSC28 (E). No significant differences were found in barcode composition by pairwise Wilcoxon rank-sum test with Holm multiple testing correction. See also Figure S4 and Table S2.
Figure 3 –
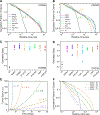
Figure 3 –. Clonal composition remains invariant across treatment.
A and B: Mean cumulative clone size distribution for POP66 (A) and CSC28 (B) PDXs across treatments. C and D: Estimated power-law slope for individual tumors across treatments for POP66 (C) and CSC28 (D) PDXs. E: Tumor growth kinetics as a function of interaction parameter, α. F: Dependence of cumulative clone size distribution as a function of interaction parameter, α. See also Figure S5.
Figure 4 –
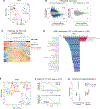
Figure 4 –. DTP state cells express an embryonic pausing signature.
A: PCA plot for all expressed genes across control (CTRL), CPT-11 DTP state, and CPT-11 Regrowth tumor samples. B: MA plot showing log2 fold-changes in the expression of each gene in CPT-11 DTP state (left) or CPT-11 Regrowth (right) over CTRL. Genes differentially expressed (FDR<0.05, fold-change >1.5 or <2/3) are in blue. Numbers in figure correspond to upregulated (top) and downregulated (bottom) genes. C: Heatmap of top 500 variable genes expression alteration with CTRL, CPT-11 DTP state and CPT-11 Regrowth samples grouped by unsupervised hierarchical clustering. D: GSEA analysis of Hallmark pathways measured by Normalized Enrichment Score (NES) for all significantly altered pathways (FDR<0.05) in DTP tumors. E: PCA plot for all expressed genes across tumor samples (CTRL, CPT-11 DTP state, CPT-11 Regrowth), ESCs (CTRL ESCs, Paused ESCs), and embryos (E4.5, Diapaused Embryos). F: GSEA of CPT-11 DTP state tumor samples for genes upregulated (t>10, top panel) or downregulated (t<−10, bottom panel) in paused ESCs (vs CTRL ESCs). Genes were pre-ranked by fold-change t-values for CPT-11 DTP state (vs CTRL). NES and Bonferroni correction adjusted p-values are indicated. G: Scores of the Embryonic Pausing Signature (n=124 genes) in CTRL, CPT-11 DTP state and CPT-11 Regrowth samples. A signature of 124 randomly selected genes is shown as a control. Data are mean ± SD, Welch two-sample t-test. *P<0.05, ***P<0.001. See also Figure S6 and Tables S3-S6.
Figure 5 –
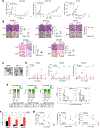
Figure 5 –. CPT-11-induced DTP state CRC xenografts and cultures are slow-cycling.
A: Tumor growth curves of CRC PDXs upon treatment with DMSO or CPT-11. Each point represents mean tumor volume ± SEM. Numbers in parentheses denotes the biological replicates in that group. B: H&E and BrdU IHC staining with quantification of POP92, POP133 and HT29 tumors (from A), and POP66 and CSC28 tumors (from Figure 1) treated with DMSO or CPT-11 for 28 days (20x). Images are representative of n=4 (POP92, POP133, POP66, CSC28) or n=2 (HT29) biological replicates. Differences in BrdU incorporation were not statistically significant, unpaired t-test with Welch’s correction. C: Representative brightfield images for POP66 cultures treated with DMSO or CPT-11 for 10 days (20x) in vitro. D: Cell growth curves of POP66, POP92 and CSC28 CRC cultures treated with DMSO (black) or CPT-11 (1µM; red) in vitro. Solid line indicates cell growth on treatment, dashed line indicates cell growth when treatment was stopped at day 14. Data are mean ± SD, n=4 independent experiments, two-way ANOVA. E: Cell cycle analysis of CRC cultures treated with DMSO or CPT-11 for 14 days. Data are mean ± SEM, n=3 independent experiments, two-way ANOVA. Representative flow plots are shown. F: Apoptosis/Necrosis analysis (Annexin V/PI label) on CRC cultures treated with DMSO or CPT-11 for 5 days. Data are mean ± SD, at least n=3 independent experiments, t-test. G: Cytofluorimetric analysis of percent Vybrant DiD label positive cultures treated with DMSO or CPT-11 in vitro. Treatment was stopped on day 14. Data are mean ± SEM, n=3 independent experiments, t-test. *P<0.05, **P<0.01, ***P<0.001, ns=not significant. See also Figure S7.
Figure 6 –
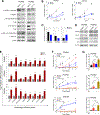
Figure 6 –. CPT-11-induced diapause-like DTP state is maintained by upregulation of autophagy.
A: Western blot analysis of mTOR pathway in POP66 and POP92 cultures treated with DMSO or CPT-11 (1µM) for 14 days in vitro (representative of at least n=3 independent experiments). B: Cell growth curves of CRC cultures treated with DMSO (black) or mTOR inhibitor INK 128 (25nM; blue). Solid lines indicate ongoing treatment, dashed lines indicate cell growth after treatment was stopped at day 14 day. Data are mean ± SD, n=3 independent experiments, two-way ANOVA. C: Apoptosis/Necrosis analysis (Annexin V/PI label) on CRC cultures treated with DMSO or INK 128 for 5 days. Data are mean ± SD, n=3 independent experiments, one-way ANOVA. D: Western blot analysis of autophagy pathway proteins in CRC cultures treated with DMSO or CPT-11 for 14 days in vitro (representative of at least n=3 independent experiments). E: qRT-PCR analysis of autophagy pathway genes in CRC cultures treated with CPT-11 for 7 days in vitro. Values are relative to DMSO, normalized to RPLP0, mean ± SEM, n=3 independent experiments, t-test. F: Cell growth curves of CRC cultures treated in vitro with DMSO (black), CPT-11 (red), SBI-0206965 (SBI, 2.5µM; blue) or combination (CPT-11+SBI; gold). Solid lines indicate cell growth on treatment, dashed lines indicate cell growth when treatment was stopped at day 14. Data are mean ± SEM, n=3 independent experiments, two-way ANOVA. G: Apoptosis/Necrosis analysis (Annexin V/PI label) performed on CRC cultures treated with DMSO, CPT-11, SBI or combination for 5 days. Data are mean ± SD, n=3 independent experiments, one-way ANOVA. *P<0.05, **P<0.01, ***P<0.001, ns=not significant.
Figure 7 –
Figure 7 –. Embryonic pausing signature applied to various cancer models and databases.
A: Scores of the embryonic pausing signature in previously reported studies related to Minimal Residual disease (MRD; GEO databases GSE83142, GSE102124, GSE116237), Welch two-sample t-test, ***P<0.001. B and C: Overall Kaplan-Meier plot for TCGA CRC patient data stratified to high and low groups based on (B) the embryonic pausing signature (p= 0.02, log-rank test) or (C) GO autophagy signature (GO:0010506; p=6×10⁻⁴, log-rank test). D: Forest plot showing the overall survival Hazard Ratio (HR) for indicated cancers of TCGA based on GO autophagy signature.
Model Figure 1 –
Model Figure 1 –. Cumulative distributions of simulated power law growth kinetics.
A,B, and C: Time evolution of cumulative distributions obtained from simulation of 105 clones with growth kinetics characterized by power law with (A) α = 0.3 (B) α = 0.5 and (C) α = 0.7 Time is measured in number of generations and the solid line shows the slope of α on the log-log plot.

Comment in

References

    1. Balaban NQ, Gerdes K, Lewis K, and McKinney JD (2013). A problem of persistence: still more questions than answers? Nat Rev Microbiol 11, 587–591. - PubMed
    1. Balaban NQ, Merrin J, Chait R, Kowalik L, and Leibler S (2004). Bacterial persistence as a phenotypic switch. Science 305, 1622–1625. - PubMed
    1. Benjamin D, Sato T, Cibulskis K, Getz G, Stewart C, and Lichtenstein L (2019). Calling Somatic SNVs and Indels with Mutect2. bioRxiv, 861054. 10.1101/861054. - DOI
    1. Bhang HE, Ruddy DA, Krishnamurthy Radhakrishna V, Caushi JX, Zhao R, Hims MM, Singh AP, Kao I, Rakiec D, Shaw P, et al. (2015). Studying clonal dynamics in response to cancer therapy using high-complexity barcoding. Nat Med 21, 440–448. - PubMed
    1. Boroviak T, Loos R, Lombard P, Okahara J, Behr R, Sasaki E, Nichols J, Smith A, and Bertone P (2015). Lineage-Specific Profiling Delineates the Emergence and Progression of Naive Pluripotency in Mammalian Embryogenesis. Dev Cell 35, 366–382. - PMC - PubMed

Publication types

MeSH terms