. 2021 Apr;27(4):618-623.
doi: 10.1016/j.cmi.2020.12.028. Epub 2021 Jan 6.

Self-reported symptoms in healthy young adults to predict potential coronavirus disease 2019

Affiliations

Self-reported symptoms in healthy young adults to predict potential coronavirus disease 2019

Maya Nitecki et al. Clin Microbiol Infect. 2021 Apr.

Abstract

Objective: To assess the utility of self-reported symptoms in identifying positive coronavirus disease 2019 (COVID-19) cases among predominantly healthy young adults in a military setting.

Methods: A questionnaire regarding COVID-19 symptoms and exposure history was administered to all individuals contacting the Israeli Defence Forces Corona call-centre, before PCR testing. Surveyed symptoms included cough, fever, sore throat, rhinorrhoea, loss of taste or smell, chest pain and gastrointestinal symptoms. Factors were compared between positive and negative cases based on confirmatory test results, and positive likelihood ratios (LR) were calculated. Results were stratified by sex, body mass index, previous medical history and dates of questioning, and a multivariable analysis for association with positive test was conducted.

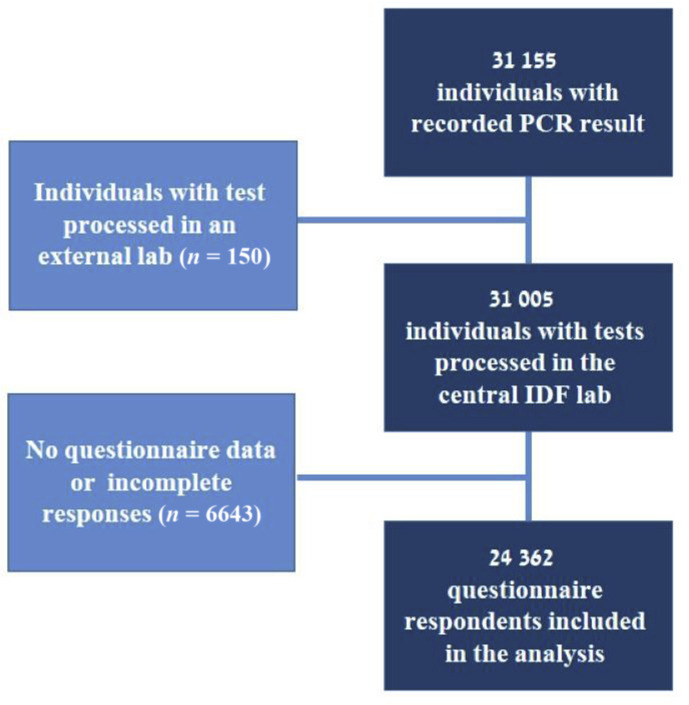
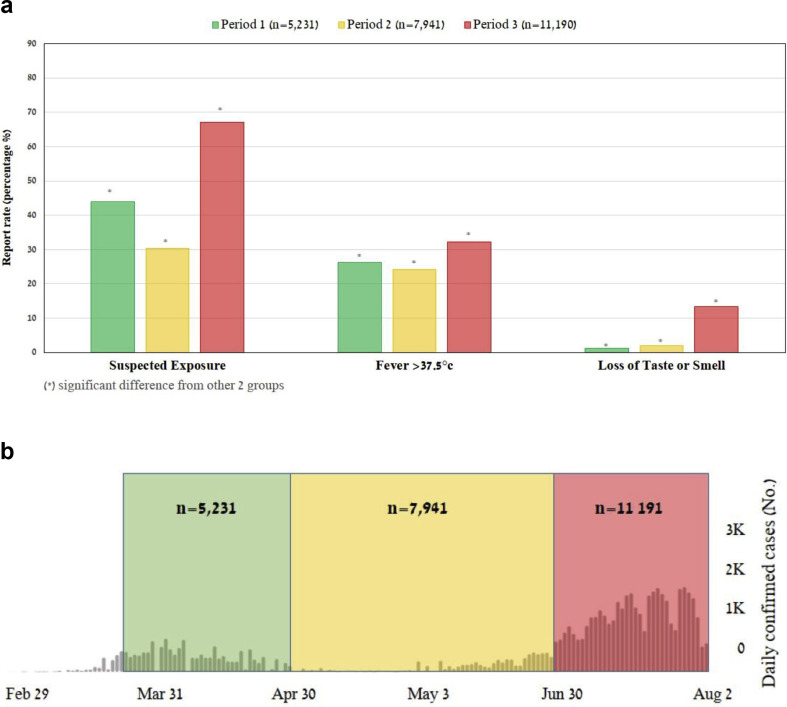
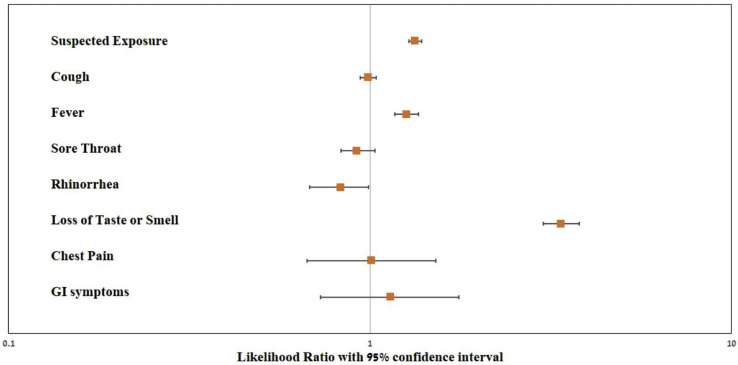
Results: Of 24 362 respondents, 59.1% were men with a median age of 20.5 years (interquartile range 19.6-22.4 years). Significant positive LRs were associated with loss of taste or smell (LR 3.38, 95% CI 3.01-3.79), suspected exposure (LR 1.33, 95% CI 1.28-1.39) and fever (LR 1.26, 95% CI 1.17-1.36). Those factors were also associated with positive PCR result in a multivariable analysis (OR 3.51, 95% CI 3.04-4.06; OR 1.86, 95% CI 1.65-2.09; and OR 1.34, 95% CI 1.19-1.51, respectively). Reports of loss of taste or smell increased gradually over time and were significantly more frequent during the late period of the study (63/5231, 1.21%; 156/7941, 1.96%; and 1505/11 190, 13.45%: p < 0.001).

Conclusion: Loss of taste or smell, report of a suspicious exposure and fever (>37.5°C) were consistently associated with positive LRs for a positive SARS-CoV-2 PCR test result, in a population of predominantly young and healthy adults.

Keywords: Coronavirus disease 2019; Coronavirus disease 2019 confirmatory test shortage; Coronavirus disease 2019 in young adults; Coronavirus disease 2019 self-reported symptoms; Coronavirus disease 2019 symptoms; Coronavirus disease 2019 testing; Coronavirus disease 2019 testing criteria; Utility of self-reported symptoms.


Figures

Fig. 1
Fig. 1
Study population flow chart. Numbers represent respondents. A total of 31 155 individuals were identified between 26 March and 2 August 2020. Those with no recorded PCR test result, or whose tests were processed in an external laboratory (n = 150) were excluded. Questionnaires were not performed among 6643 (21.4%) individuals so their exposure and symptoms data were missing, resulting in their exclusion from the analysis, which ultimately included 24 362 respondents with a PCR test result and questionnaire data.
Fig. 2
Fig. 2
(a) Comparison of the report rate of surveyed factors against time. Presented here are factors that were associated with significant positive likelihood ratios for COVID-19 (see text). In general, overall report rates of suspected exposure and fever were parallel to the extent of disease spread in the country, i.e. decreasing between the first and second period, and raising drastically in the third period. All of these changes were statistically significant (all p ≤ 0.038). The exception is reports of loss of taste or smell, which increased gradually and significantly with time (all p < 0.001), (see Supplementary material, Table S3 for expanded results of statistical analysis). (b) Description of the time sections selected for comparison. This figure details the three consequent periods selected for comparison with the number of overall study participants in each. The background represents COVID-19 disease burden in Israel, as measured by daily confirmed cases between 29 February and 2 August 2020, according to the reports of WHO. Green – period 1: 26 March to 30 April, represents the initial COVID-19 outbreak. Yellow – period 2: 1 May to 30 June, represents mitigation of disease spread. Red – period 3: 1 July to 2 August, represents the increased disease burden following the reopening of communities. The second period is about twice as long because of the relatively small number of cases throughout May and we therefore summed those with the cases identified in the consequent month.
Fig. 3
Fig. 3
Positive likelihood ratios for surveyed factors (n = 24 362). Factors are shown on a logarithmic scale with 95% CI, those positively associated with COVID-19 are reports of suspected exposure (see text for definition), fever >37.5°C, and loss of smell or taste. LR, likelihood ratio. Error bars represent 95% CI.

Similar articles

Cited by

References

    1. Lu H., Stratton C.W., Tang Y.W. Outbreak of pneumonia of unknown etiology in Wuhan, China: the mystery and the miracle. J Med Virol. 2020;92:401–402. - PMC - PubMed
    1. World Health Organization . WHO Dir Gen Speeches; Geneva: 2020. WHO Director-General’s opening remarks at the media briefing on COVID-19 – 11 March 2020. 4.
    1. World Health Organization . WHO; Geneva: 2020. WHO coronavirus disease dashboard.
    1. Esbin M.N., Whitney O.N., Chong S., Maurer A., Darzacq X., Tjian R. Overcoming the bottleneck to widespread testing: a rapid review of nucleic acid testing approaches for COVID-19 detection. RNA. 2020;26:771–783. - PMC - PubMed
    1. Péré H., Péré H., Péré H., Podglajen I., Podglajen I., Wack M. Nasal swab sampling for SARS-CoV-2: a convenient alternative in times of nasopharyngeal swab shortage. J Clin Microbiol. 2020;58 doi: 10.1128/JCM.00721-20. - DOI - PMC - PubMed