. 2021:29:102550.
doi: 10.1016/j.nicl.2020.102550. Epub 2020 Dec 24.

The sequence of structural, functional and cognitive changes in multiple sclerosis

Affiliations

The sequence of structural, functional and cognitive changes in multiple sclerosis

Iris Dekker et al. Neuroimage Clin. 2021.

Abstract

Background: As disease progression remains poorly understood in multiple sclerosis (MS), we aim to investigate the sequence in which different disease milestones occur using a novel data-driven approach.

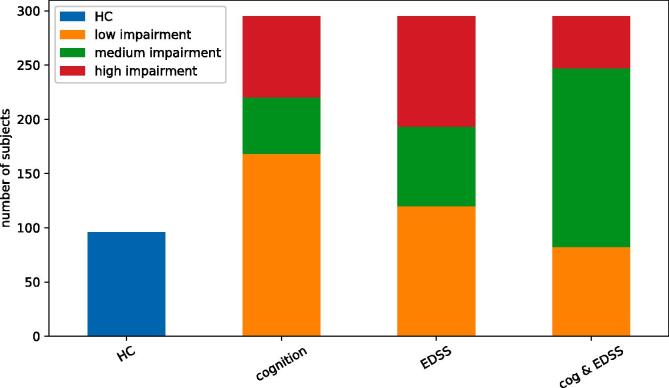
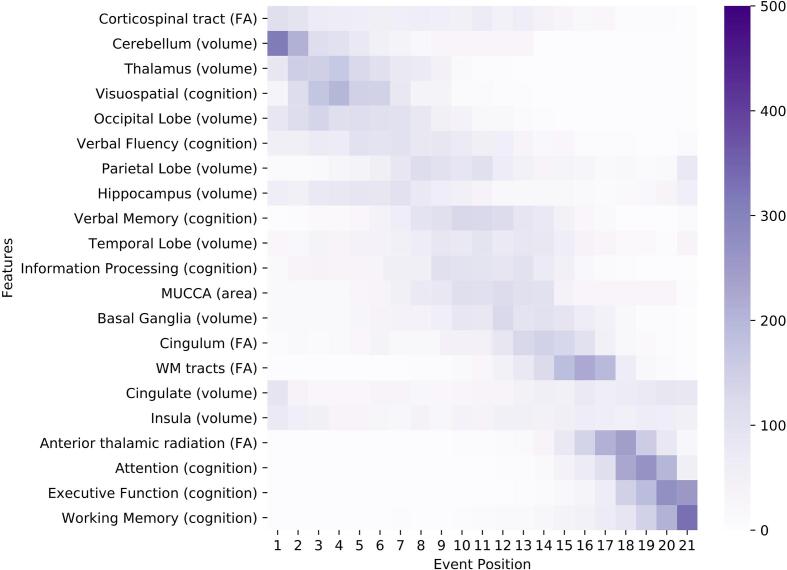
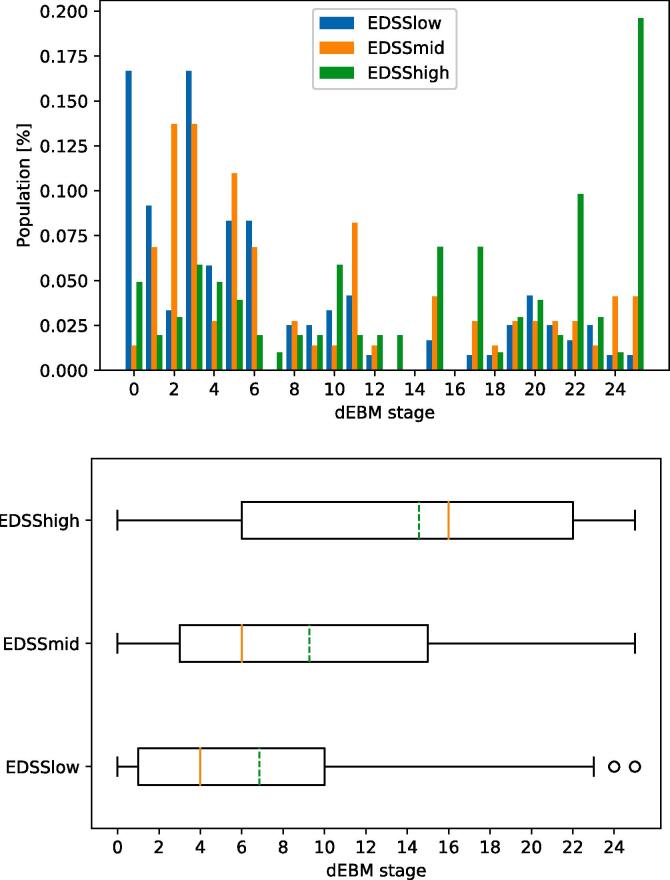
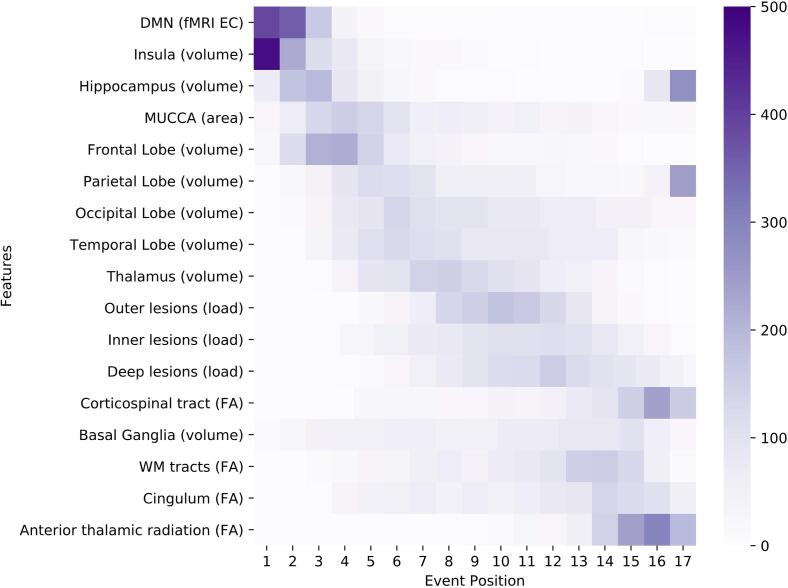
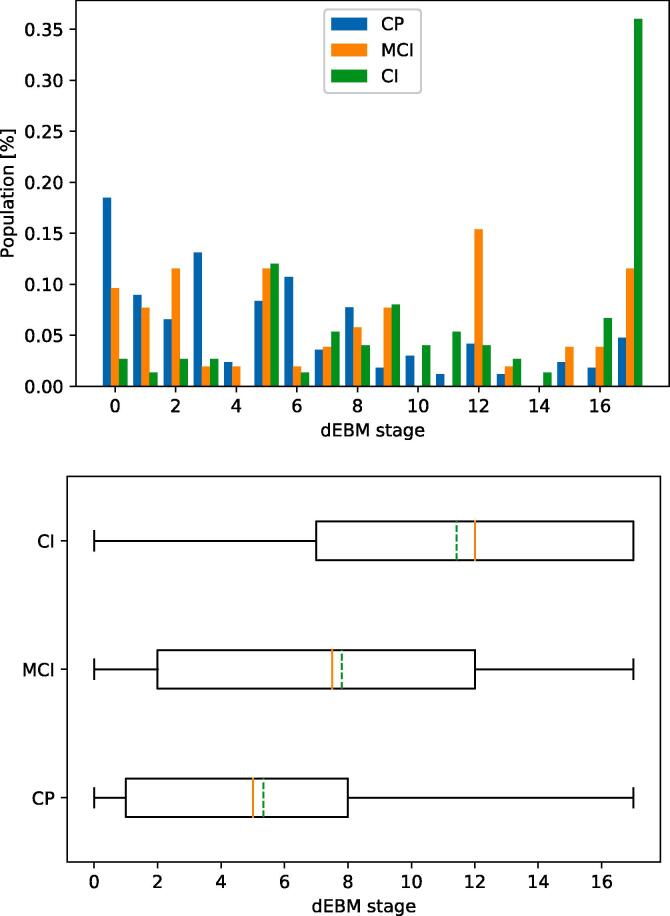
Methods: We analysed a cohort of 295 relapse-onset MS patients and 96 healthy controls, and considered 28 features, capturing information on T2-lesion load, regional brain and spinal cord volumes, resting-state functional centrality ("hubness"), microstructural tissue integrity of major white matter (WM) tracts and performance on multiple cognitive tests. We used a discriminative event-based model to estimate the sequence of biomarker abnormality in MS progression in general, as well as specific models for worsening physical disability and cognitive impairment.

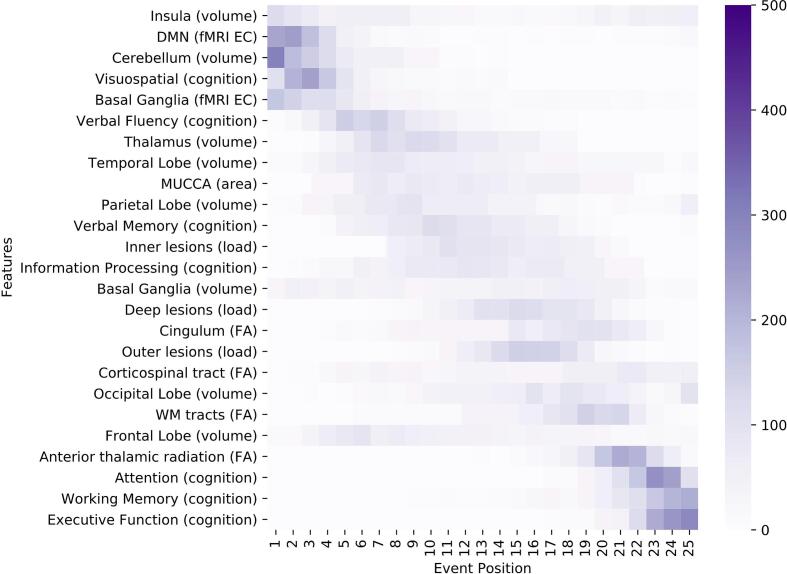
Results: We demonstrated that grey matter (GM) atrophy of the cerebellum, thalamus, and changes in corticospinal tracts are early events in MS pathology, whereas other WM tracts as well as the cognitive domains of working memory, attention, and executive function are consistently late events. The models for disability and cognition show early functional changes of the default-mode network and earlier changes in spinal cord volume compared to the general MS population. Overall, GM atrophy seems crucial due to its early involvement in the disease course, whereas WM tract integrity appears to be affected relatively late despite the early onset of WM lesions.

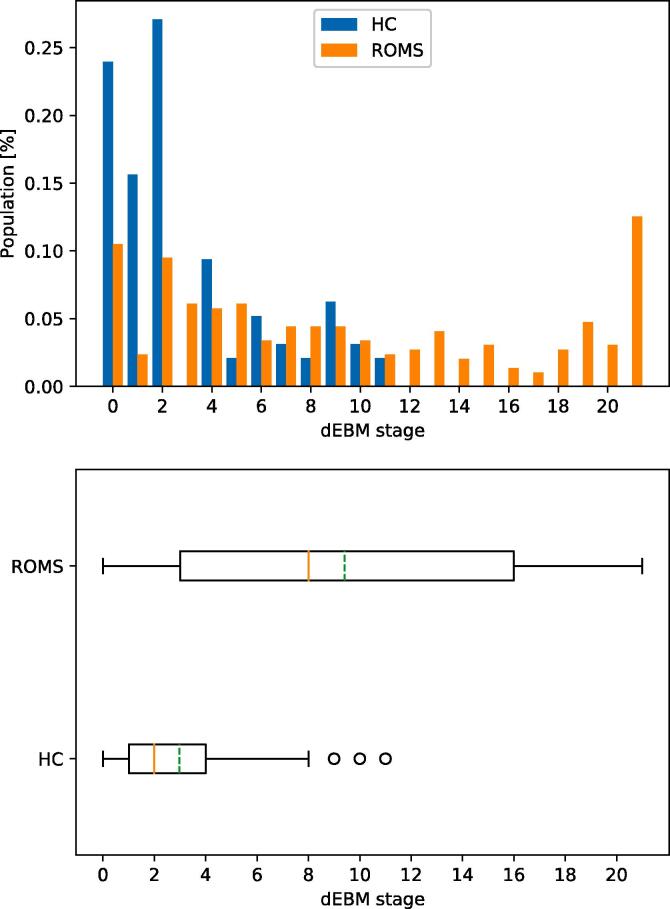
Conclusion: Data-driven modelling revealed the relative occurrence of both imaging and non-imaging events as MS progresses, providing insights into disease propagation mechanisms, and allowing fine-grained staging of patients for monitoring purposes.

Keywords: Cognition; Disability; Disease progression; Event-based modelling; MRI; Multiple sclerosis.


Conflict of interest statement

Dekker received speaking honoraria from Roche. M.M. Schoonheim serves on the editorial board of Frontiers of Neurology and has received compensation for consulting services or speaker honoraria from ExceMed, Genzyme and Biogen. V. Venkatraghavan reports no disclosures. A.J.C. Eijlers reports no disclosures. I. Brouwer reports no disclosures. E.E. Bron reports no disclosures. S. Klein reports no disclosures. M.P. Wattjes reports personal consulting/speaking fees from Biogen, Novartis, Roche, Celgene, IXICO, Sanofi Genzyme, Bayer Healthcare, Biologix, Genilac, Merck Serono. A.M. Wink reports no disclosures. J.J.G. Geurts is an editor of MS journal and serves on the editorial boards of Neurology and Frontiers of Neurology and is president of the Netherlands organization for health research and innovation and has served as a consultant for Merck-Serono, Biogen, Novartis, Genzyme and Teva Pharmaceuticals. B.M.J. Uitdehaag reports personal fees from Genzyme, Biogen Idec, TEVA, Merck Serono, Roche, outside the submitted work. N.P. Oxtoby reports no disclosures. D.C. Alexander reports no disclosures. H. Vrenken has received research grants from MerckSerono, Teva and Novartis, consulting fees from MerckSerono, and speaker honoraria from Novartis; all paid directly to his institution. J. Killestein reports grants and personal fees from Biogen Idec, Novartis, Merck Serono, TEVA, Genzyme, grants and other from Biogen Idec, Novartis, TEVA, Bayer Schering Pharma, Glaxo Smith Kline, Merck Serono. F. Barkhof reports grants and personal fees from Roche, Biogen Idec, Novartis, Merck Serono, TEVA, IXICO, grants and other support from Biogen Idec, Novartis, GE healthcare and Merck Serono. V. Wottschel reports no disclosures.

Figures

Fig. 1
Fig. 1
Overview of diagnostic groups, and separation of ROMS subgroups.
Fig. 2
Fig. 2
Positional variance diagram for the general ROMS population (Model 1). The maximum-likelihood sequence of abnormality is shown on the y-axis (top to bottom). Colour intensity in each row indicates positional variance: the darker the colour, the higher the confidence of the event position across 1000 bootstraps (capped at 500 for visualisation). The biomarker ordering reflects the sequence obtained from fitting all subjects. EC = eigenvector centrality; EDSS: expanded disability status scale; FA: fractional anisotropy as a measure for microstructural WM tract changes; MUCCA: mean upper cervical cord area.
Fig. 3
Fig. 3
Patient staging for Model 1 (ROMS). Top: Staging of HC and ROMS subjects within the 21 disease stages. Bottom: Boxplot of staging indicating median (solid red line) and mean (dashed green line) of the groups. (For interpretation of the references to colour in this figure legend, the reader is referred to the web version of this article.)
Fig. 4
Fig. 4
Positional variance diagram for the progression from low to high disability in ROMS patients (Model 2). The maximum-likelihood sequence of abnormality is shown on the y-axis (top to bottom). Colour intensity in each row indicates positional variance: the darker the colour, the higher the confidence of the event position across 1000 bootstraps (capped at 500 for visualisation). The biomarker ordering reflects the sequence obtained from fitting all subjects. EC = eigenvector centrality; EDSS: expanded disability status scale; FA: fractional anisotropy as a measure for microstructural WM tract changes; MUCCA: mean upper cervical cord area.
Fig. 5
Fig. 5
Patient staging for Model 2 (disability). Top: Staging of subjects with different levels of disability within the 25 disease stages. Bottom: Boxplot of staging indicating median (solid red line) and mean (dashed green line) of the groups. (For interpretation of the references to colour in this figure legend, the reader is referred to the web version of this article.)
Fig. 6
Fig. 6
Positional variance diagram for the progression in ROMS patients as cognition declines (Model 3). The maximum-likelihood sequence of abnormality is shown on the y-axis (top to bottom). Colour intensity in each row indicates positional variance: the darker the colour, the higher the confidence of the event position across 1000 bootstraps (capped at 500 for visualisation). The biomarker ordering reflects the sequence obtained from fitting all subjects. EC = eigenvector centrality; EDSS: expanded disability status scale; FA: fractional anisotropy as a measure for microstructural WM tract changes; MUCCA: mean upper cervical cord area.
Fig. 7
Fig. 7
Patient staging for Model 3 (cognition). Top: Staging of subjects with different levels of cognitive abilities within the 17 disease stages. Bottom: Boxplot of staging indicating median (solid red line) and mean (dashed green line) of the groups. (For interpretation of the references to colour in this figure legend, the reader is referred to the web version of this article.)

References

    1. Amato M.P. The Rao’s Brief Repeatable Battery and Stroop Test: normative values with age, education and gender corrections in an Italian population. Mult. Scler. 2006;12:787–793. - PubMed
    1. Audoin B. Atrophy mainly affects the limbic system and the deep grey matter at the first stage of multiple sclerosis. J. Neurol. Neurosurg. Psychiatry. 2010;81:690–695. - PubMed
    1. Bergsland N. Subcortical and cortical gray matter atrophy in a large sample of patients with clinically isolated syndrome and early relapsing-remitting multiple sclerosis. AJNR. Am. J. Neuroradiol. 2012;33:1573–1578. - PMC - PubMed
    1. Biberacher V. Atrophy and structural variability of the upper cervical cord in early multiple sclerosis. Mult. Scler. 2015;21:875–884. - PubMed
    1. Cardoso M.J., Modat M., Wolz R., Melbourne A., Cash D., Rueckert D., Ourselin S. Geodesic information flows: spatially-variant graphs and their application to segmentation and fusion. IEEE Trans. Med. Imaging. 2015;34(9):1976–1988. doi: 10.1109/TMI.2015.2418298. - DOI - PubMed

Publication types