

Infection rates from Covid-19 in Great Britain by geographical units: A model-based estimation from mortality data
- PMID: 33418438
- PMCID: PMC7572059
- DOI: 10.1016/j.healthplace.2020.102460
Infection rates from Covid-19 in Great Britain by geographical units: A model-based estimation from mortality data
Abstract
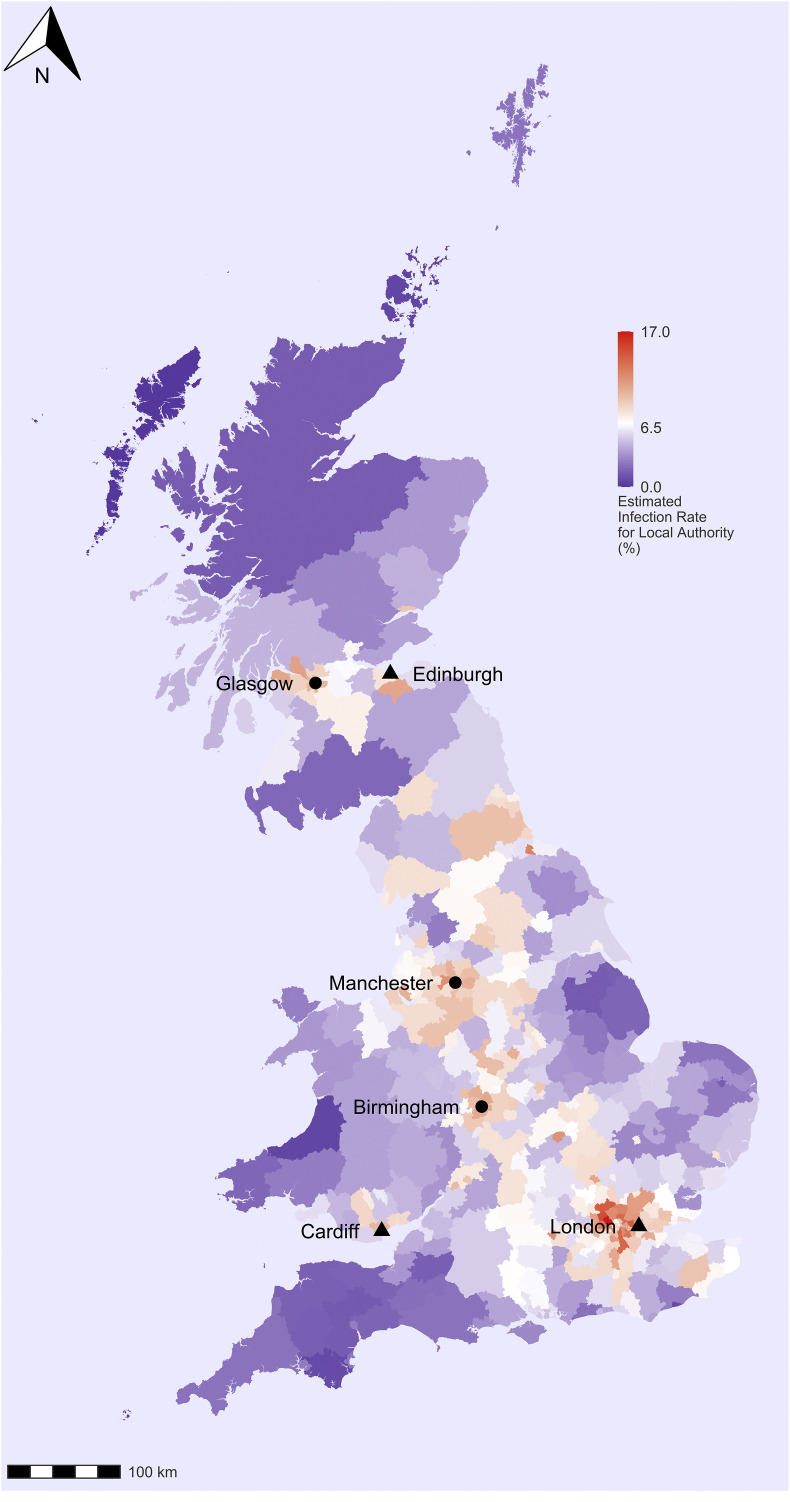
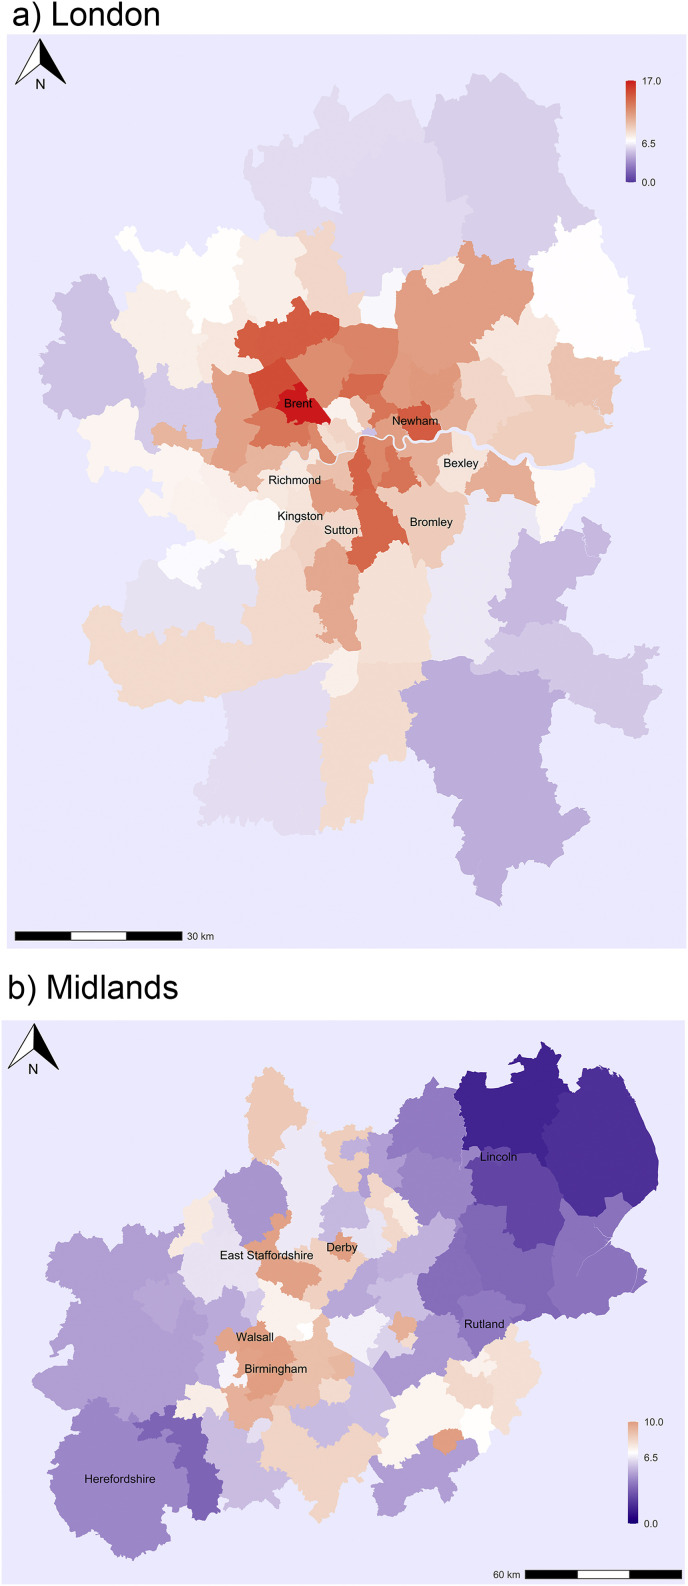
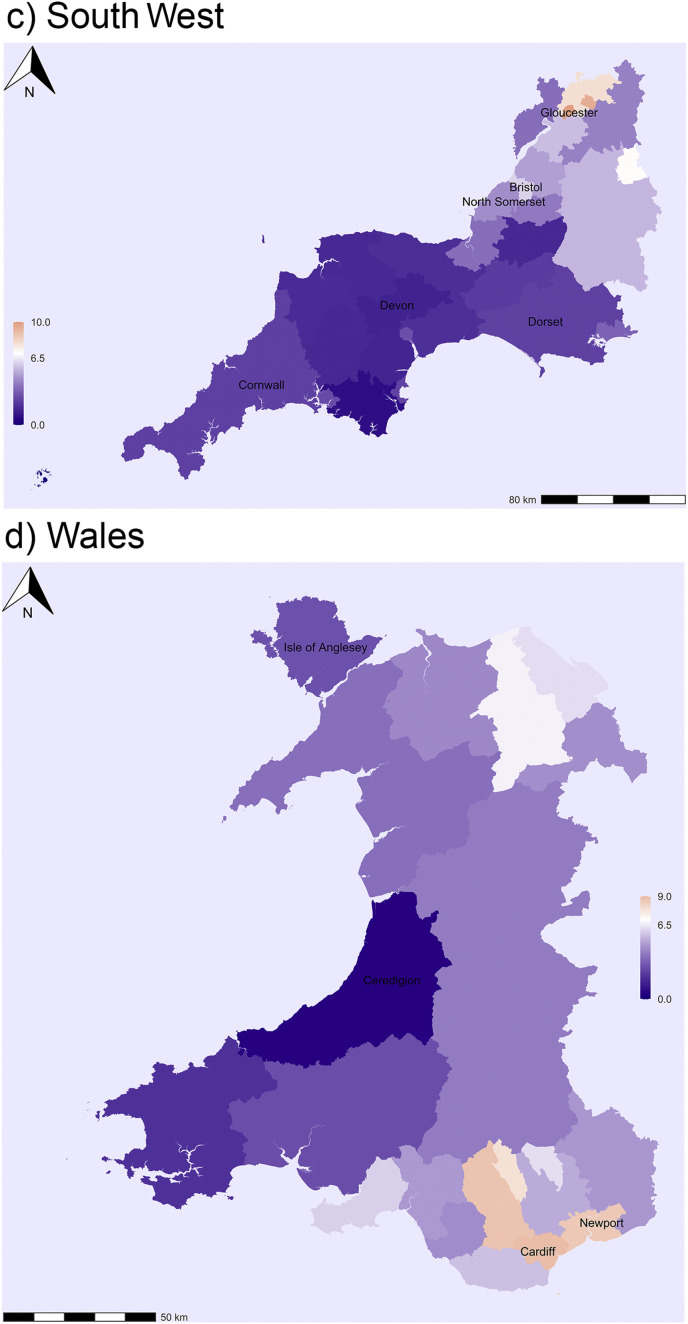
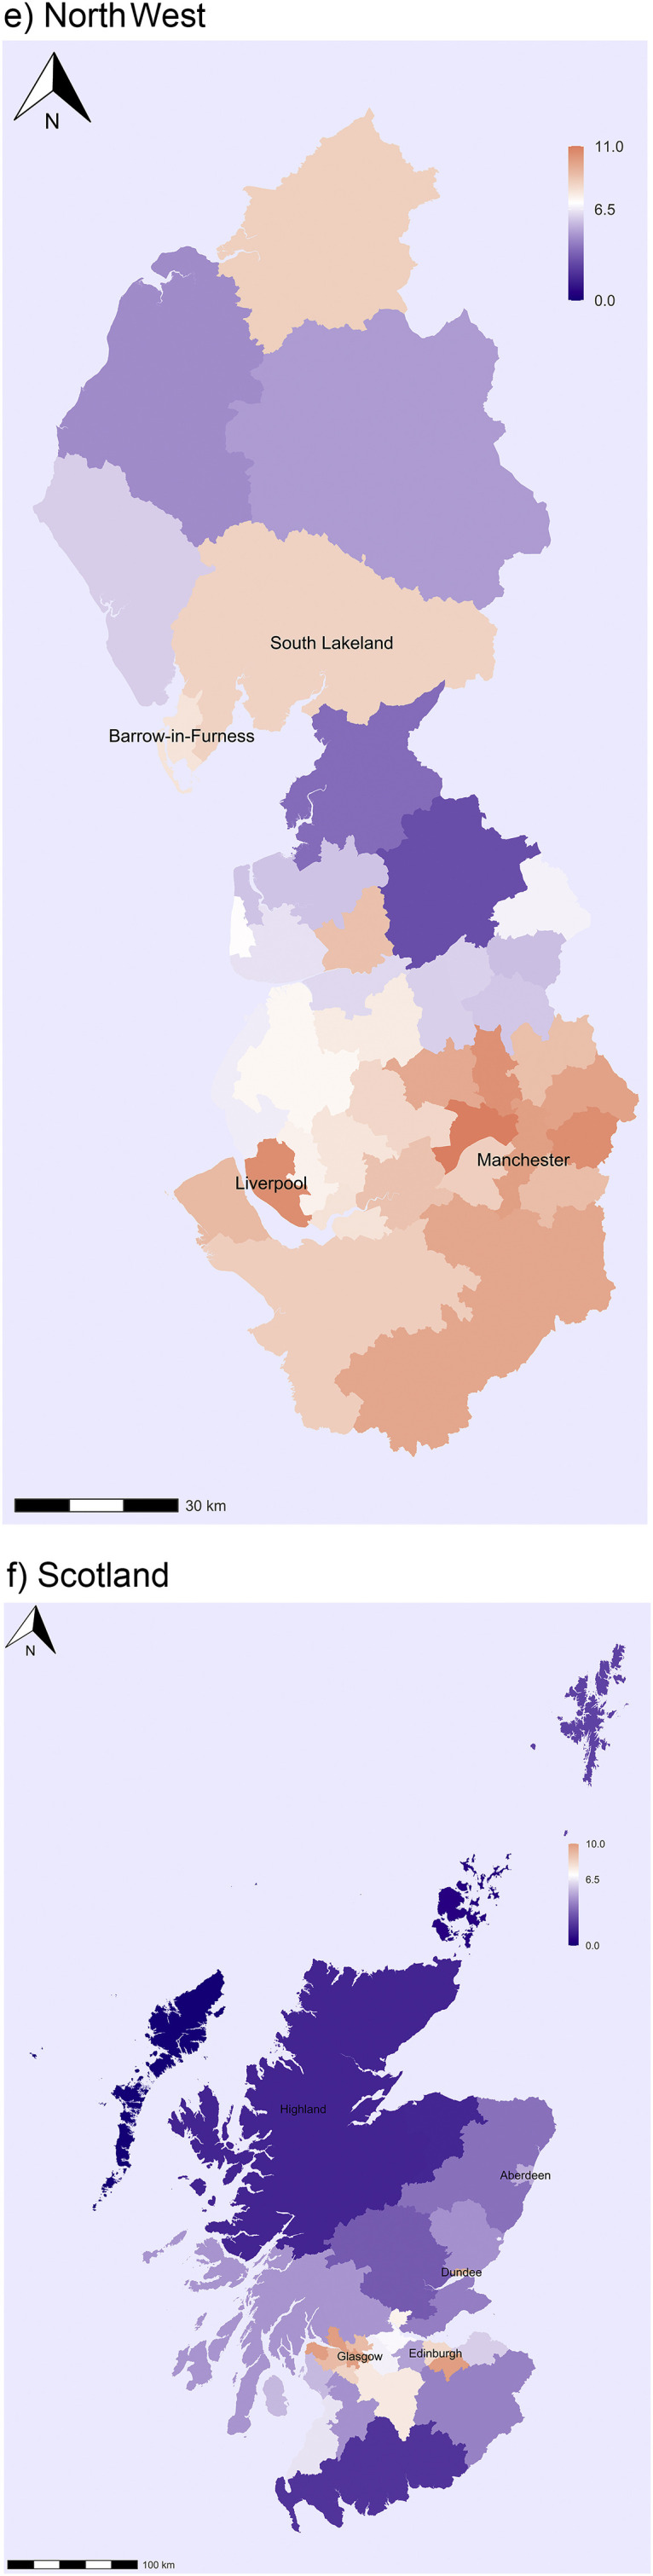
This study estimates cumulative infection rates from Covid-19 in Great Britain by local authority districts (LADs) and council areas (CAs) and investigates spatial patterns in infection rates. We propose a model-based approach to calculate cumulative infection rates from data on observed and expected deaths from Covid-19. Our analysis of mortality data shows that 7% of people in Great Britain were infected by Covid-19 by the last third of June 2020. It is unlikely that the infection rate was lower than 4% or higher than 15%. Secondly, England had higher infection rates than Scotland and especially Wales, although the differences between countries were not large. Thirdly, we observed a substantial variation in virus infection rates in Great Britain by geographical units. Estimated infection rates were highest in the capital city of London where between 11 and 12% of the population might have been infected and also in other major urban regions, while the lowest were in small towns and rural areas. Finally, spatial regression analysis showed that the virus infection rates increased with the increasing population density of the area and the level of deprivation. The results suggest that people from lower socioeconomic groups in urban areas (including those with minority backgrounds) were most affected by the spread of coronavirus from March to June.
Keywords: Covid-19; Infection rates; Infectious diseases; Mortality; Spatial analysis; Statistical modelling.
Copyright © 2020 Elsevier Ltd. All rights reserved.
Conflict of interest statement
HK and PD have nothing to declare.
Figures
Similar articles
-
Spatial patterns of COVID-19 and non-COVID-19 mortality across waves of infection in England, Wales, and Scotland.Soc Sci Med. 2023 Dec;338:116330. doi: 10.1016/j.socscimed.2023.116330. Epub 2023 Oct 17. Soc Sci Med. 2023. PMID: 37907058
-
Population mixing and sudden infant death syndrome in England and Wales.Int J Epidemiol. 1994 Jun;23(3):540-4. doi: 10.1093/ije/23.3.540. Int J Epidemiol. 1994. PMID: 7960379
-
Geographical inequalities in suicide rates and area deprivation in South Korea.J Ment Health Policy Econ. 2013 Sep;16(3):109-19. J Ment Health Policy Econ. 2013. PMID: 24327481
-
Why is mortality higher in Scotland than in England and Wales? Decreasing influence of socioeconomic deprivation between 1981 and 2001 supports the existence of a 'Scottish Effect'.J Public Health (Oxf). 2005 Jun;27(2):199-204. doi: 10.1093/pubmed/fdi002. Epub 2005 Mar 17. J Public Health (Oxf). 2005. PMID: 15774571
-
Increasing inequalities in premature mortality in Great Britain.J Epidemiol Community Health. 2004 Apr;58(4):296-302. doi: 10.1136/jech.2003.007278. J Epidemiol Community Health. 2004. PMID: 15026442 Free PMC article.
Cited by
-
Current Status of Putative Animal Sources of SARS-CoV-2 Infection in Humans: Wildlife, Domestic Animals and Pets.Microorganisms. 2021 Apr 17;9(4):868. doi: 10.3390/microorganisms9040868. Microorganisms. 2021. PMID: 33920724 Free PMC article. Review.
-
Evaluating the impacts of tiered restrictions introduced in England, during October and December 2020 on COVID-19 cases: a synthetic control study.BMJ Open. 2022 Apr 12;12(4):e054101. doi: 10.1136/bmjopen-2021-054101. BMJ Open. 2022. PMID: 35414548 Free PMC article.
-
The importance of saturating density dependence for population-level predictions of SARS-CoV-2 resurgence compared with density-independent or linearly density-dependent models, England, 23 March to 31 July 2020.Euro Surveill. 2021 Dec;26(49):2001809. doi: 10.2807/1560-7917.ES.2021.26.49.2001809. Euro Surveill. 2021. PMID: 34886944 Free PMC article.
-
What have we learned about socioeconomic inequalities in the spread of COVID-19? A systematic review.Sustain Cities Soc. 2022 Nov;86:104158. doi: 10.1016/j.scs.2022.104158. Epub 2022 Aug 31. Sustain Cities Soc. 2022. PMID: 36060423 Free PMC article.
-
Areas of enduring COVID-19 prevalence: drivers of prevalence and mitigating strategies.BMC Public Health. 2023 Jun 21;23(1):1203. doi: 10.1186/s12889-023-15723-7. BMC Public Health. 2023. PMID: 37344781 Free PMC article.
References
-
- Arnold JB. 2020. Extra Themes, Scales and Geoms for “Ggplot2” [R package ggthemes version 4.2.0].
-
- Bendavid E., Mulaney B., Sood N., Shah S., Ling E., Bromley-Dulfano R., et al. COVID-19 antibody seroprevalence in Santa Clara county, California. medRxiv. 2020 https://www.medrxiv.org/content/10.1101/2020.04.14.20062463v1?fbclid=IwA... 04.14.20062463. Available from. - DOI - PMC - PubMed
-
- Besag J. Spatial interaction and the statistical analysis of lattice systems. J R Stat Soc Ser B. 1974;36(2):192–225.
-
- Bohk-Ewald C., Dudel C., Myrskyla M. A demographic scaling model for estimating the total number of COVID-19 infections. medRxiv. 2020 https://www.medrxiv.org/content/10.1101/2020.04.23.20077719v2 Available from. - DOI - PMC - PubMed
Publication types
MeSH terms
LinkOut - more resources
Full Text Sources
Other Literature Sources
Medical
