. 2021 Jan 6;22(2):494.
doi: 10.3390/ijms22020494.

Annexin 1 Is a Component of eATP-Induced Cytosolic Calcium Elevation in Arabidopsis thaliana Roots

Affiliations

Annexin 1 Is a Component of eATP-Induced Cytosolic Calcium Elevation in Arabidopsis thaliana Roots

Amirah Mohammad-Sidik et al. Int J Mol Sci. .

Abstract

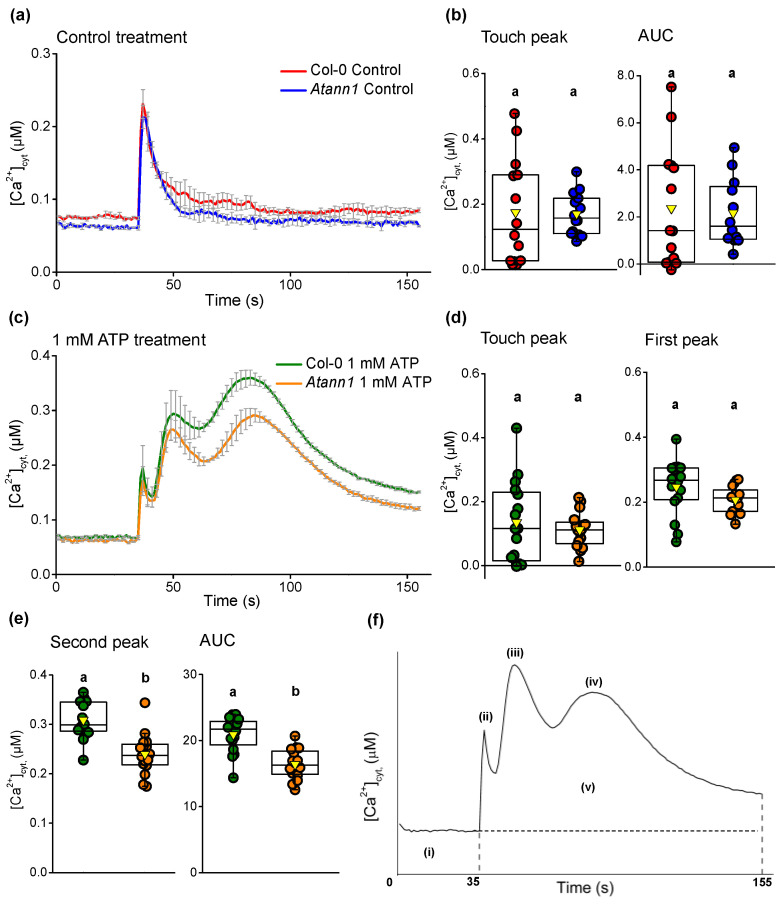
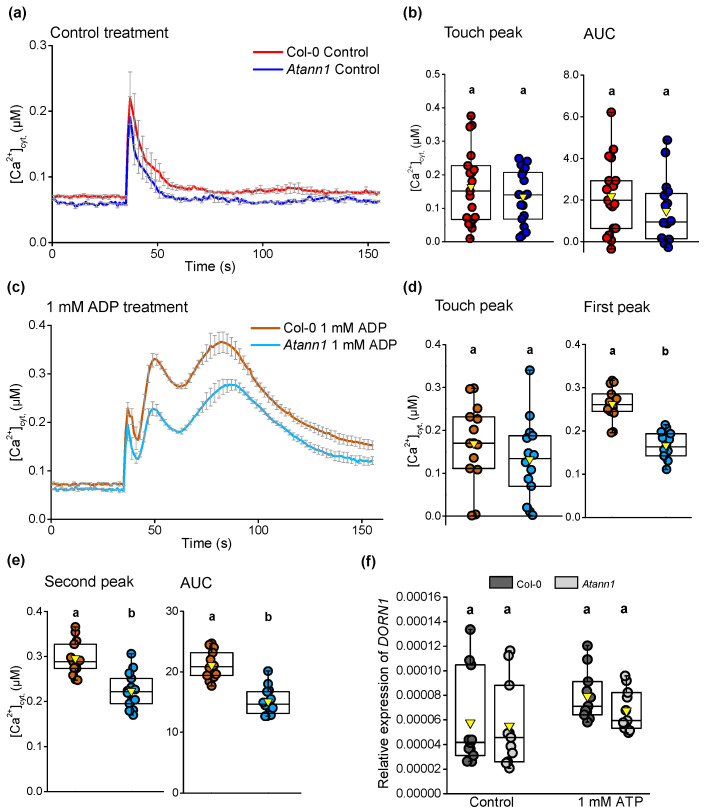
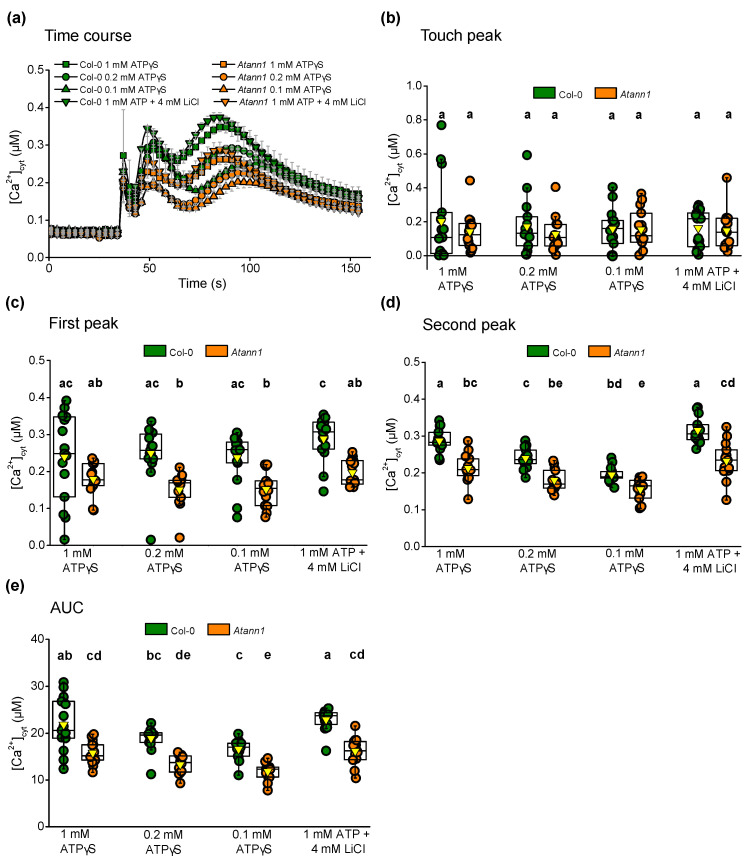
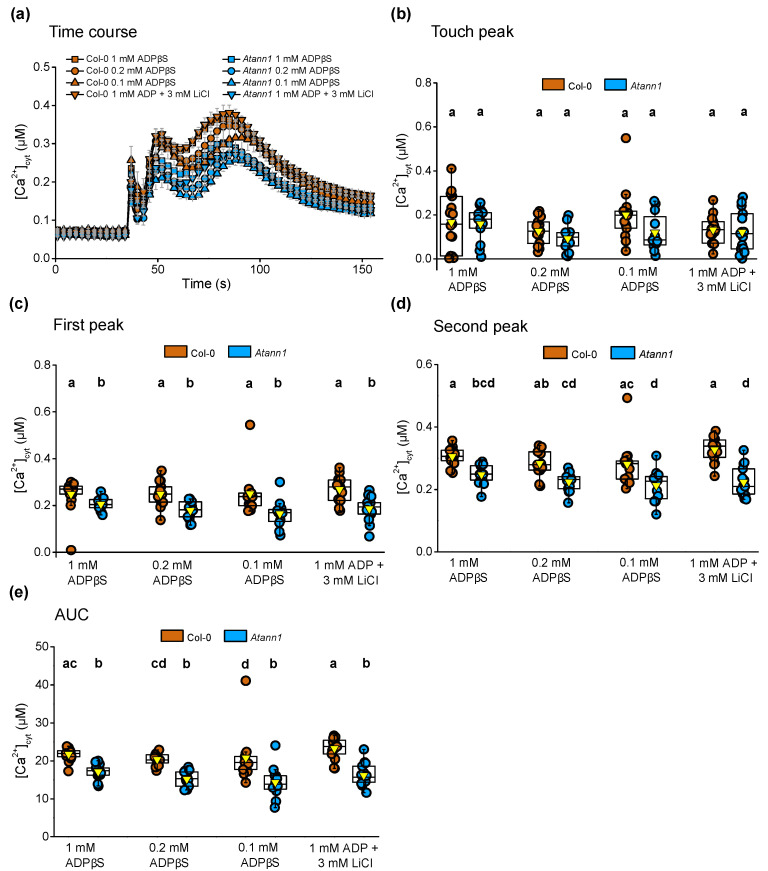
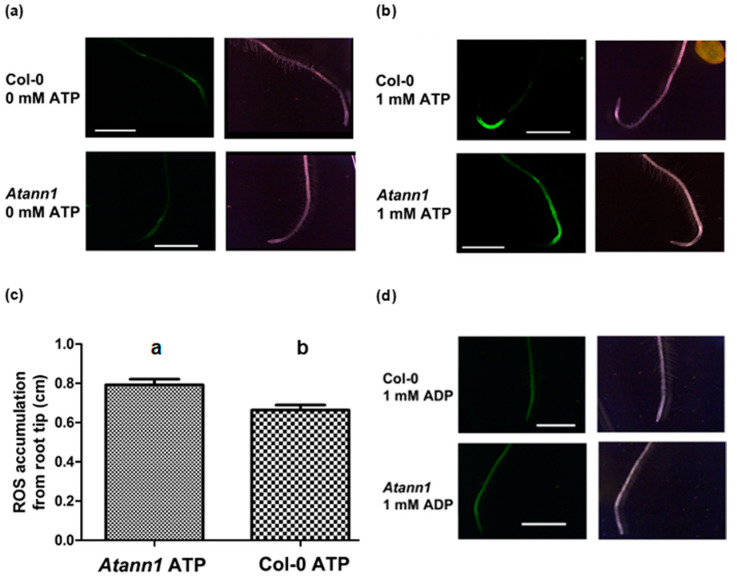
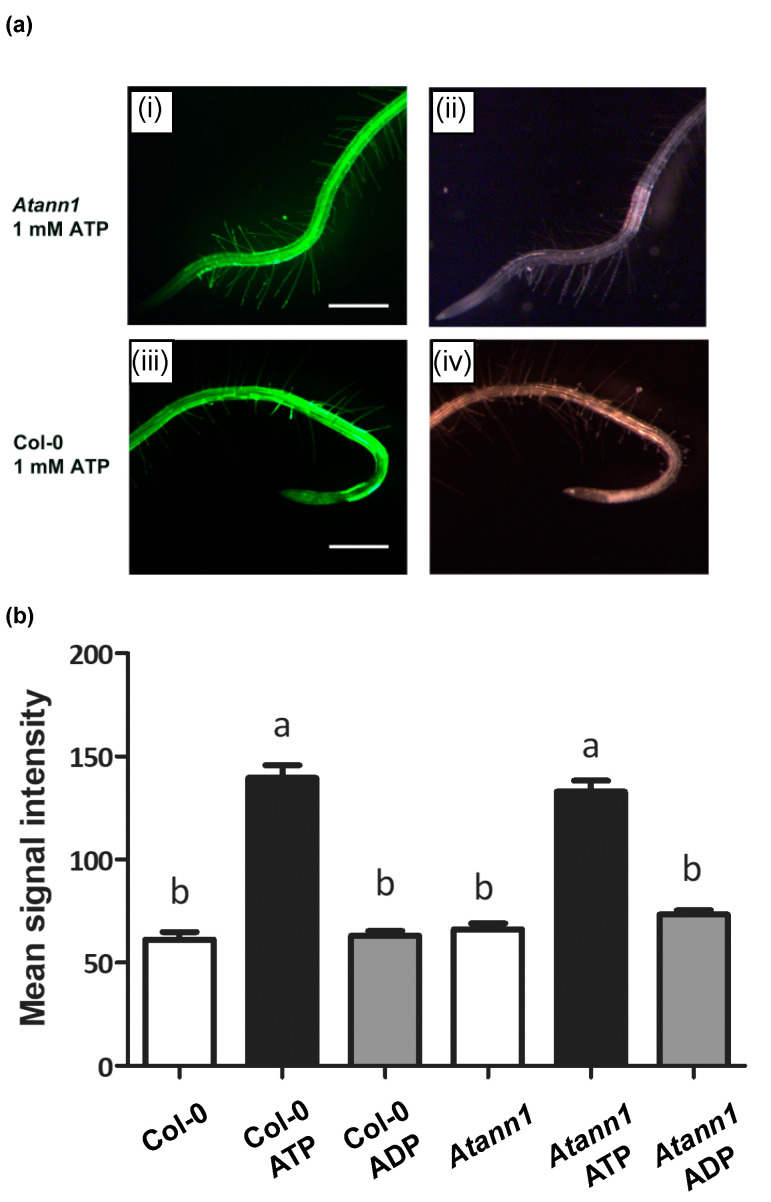
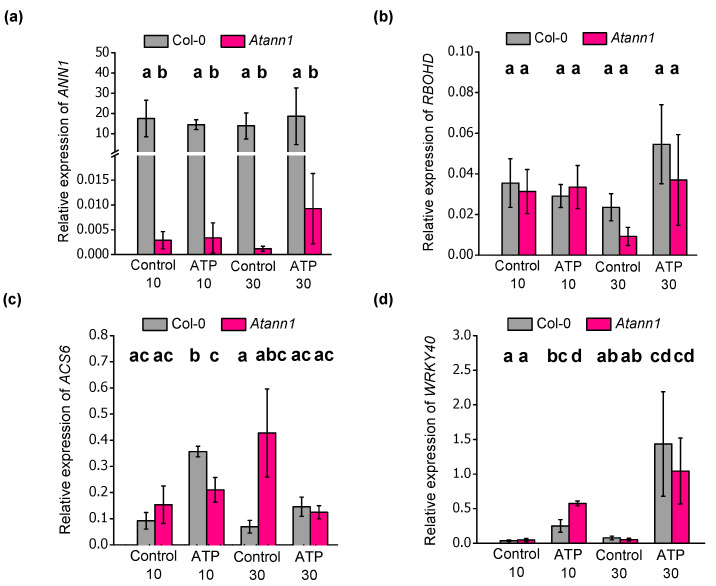
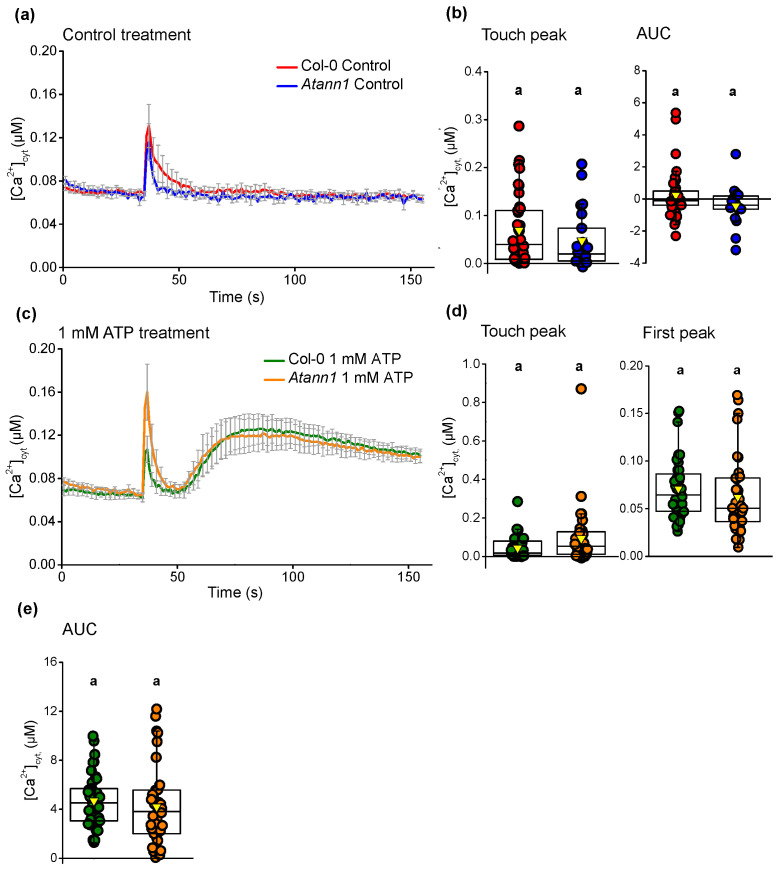
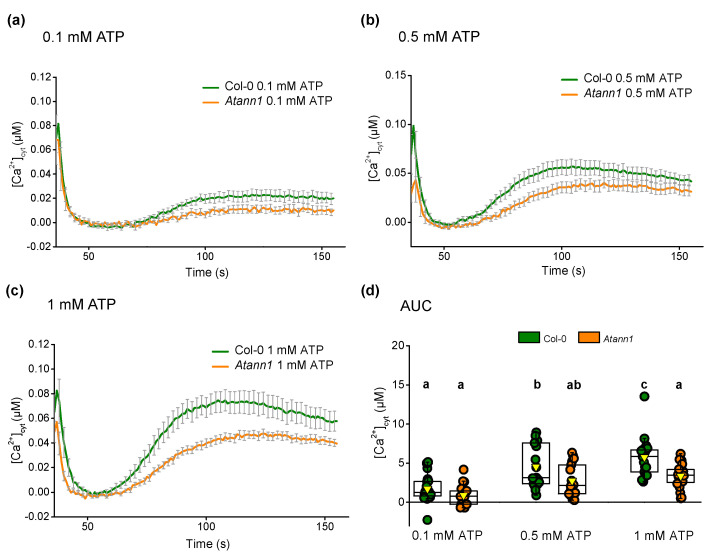
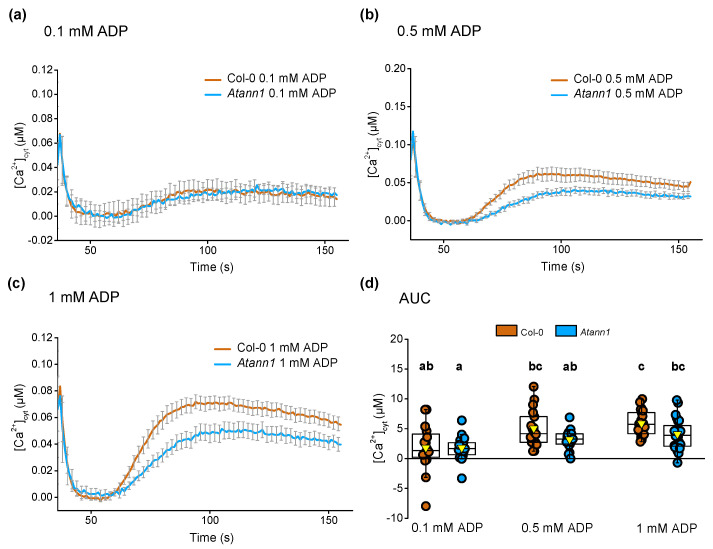
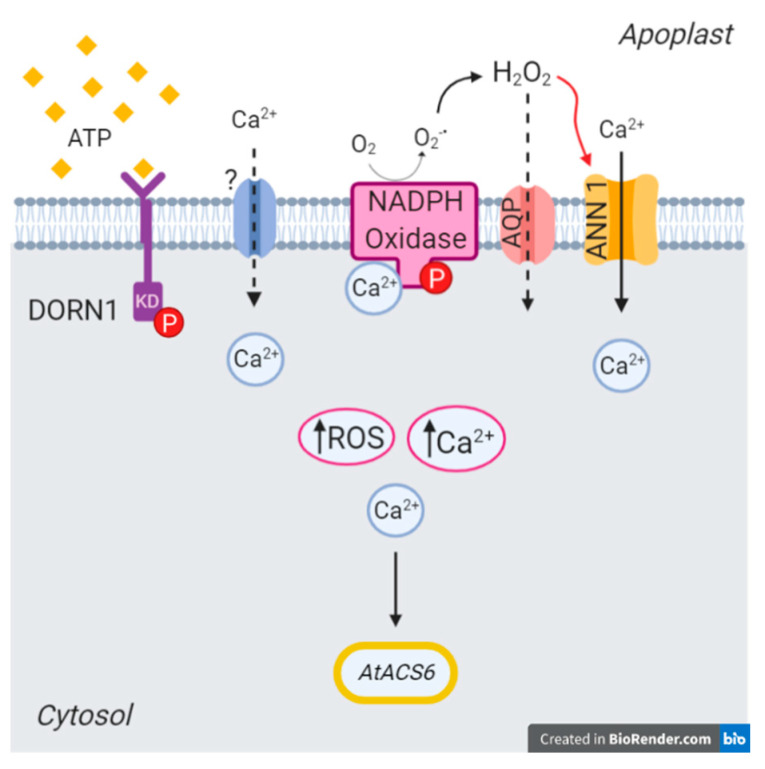
Extracellular ATP (eATP) has long been established in animals as an important signalling molecule but this is less understood in plants. The identification of Arabidopsis thaliana DORN1 (Does Not Respond to Nucleotides) as the first plant eATP receptor has shown that it is fundamental to the elevation of cytosolic free Ca2+ ([Ca2+]cyt) as a possible second messenger. eATP causes other downstream responses such as increase in reactive oxygen species (ROS) and nitric oxide, plus changes in gene expression. The plasma membrane Ca2+ influx channels involved in eATP-induced [Ca2+]cyt increase remain unknown at the genetic level. Arabidopsis thaliana Annexin 1 has been found to mediate ROS-activated Ca2+ influx in root epidermis, consistent with its operating as a transport pathway. In this study, the loss of function Annexin 1 mutant was found to have impaired [Ca2+]cyt elevation in roots in response to eATP or eADP. Additionally, this annexin was implicated in modulating eATP-induced intracellular ROS accumulation in roots as well as expression of eATP-responsive genes.

Keywords: ADP; Arabidopsis; annexin 1; calcium; calcium channel; extracellular ATP; reactive oxygen species; root.


Conflict of interest statement

The authors declare no conflict of interest.

Figures

Figure 1
Figure 1
Arabidopsis annexin 1 (AtANN1) is needed for normal [Ca2+]cyt elevation in a root by eATP. (a) Time course of [Ca2+]cyt elevation produced by control treatment in three experiments (mean (± SEM): Col-0 in red, n = 14 roots in total; Atann1 loss of function mutant in blue, n = 14). (b) The [Ca2+]cyt touch peak values and area under the curve (AUC) extracted from the control time course (± SEM). Middle line of the boxplot represents the median whereas the inverted triangle represents the mean. (c) Time course of [Ca2+]cyt elevation with 1 mM eATP treatment in 3 experiments (Col-0 in green, n = 16; Atann1 in orange, n = 16). (d) The touch peak and the first peak [Ca2+]cyt values extracted from the 1 mM eATP time course. (e) Second peak and the AUC [Ca2+]cyt values. (f) Schematic diagram of different time course sections. Each section was calculated with the average baseline value (indicated by (i)) subtracted. Touch peak (ii) was the highest [Ca2+]cyt value of the touch response between 35 and 40 s due to mechanical stimulus from solution addition at the 35th second. First peak (iii) and second peak (iv) were the highest [Ca2+]cyt value between 40 s and 60 s and 60 s and 155 s, respectively. Total [Ca2+]cyt accumulation was obtained from the AUC (v; 35 s–155 s). p-values were obtained from analysis of variance (ANOVA) with Tukey’s post-hoc test or Kruskal–Wallis test for non-parametric approaches. Different lower-case letters indicate a significant difference between means (p < 0.05).
Figure 2
Figure 2
AtANN1 is involved in eADP-induced [Ca2+]cyt elevation in the root. (a) Mean (± SEM) time course of [Ca2+]cyt increase by control treatment in three experiments (Col-0 in red, n = 19; Atann1 in blue, n = 18). (b) [Ca2+]cyt touch peak values and AUC extracted from the control time course. Middle line of the boxplot represents the median whereas the inverted triangle represents the mean. (c) Mean (± SEM) time course of [Ca2+]cyt increase by 1 mM eADP treatment obtained from three experiments (Col-0 in brown, n = 14; Atann1 in light blue, n = 14). (d) The touch peak and the first peak [Ca2+]cyt values from the 1 mM eADP time course. (e) Second peak and the total AUC [Ca2+]cyt values. (f) Quantification of AtDORN1 gene expression in Col-0 and Atann1 roots after seven days of growth on control medium or 1 mM eATP-containing medium (Col-0 in black, Atann1 in grey with n = 11 for each genotype and treatment) obtained from three experiments. p-values were obtained from ANOVA with Tukey’s post-hoc test. Different lower-case letters indicate a significant difference between means (p < 0.05).
Figure 3
Figure 3
AtANN1 is crucial for the first peak [Ca2+]cyt response at lower eATP concentration. (a) Mean (± SEM) [Ca2+]cyt time course in response to different concentrations of eATPγS or eATP with LiCl control from 3 experiments with n = 14–15 per genotype and treatment. (b) The [Ca2+]cyt touch peak values (± SEM), (c) first peak [Ca2+]cyt values (± SEM), (d) second peak [Ca2+]cyt values (± SEM) and (e) the total [Ca2+]cyt accumulated obtained from AUC (± SEM) for each concentration tested in both Col-0 and Atann1 extracted from the time course. p-values were obtained from ANOVA with Tukey’s post-hoc test or Kruskal-Wallis test for non-parametric approach. Different lower case letters indicate significant difference between means (p < 0.05).
Figure 4
Figure 4
AtANN1 is involved in the eADPβS-induced [Ca2+]cyt response at all concentrations tested. (a) Mean (± SEM) [Ca2+]cyt time course in response to different concentrations of eADPβS or ADP with LiCl control from 3 experiments (n = 13—15 per genotype and treatment). (b) The [Ca2+]cyt touch peak values (± SEM), (c) first peak [Ca2+]cyt values (± SEM), (d) second peak [Ca2+]cyt values (± SEM) and (e) the total [Ca2+]cyt accumulated obtained from AUC (± SEM) for each concentration tested in both Col-0 and Atann1 extracted from the time courses. p-values were obtained from ANOVA with Tukey’s post-hoc test or Kruskal-Wallis test for non-parametric approach. Different lower case letters indicate a significant difference between means (p < 0.05).
Figure 5
Figure 5
Atann1 supports a longer zone of intracellular ROS accumulation than Col-0 in response to eATP. (a) CM-H2DCFDA fluorescence from a Col-0 or Atann1 root under control conditions. Corresponding bright field images are also shown. (b) Roots after exposure to 1 mM eATP. (c) Mean (± SEM) length of root from the tip fluorescing after exposure to eATP (Col-0 n = 48; Atann1 n = 68; p = 0.0026, Student’s t-test). (d) Roots after exposure to 1 mM eADP. Scale bar = 4 mm. Different lower-case letters indicate a significant difference between means (p < 0.05).
Figure 6
Figure 6
eATP-induced intracellular ROS accumulation at the root apex at higher resolution. (a) CM-H2DCFDA fluorescence from (i) a representative Atann1 root exposed to 1 mM eATP and (ii) corresponding bright field image. (iii) A representative Col-0 root after exposure to 1 mM eATP and (iv) corresponding bright field image. (b) Mean (± SEM) of fluorescence pixel intensity at root apices under control conditions and after 30 s exposure to 1 mM eATP (Col-0 n = 48; Atann1 n = 68) or 1 mM ADP (Col-0 n = 32; Atann1 n = 38). Both genotypes responded significantly to eATP but not eADP (p < 0.001; ANOVA with Dunnett’s post-hoc test). Scale bar = 2 mm. Different lower-case letters indicate a significant difference between means (p < 0.05).
Figure 7
Figure 7
Transcriptional regulation of stress responsive genes by AtANN1. Col-0 and Atann1 whole roots were treated with control solution or 1 mM eATP for 10 or 30 min. Transcript abundance of (a) AtANN1, (b) AtRBOHD, (c) AtACS6 and (d) AtWRKY40 normalised to two housekeeping genes; AtUBQ10 and AtTUB4. Data were from the means (± SEM) of four independent trials. Student’s t-test and Welch’s t-test were used to test parametric data whereas Wilcoxon rank sum test was used for non-parametric data. Different lower-case letters indicate a significant difference between means (p < 0.05).
Figure 8
Figure 8
AtANN1 is not needed for eATP-induced [Ca2+]cyt increase in cotyledons. (a) Mean (± SEM) time course of [Ca2+]cyt increase due to control treatment of seven-day-old individual cotyledons. (b) The [Ca2+]cyt touch peak (± SEM) and the total [Ca2+]cyt accumulation by the AUC (± SEM). Middle line of the boxplot represents the median whereas the inverted triangle represents the mean. (c) Mean (± SEM) time course of [Ca2+]cyt increase due to 1 mM eATP treatment. (d) The [Ca2+]cyt touch peak values (± SEM) and the first peak values (± SEM). (e) Total [Ca2+]cyt accumulated values (± SEM) from the AUC. Data were obtained from four experiments with n = 21–39 cotyledons per genotype and treatment. p-values obtained from ANOVA with Tukey’s post-hoc test. Identical lower-case letters indicate an insignificant difference between means (p > 0.05).
Figure 9
Figure 9
AtANN1 is required for leaf [Ca2+]cyt elevation at higher concentrations of eATP. Mean (± SEM) [Ca2+]cyt time course (t = 36 s–155 s) of 14-day-old individual true leaves treated with (a) 0.1 mM eATP, (b) 0.5 mM eATP or (c) 1 mM eATP. (d) The total [Ca2+]cyt accumulated over the period of measurement for each concentration given as AUC. Data were obtained from four experiments with n = 17–22 per genotype and treatment. Middle line of the boxplot represents the median whereas the inverted triangle represents the mean. p-values were obtained from ANOVA with Tukey’s post-hoc test. Different lower-case letters indicate a significant difference between means (p < 0.05).
Figure 10
Figure 10
AtANN1 is not involved in mediating eADP-induced [Ca2+]cyt increase in leaves. Mean (± SEM) time course of [Ca2+]cyt increase (t = 36s–155s) when 14-day-old individual leaves were treated with (a) 0.1 mM eADP, (b) 0.5 mM eADP or (c) 1 mM eADP agonist. (d) The total [Ca2+]cyt accumulated over the period of measurement for each concentration by calculating the AUC. Data were obtained from four experiments (Col-0 n = 16–23; Atann1 n = 17–24). The middle line of the boxplot represents the median whereas the inverted triangle represents the mean. p-values were obtained from ANOVA with Tukey’s post-hoc test. Different lower-case letters indicate a significant difference between means (p < 0.05).
Figure 11
Figure 11
eATP perception by AtDORN1 at the root epidermal plasma membrane could be upstream of AtANN1 via production of extracellular ROS. Perception of eATP by AtDORN1 activates as yet unknown Ca2+ influx channels. AtDORN1 could phosphorylate an NADPH oxidase (AtRBOHC and AtRBOHD being the most likely candidates) with its kinase domain (KD) and the NADPH oxidase could also be activated by [Ca2+]cyt at its EF hands. This would result in production of extracellular hydroxyl radicals that could readily be converted to peroxide (H2O2) or hydroxyl radicals [26,27]. These could promote AtANN1-mediated Ca2+ influx. Peroxide could enter the cytosol through aquaporins (AQP) [54], which could account for eATP-induced intracellular ROS accumulation. The latter is the clearest point for the divergence between eATP and eADP pathways. Decoding of [Ca2+]cyt as a second messenger leads ultimately to a nuclear transcriptional response that can be impaired in Atann1. The position of AtP2K2 in such a pathway has yet to be tested. This original figure was created with BioRender.com.

Similar articles

Cited by

References

    1. Chivasa S., Ndimba B.K., Simon W.J., Lindsey K., Slabas A.R. Extracellular ATP functions as an endogenous external metabolite regulating plant cell viability. Plant Cell. 2005;17:3019–3034. doi: 10.1105/tpc.105.036806. - DOI - PMC - PubMed
    1. Clark G., Torres J., Herz N., Wat N., Ogoti J., Aranda G., Blizard M., Wu M., Onyirimba J., Canales A.A., et al. Both the stimulation and inhibition of root hair growth induced by extracellular nucleotides in Arabidopsis are mediated by nitric oxide and reactive oxygen species. Plant Mol. Biol. 2010;74:423–435. doi: 10.1007/s11103-010-9683-7. - DOI - PubMed
    1. Sun J., Zhang C.L., Deng S.R., Lu C.F., Shen X., Zhou X.Y., Zheng X.J., Hu Z.M., Chen S.L. An ATP signalling pathway in plant cells: Extracellular ATP triggers programmed cell death in Populus euphratica. Plant Cell Environ. 2012;35:893–916. doi: 10.1111/j.1365-3040.2011.02461.x. - DOI - PubMed
    1. Nizam S., Qiang X., Wawra S., Nostadt R., Getzke F., Schwanke F., Dreyer I., Langen G., Zuccaro A. Serendipita indica E5′NT modulates extracellular nucleotide levels in the plant apoplast and affects fungal colonization. EMBO Rep. 2019;20:e47430. doi: 10.15252/embr.201847430. - DOI - PMC - PubMed
    1. Matthus E., Sun J., Wang L., Bhat M.G., Sidik A.B.M., Davies J.M. DORN1/P2K1 and purino—Calcium signalling in plants; making waves with extracellular ATP. Ann. Bot. 2019;124:1227–1242. doi: 10.1093/aob/mcz135. - DOI - PMC - PubMed

MeSH terms

LinkOut - more resources