. 2021 Jan 6;22(2):492.
doi: 10.3390/ijms22020492.

Species-Specific and Distance-Dependent Dispersive Behaviour of Forisomes in Different Legume Species

Affiliations

Species-Specific and Distance-Dependent Dispersive Behaviour of Forisomes in Different Legume Species

Maria K Paulmann et al. Int J Mol Sci. .

Abstract

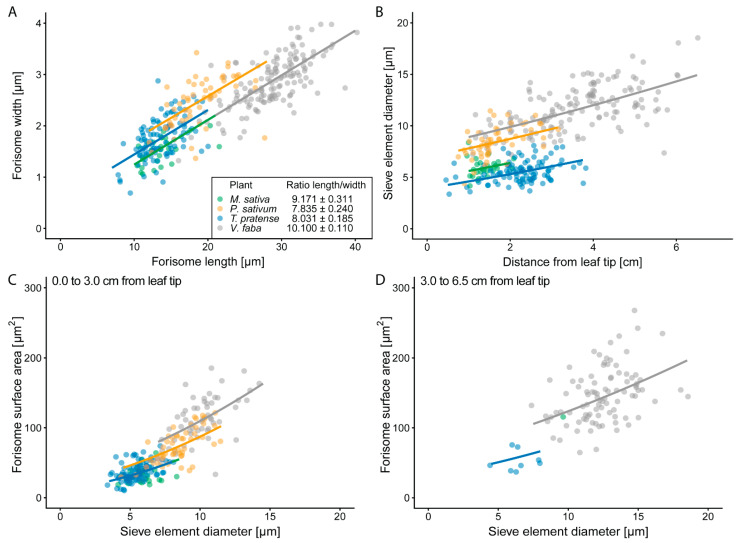
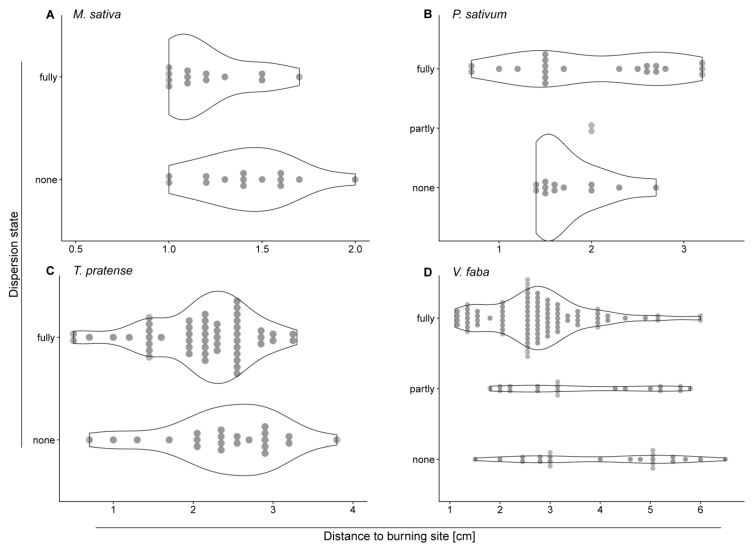
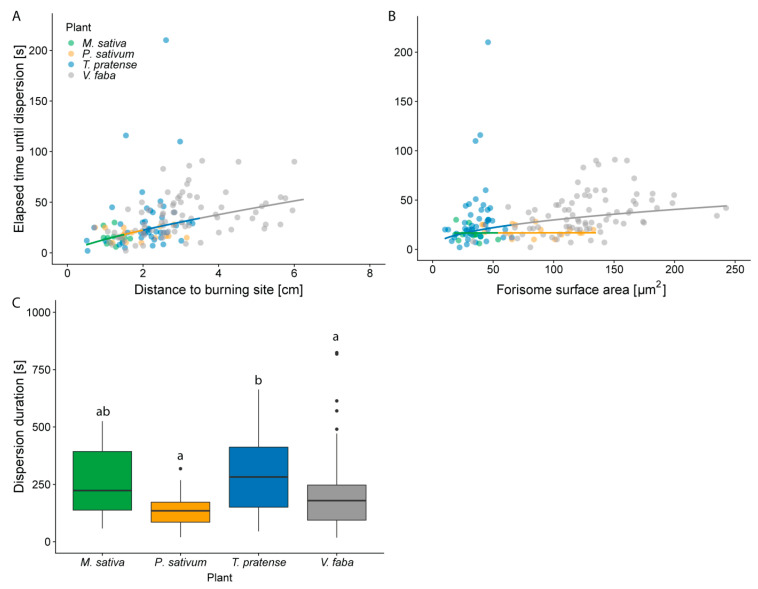
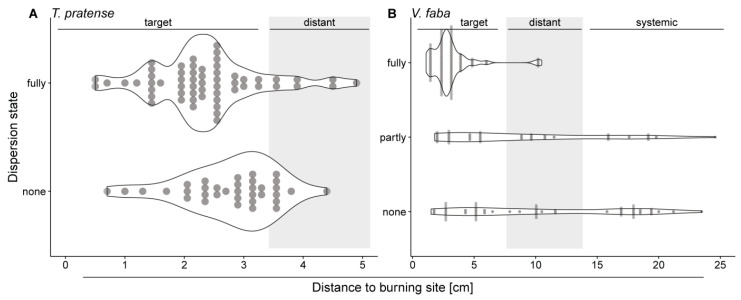
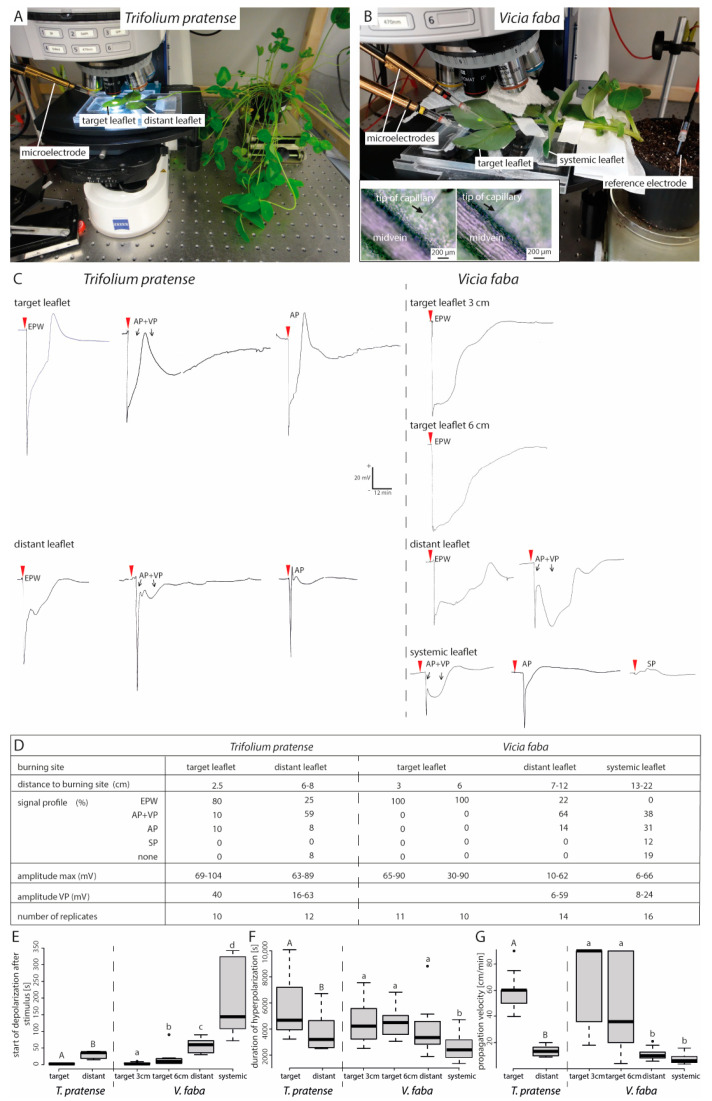
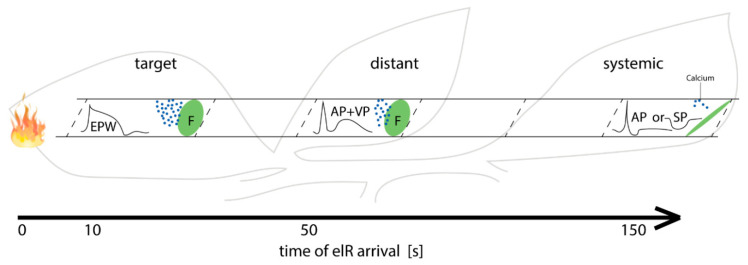
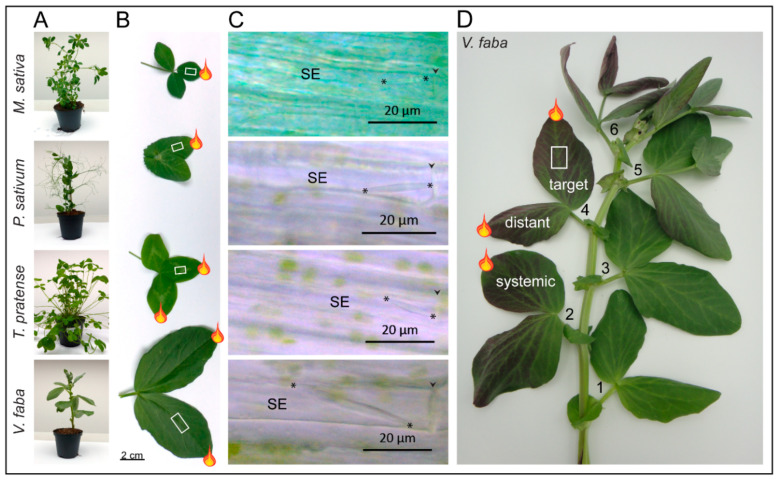
Forisomes are giant fusiform protein complexes composed of sieve element occlusion (SEO) protein monomers, exclusively found in sieve elements (SEs) of legumes. Forisomes block the phloem mass flow by a Ca2+-induced conformational change (swelling and rounding). We studied the forisome reactivity in four different legume species-Medicago sativa, Pisum sativum, Trifolium pratense and Vicia faba. Depending on the species, we found direct relationships between SE diameter, forisome surface area and distance from the leaf tip, all indicative of a developmentally tuned regulation of SE diameter and forisome size. Heat-induced forisome dispersion occurred later with increasing distance from the stimulus site. T. pratense and V. faba dispersion occurred faster for forisomes with a smaller surface area. Near the stimulus site, electro potential waves (EPWs)-overlapping action (APs), and variation potentials (VPs)-were linked with high full-dispersion rates of forisomes. Distance-associated reduction of forisome reactivity was assigned to the disintegration of EPWs into APs, VPs and system potentials (SPs). Overall, APs and SPs alone were unable to induce forisome dispersion and only VPs above a critical threshold were capable of inducing forisome reactions.

Keywords: Medicago sativa; Pisum sativum; Trifolium pratense; Vicia faba; electrophysiology; forisome; sieve-tube occlusion; systemic signalling.


Conflict of interest statement

The authors declare no conflict of interest. The funders had no role in the design of the study; in the collection, analyses, or interpretation of data; in the writing of the manuscript, or in the decision to publish the results.

Figures

Figure 1
Figure 1
Relationships between sieve element (SE) diameter and forisome dimensions or distance from the leaf tip. (A) The relation between forisome width and forisome length and (B) between SE diameter and the distance from the leaf tip (B) is shown for the investigated legume species. The inset in (A) shows the ratio of forisome length to forisome width ± standard error as a numerical presentation of the graphs. (C,D) The forisome surface area (AF) was calculated based on the forisome width and length and related to the SE diameter. For a better graphical presentation, the relation between forisome surface area and SE diameter is shown for forisomes (C) close to (until 3 cm) and (D) further away from the leaf tip (3 cm to 6.5 cm). Statistical values are shown in Table S1. Replicates from different plants are presented in: Green—M. sativa (n = 27), orange—P. sativum (n = 53), blue—T. pratense (n = 97), and grey—V. faba (n = 147).
Figure 2
Figure 2
Effect of the distance from the stimulus on the forisome dispersion state (fully, partly, none) in experiments on the target leaflet. Depicted are violin plots with their width adjusted to the number of forisomes observed in a given state of dispersion at a given distance (each forisome indicated by a filled circle). The number of replicates varied between the species: M. sativa (A) n = 28, P. sativum (B) n = 35, T. pratense (C) n = 73, V. faba (D) n = 133. Statistical values are shown in Table S2.
Figure 3
Figure 3
Influence of different parameters on the time lapse between heat stimulation and complete dispersion and on the dispersion time length. Only forisomes from experiments on the target leaflet were analysed. Both, (A) distance to the burning site and (B) the interaction of forisome surface area (AF) and species (B) have an effect on the time lapse between stimulus application and forisome dispersion. For easier visualization the results are shown in separate graphs. (C) Boxplot of the duration of dispersion associated with the species. Depicted are the median and the first and third percentile. Different letters indicate statistically significant differences. Statistical values are shown in Table S3. Replicates from different species (replicates for the time until dispersion; replicates for the duration of dispersion) are presented in different colours: green—M. sativa (n = 11; n = 11), orange—P. sativum (n = 16; n = 16), blue—T. pratense (n = 43; n = 36), and grey—V. faba (n = 77; n = 75).
Figure 4
Figure 4
Effect of increasing distance and internode intermissions on forisome dispersion (fully, partly, none) after a heat stimulus to T. pratense (A) and V. faba (B). The width of the violin plots is adjusted to the count of forisomes observed in a given state at a given distance (each forisome indicated by a filled circle). For T. pratense 115, for V. faba 184 forisomes were monitored. Statistical values are shown in the text.
Figure 5
Figure 5
Electrophysiological reactions in response to local, distant and systemic heat stimulation of V. faba and T. pratense leaf tips. (A,B) for extracellular, electrophysiological measurements the tip of a glass capillary was pierced into lower side of the midvein of a V. faba or T. pratense target leaflet under microscopical surveillance to ensure a correct placement (see inset B). (C) Typical recordings of electrophysiological reactions at the target leaflet are shown for stimulation of target, distant and systemic leaflets. Scale bar in (C) is valid for all measurements. (DG) Parameters of the recorded electrophysiological reactions in the respective leaflets are arranged side by side. (E) represents the start of the depolarization after the stimulus, (F) the duration of the depolarization and (G) the propagation velocity. Statistical values are shown in Tables S4 and S5. Different letters indicate significant differences. AP—action potential, VP—variation potential, SP—system potential, EPW—electropotential wave.
Figure 6
Figure 6
Schematic drawing of the events in target, distant and systemic leaflets after burning. In target leaflet the burning stimulus induces an electropotential wave (EPW = AP + VP) that results in the gating of Ca2+ -specific channels and therefore in forisome (F) dispersion. With increasing distance, different propagation velocities separate the recordings of AP and VP, while the VP-induced depolarization is reduced. In systemic leaflets the VP is completely lost and only the AP or SP can be detected, probably since too few Ca2+ ions are mobilized.
Figure 7
Figure 7
Overview of the plant species and experimental set-up. (A) Specimens of M. sativa, P. sativum, T. pratense and V. faba plants in use. The species possess compound leaves of various size and morphology (twin or triplet leaflets). (B) True to scale comparison of the respective leaves. The stimulated leaflets are labelled with a flame, the observation site is labelled with a white rectangle. (C) Micrographs of forisomes in the four legume species. Asterisks (*) indicate the forisome tips; arrow heads mark the location of a sieve plate. SE—Sieve element. (D) Detached V. faba plant stained with ink. One single incised stem section containing a major vascular bundle was submerged into an ink solution to illustrate the connectivity between leaves no. 2, 4 and 6. Mature leaves were numbered from oldest to youngest and leaf no. 4 was always used to cut the observation window (white rectangle). Flames indicate the different application sites of the heat stimulus.

Similar articles

Cited by

References

    1. Sukhov V., Sukhova E., Vodeneev V. Long-distance electrical signals as a link between the local action of stressors and the systemic physiological responses in higher plants. Prog. Biophys. Mol. Biol. 2019;146:63–84. doi: 10.1016/j.pbiomolbio.2018.11.009. - DOI - PubMed
    1. Benning U.F., Tamot B., Guelette B.S., Hoffmann-Benning S. New aspects of phloem-mediated long-distance lipid signaling in plants. Front. Plant Sci. 2012;3:53. doi: 10.3389/fpls.2012.00053. - DOI - PMC - PubMed
    1. Lacombe B., Achard P. Long-distance transport of phytohormones through the plant vascular system. Curr. Opin. Plant Biol. 2016;34:1–8. doi: 10.1016/j.pbi.2016.06.007. - DOI - PubMed
    1. Van Bel A.J.E., Furch A.C.U., Hafke J.B., Knoblauch M., Patrick J.W. (Questions)n on phloem biology. 2. Mass flow, molecular hopping, distribution patterns and macromolecular signalling. Plant Sci. 2011;181:325–330. doi: 10.1016/j.plantsci.2011.05.008. - DOI - PubMed
    1. Van Bel A.J.E., Musetti R. Sieve element biology provides leads for research on phytoplasma lifestyle in plant hosts. J. Exp. Bot. 2019;70:3737–3755. doi: 10.1093/jxb/erz172. - DOI - PubMed

LinkOut - more resources