

Down-Regulation of Claudin-2 Expression by Cyanidin-3-Glucoside Enhances Sensitivity to Anticancer Drugs in the Spheroid of Human Lung Adenocarcinoma A549 Cells
- PMID: 33419064
- PMCID: PMC7825397
- DOI: 10.3390/ijms22020499
Down-Regulation of Claudin-2 Expression by Cyanidin-3-Glucoside Enhances Sensitivity to Anticancer Drugs in the Spheroid of Human Lung Adenocarcinoma A549 Cells
Abstract
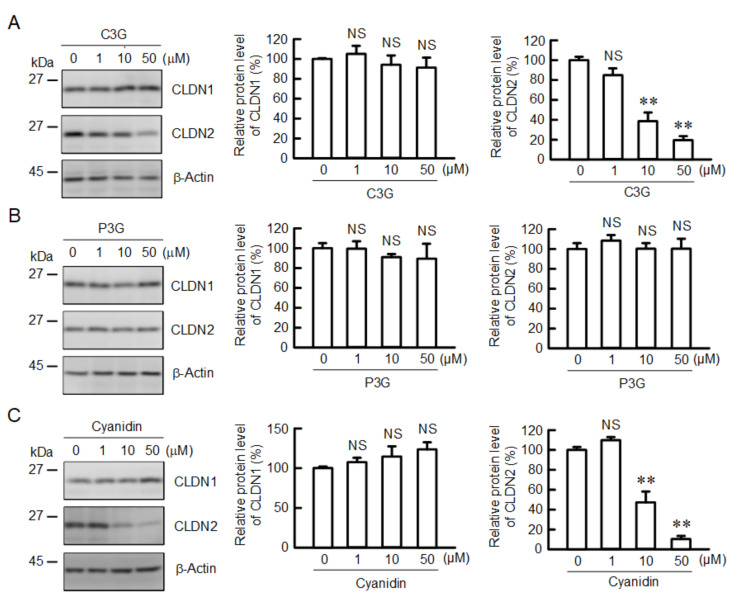
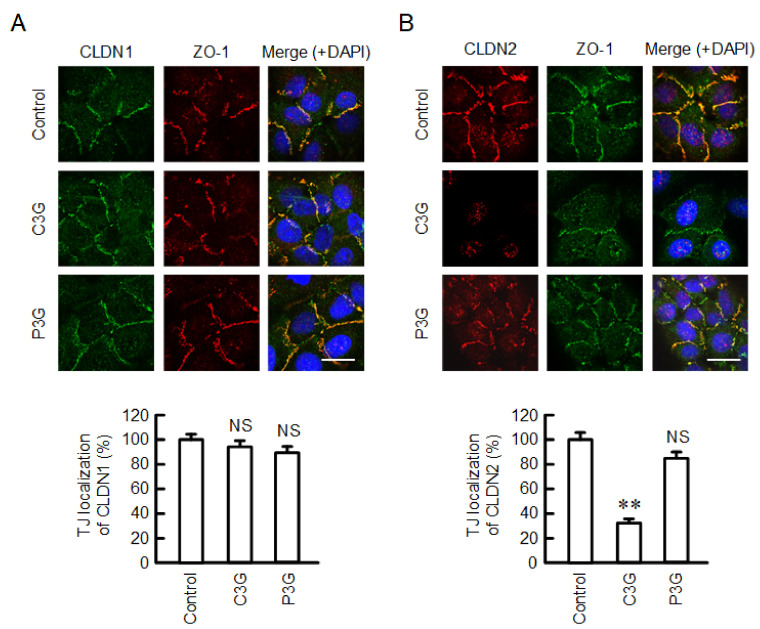
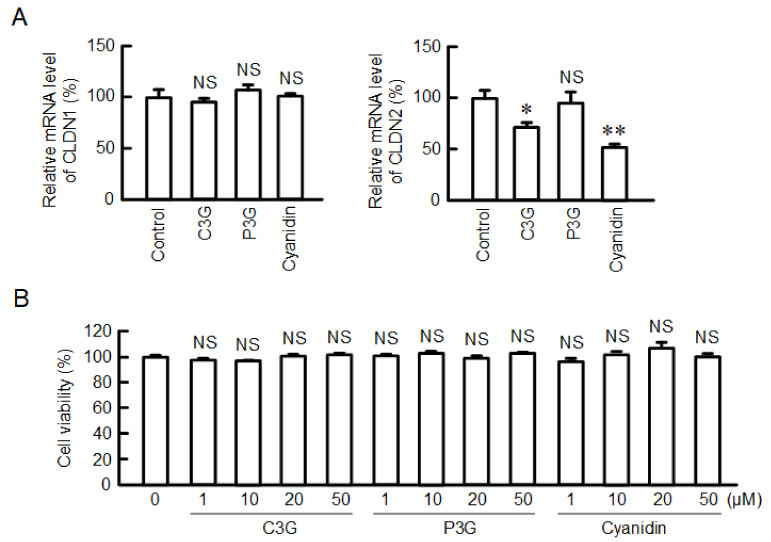
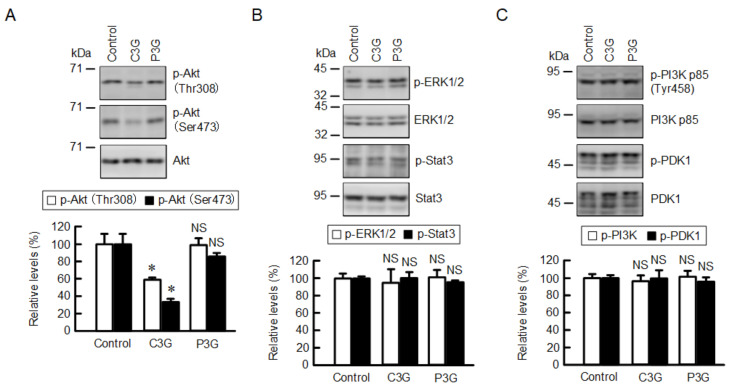
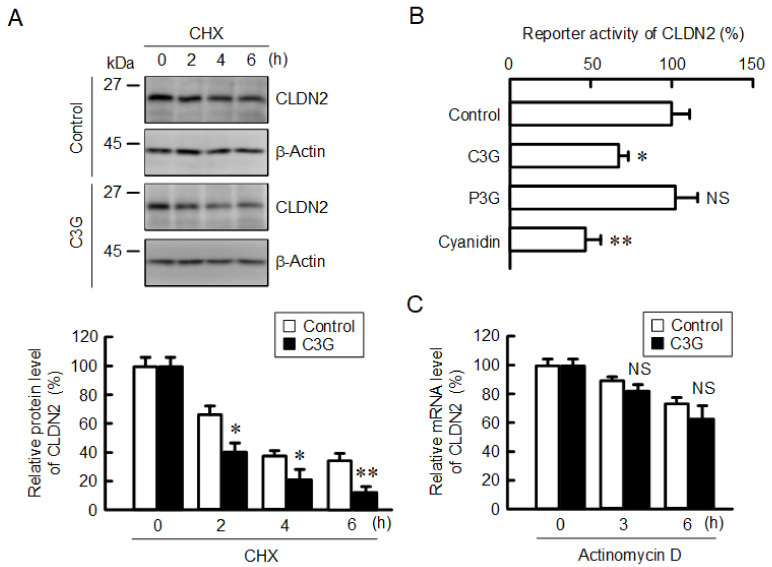
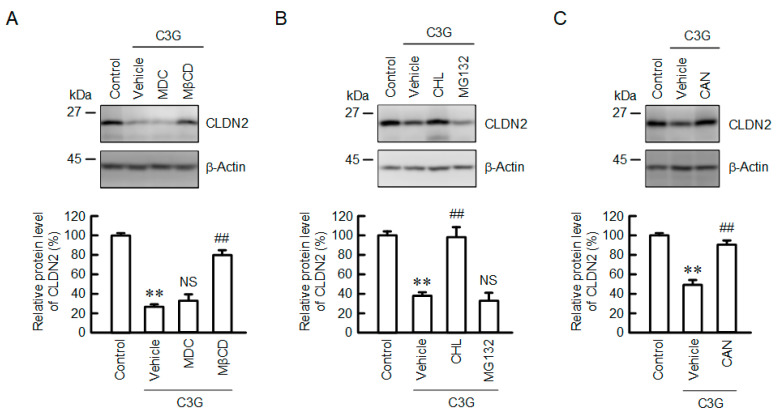
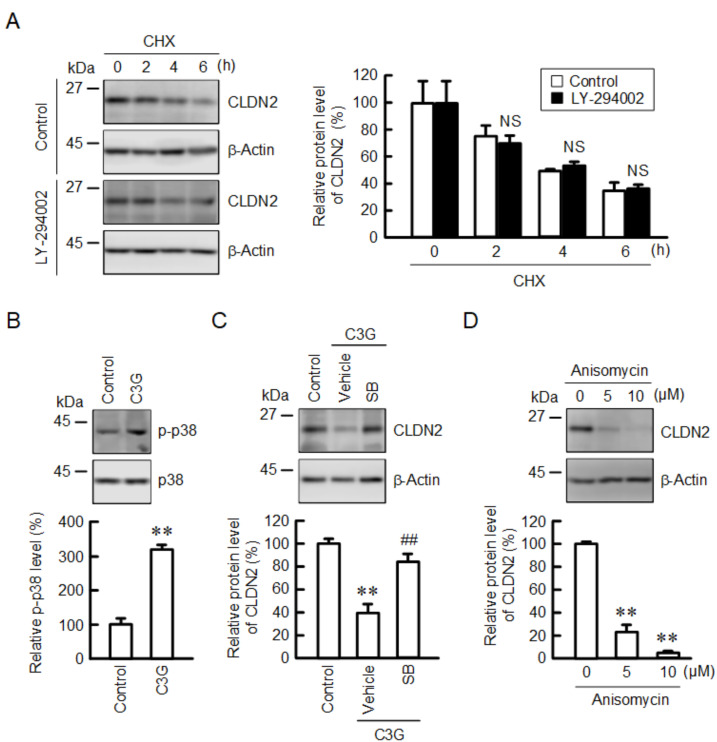
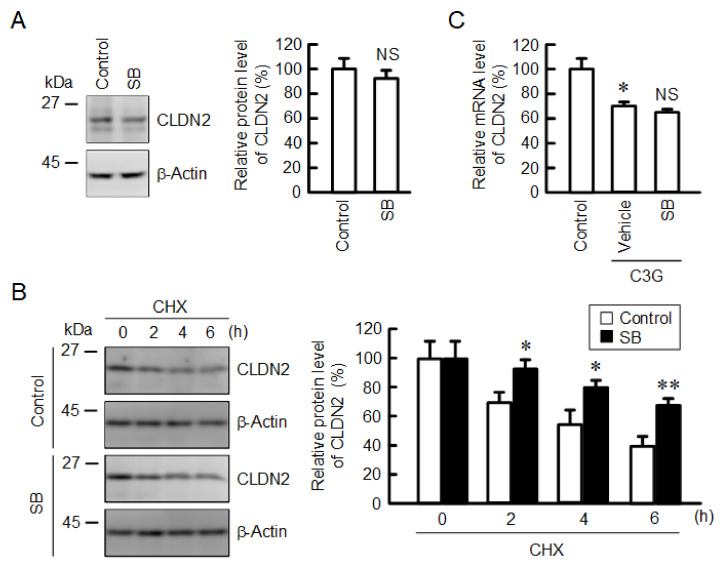
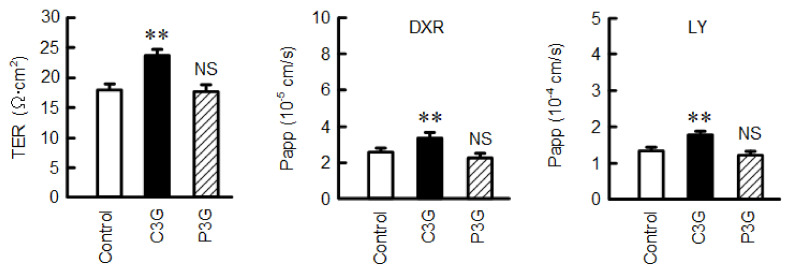
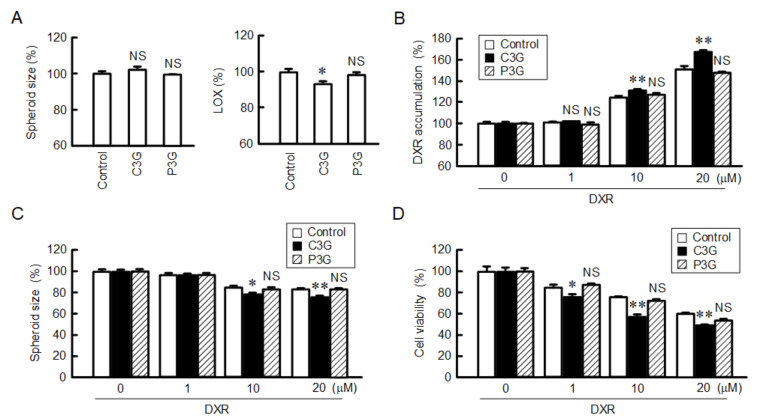
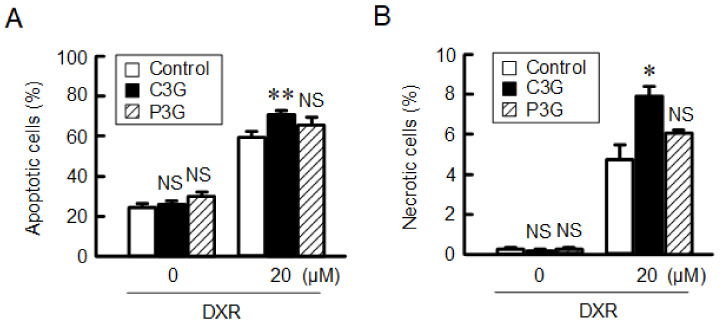
Claudin-2 (CLDN2), an integral membrane protein located at tight junctions, is abnormally expressed in human lung adenocarcinoma tissues, and is linked to drug resistance in human lung adenocarcinoma A549 cells. CLDN2 may be a target for the prevention of lung adenocarcinoma, but there are few compounds which can reduce CLDN2 expression. We found that cyanidin-3-glucoside (C3G), the anthocyanin with two hydroxyl groups on the B-ring, and cyanidin significantly reduce the protein level of CLDN2 in A549 cells. In contrast, pelargonidin-3-glucoside (P3G), the anthocyanin with one hydroxyl group on the B-ring, had no effect. These results suggest that cyanidin and the hydroxyl group at the 3-position on the B-ring play an important role in the reduction of CLDN2 expression. The phosphorylation of Akt, an activator of CLDN2 expression at the transcriptional level, was inhibited by C3G, but not by P3G. The endocytosis and lysosomal degradation are suggested to be involved in the C3G-induced decrease in CLDN2 protein expression. C3G increased the phosphorylation of p38 and the p38 inhibitor SB203580 rescued the C3G-induced decrease in CLDN2 expression. In addition, SB203580 rescued the protein stability of CLDN2. C3G may reduce CLDN2 expression at the transcriptional and post-translational steps mediated by inhibiting Akt and activating p38, respectively. C3G enhanced the accumulation and cytotoxicity of doxorubicin (DXR) in the spheroid models. The percentages of apoptotic and necrotic cells induced by DXR were increased by C3G. Our data suggest that C3G-rich foods can prevent the chemoresistance of lung adenocarcinoma A549 cells through the reduction of CLDN2 expression.
Keywords: chemosensitivity; claudin-2; cyanidin-3-glucoside; lung adenocarcinoma.
Conflict of interest statement
The authors declare that they have no conflicts of interest. The funders had no role in the design of the study; in the collection, analyses, or interpretation of data; in the writing of the manuscript, or in the decision to publish the results.
Figures
Similar articles
-
Kaempferide Enhances Chemosensitivity of Human Lung Adenocarcinoma A549 Cells Mediated by the Decrease in Phosphorylation of Akt and Claudin-2 Expression.Nutrients. 2020 Apr 23;12(4):1190. doi: 10.3390/nu12041190. Nutrients. 2020. PMID: 32340376 Free PMC article.
-
Claudin-2 binding peptides, VPDSM and DSMKF, down-regulate claudin-2 expression and anticancer resistance in human lung adenocarcinoma A549 cells.Biochim Biophys Acta Mol Cell Res. 2020 Apr;1867(4):118642. doi: 10.1016/j.bbamcr.2019.118642. Epub 2020 Jan 7. Biochim Biophys Acta Mol Cell Res. 2020. PMID: 31923533
-
Elevation of Anticancer Drug Toxicity by Caffeine in Spheroid Model of Human Lung Adenocarcinoma A549 Cells Mediated by Reduction in Claudin-2 and Nrf2 Expression.Int J Mol Sci. 2022 Dec 7;23(24):15447. doi: 10.3390/ijms232415447. Int J Mol Sci. 2022. PMID: 36555089 Free PMC article.
-
A Review of the Role of an Anthocyanin, Cyanidin-3-O-β-glucoside in Obesity-Related Complications.Plants (Basel). 2023 Nov 17;12(22):3889. doi: 10.3390/plants12223889. Plants (Basel). 2023. PMID: 38005786 Free PMC article. Review.
-
Cyanidin-3-O-glucoside as a Nutrigenomic Factor in Type 2 Diabetes and Its Prominent Impact on Health.Int J Mol Sci. 2023 Jun 5;24(11):9765. doi: 10.3390/ijms24119765. Int J Mol Sci. 2023. PMID: 37298715 Free PMC article. Review.
Cited by
-
Expression of Claudin-9 (CLDN9) in Breast Cancer, the Clinical Significance in Connection with Its Subcoat Anchorage Proteins ZO-1 and ZO-3 and Impact on Drug Resistance.Biomedicines. 2023 Nov 24;11(12):3136. doi: 10.3390/biomedicines11123136. Biomedicines. 2023. PMID: 38137355 Free PMC article.
-
A dual role of fibroblast-epithelial crosstalk in acute and chronic lung injury.J Biol Chem. 2025 Jun 26;301(8):110408. doi: 10.1016/j.jbc.2025.110408. Online ahead of print. J Biol Chem. 2025. PMID: 40581116 Free PMC article.
-
Advances in Dietary Phenolic Compounds to Improve Chemosensitivity of Anticancer Drugs.Cancers (Basel). 2022 Sep 21;14(19):4573. doi: 10.3390/cancers14194573. Cancers (Basel). 2022. PMID: 36230494 Free PMC article. Review.
-
Identification of claudin-2 as a promising biomarker for early diagnosis of pre-diabetes.Front Pharmacol. 2024 Feb 15;15:1370708. doi: 10.3389/fphar.2024.1370708. eCollection 2024. Front Pharmacol. 2024. PMID: 38425650 Free PMC article.
-
Insights into the Mechanisms of Action of Proanthocyanidins and Anthocyanins in the Treatment of Nicotine-Induced Non-Small Cell Lung Cancer.Int J Mol Sci. 2022 Jul 18;23(14):7905. doi: 10.3390/ijms23147905. Int J Mol Sci. 2022. PMID: 35887251 Free PMC article. Review.
References
-
- Olivas-Aguirre F.J., Rodrigo-García J., Martínez-Ruiz N.D.R., Cárdenas-Robles A.I., Mendoza-Díaz S.O., Alvarez-Parrilla E., Gonzalez-Aguilar G.A., De la Rosa L.A., Ramos-Jimenez A., Wall-Medrano A. Cyanidin-3-O-glucoside: Physical-chemistry, foodomics and health effects. Molecules. 2016;21:1264. doi: 10.3390/molecules21091264. - DOI - PMC - PubMed
-
- Fornasaro S., Ziberna L., Gasperotti M., Tramer F., Vrhovšek U., Mattivi F., Passamonti S. Determination of cyanidin 3-glucoside in rat brain, liver and kidneys by UPLC/MS-MS and its application to a short-term pharmacokinetic study. Sci. Rep. 2016;6:22815. doi: 10.1038/srep22815. - DOI - PMC - PubMed
-
- Matsukawa T., Inaguma T., Han J., Villareal M.O., Isoda H. Cyanidin-3-glucoside derived from black soybeans ameliorate type 2 diabetes through the induction of differentiation of preadipocytes into smaller and insulin-sensitive adipocytes. J. Nutr. Biochem. 2015;26:860–867. doi: 10.1016/j.jnutbio.2015.03.006. - DOI - PubMed
MeSH terms
Substances
Grants and funding
LinkOut - more resources
Full Text Sources
Other Literature Sources
Research Materials
