. 2021 Jan 6;10(1):83.
doi: 10.3390/cells10010083.

Keap1-Nrf2 Pathway Regulates ALDH and Contributes to Radioresistance in Breast Cancer Stem Cells

Affiliations

Keap1-Nrf2 Pathway Regulates ALDH and Contributes to Radioresistance in Breast Cancer Stem Cells

Dinisha Kamble et al. Cells. .

Abstract

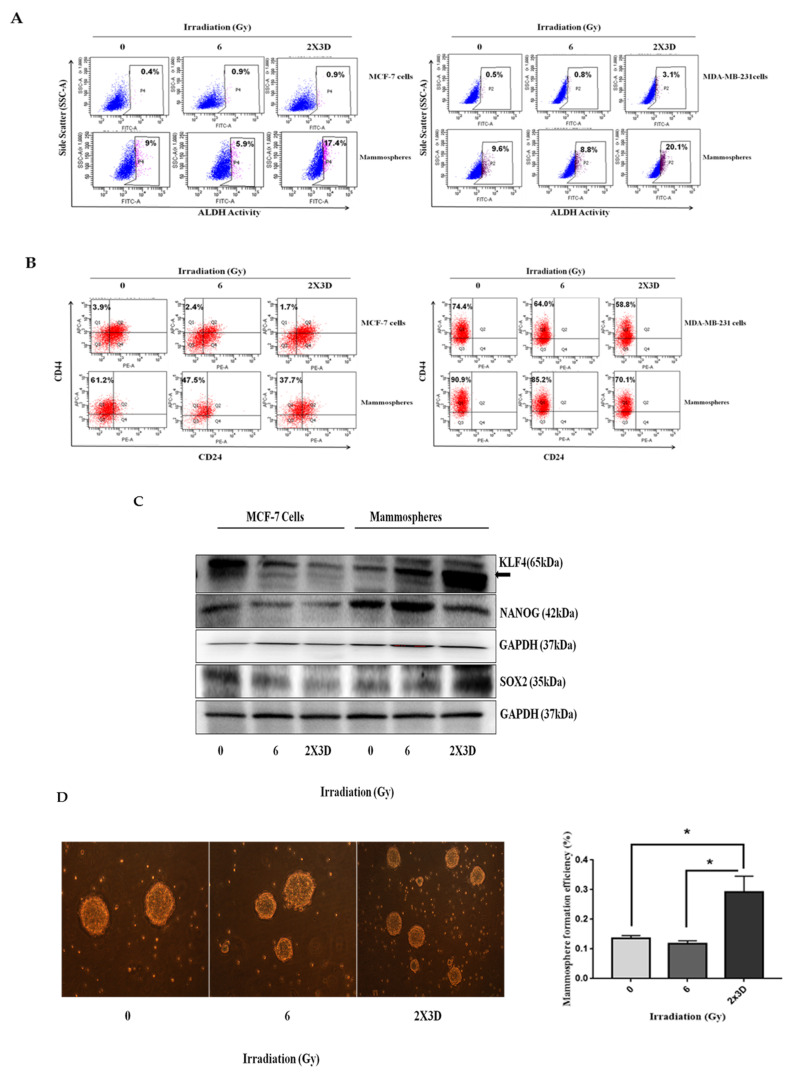
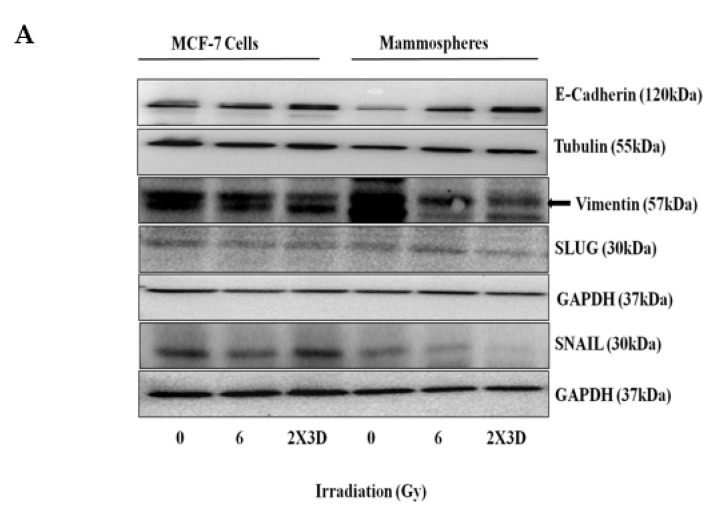
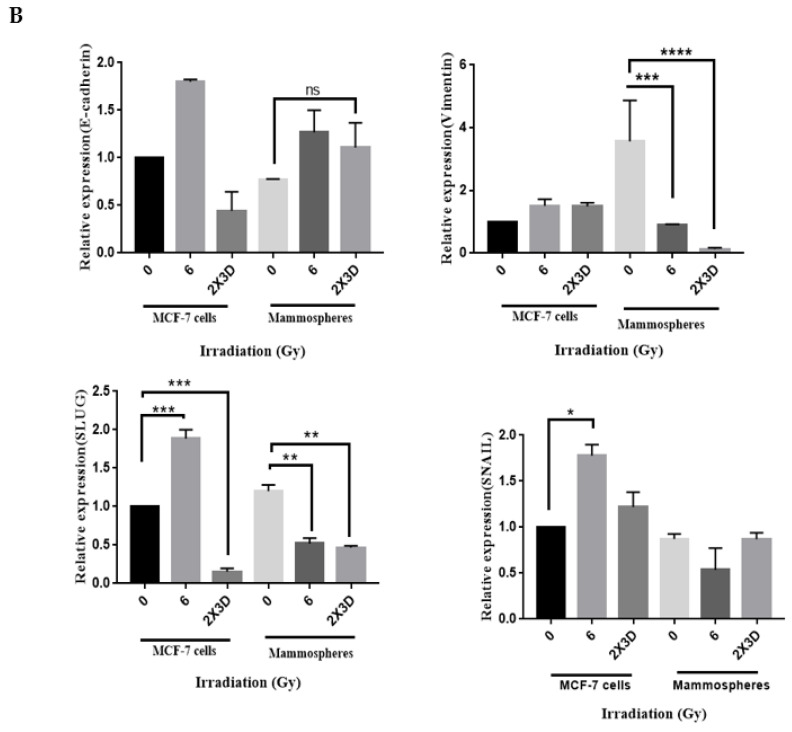
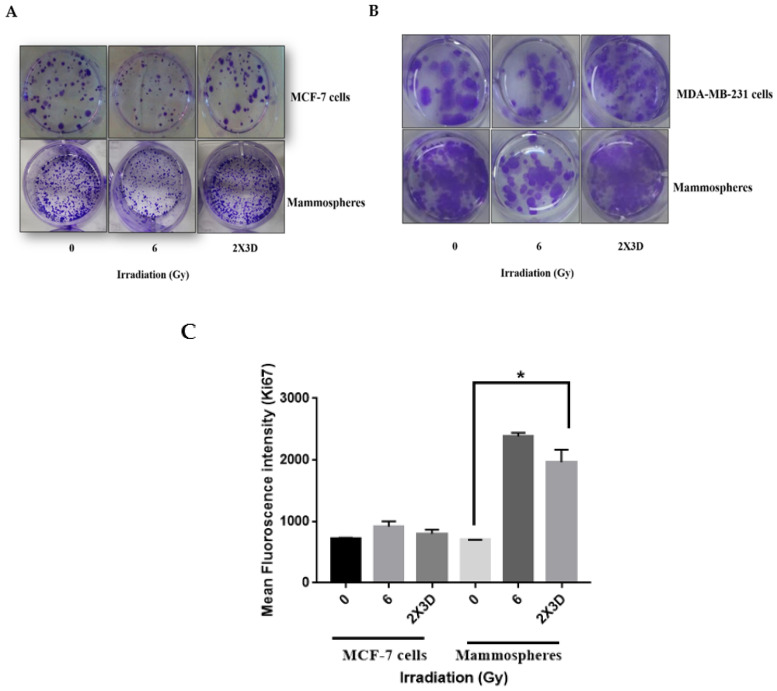
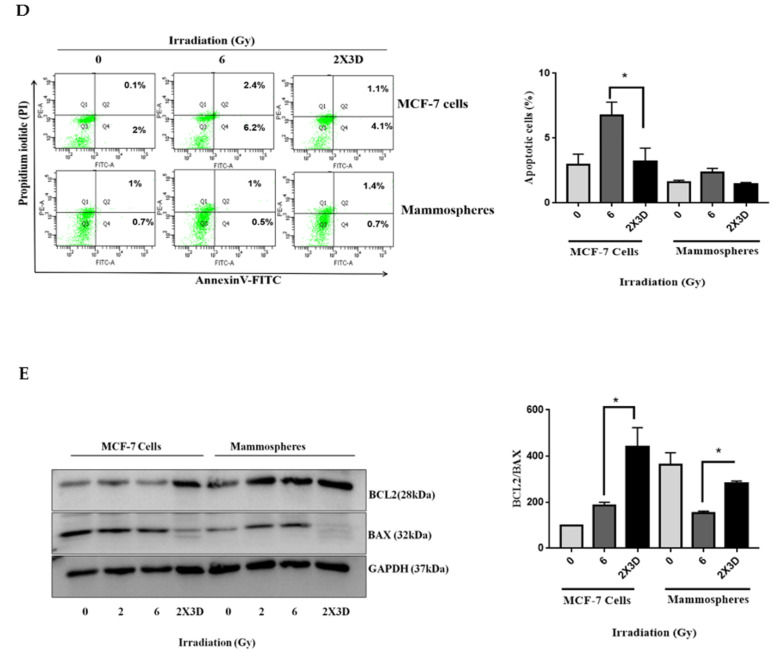
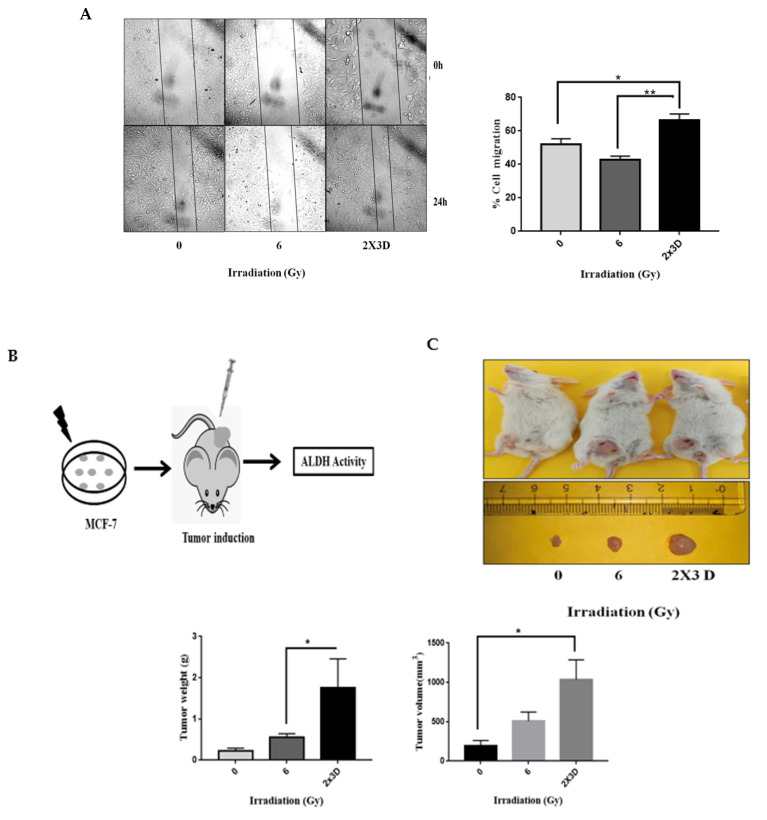
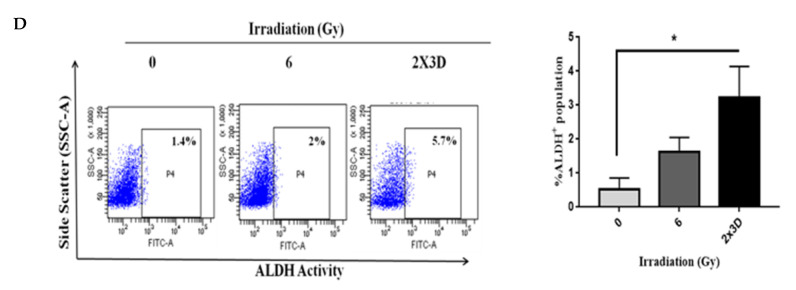
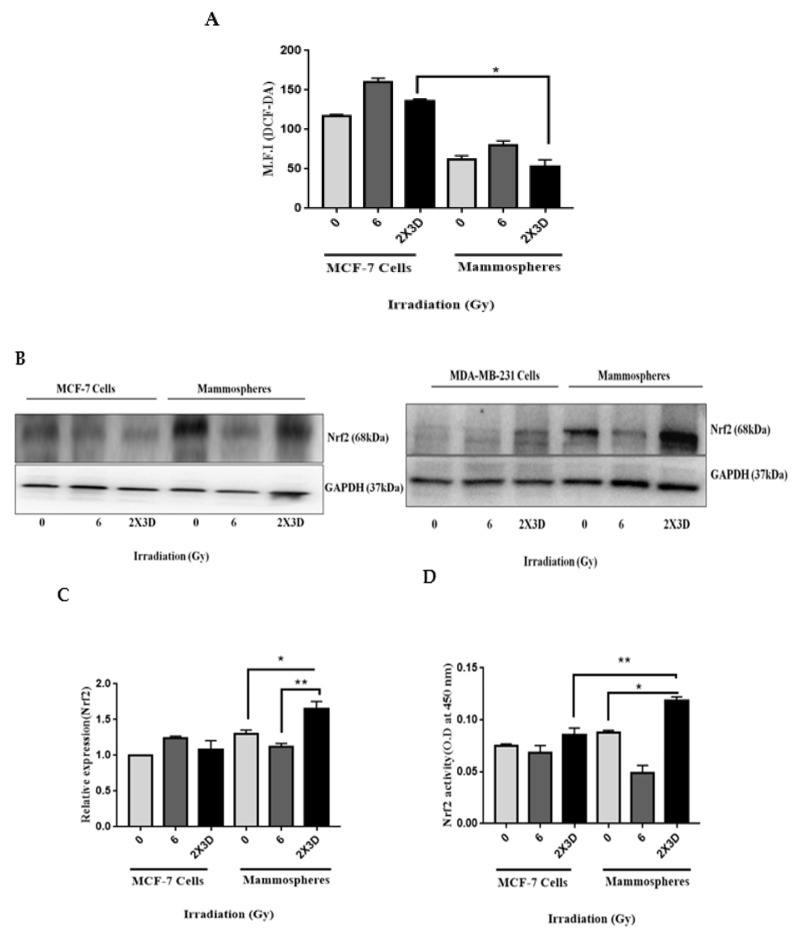
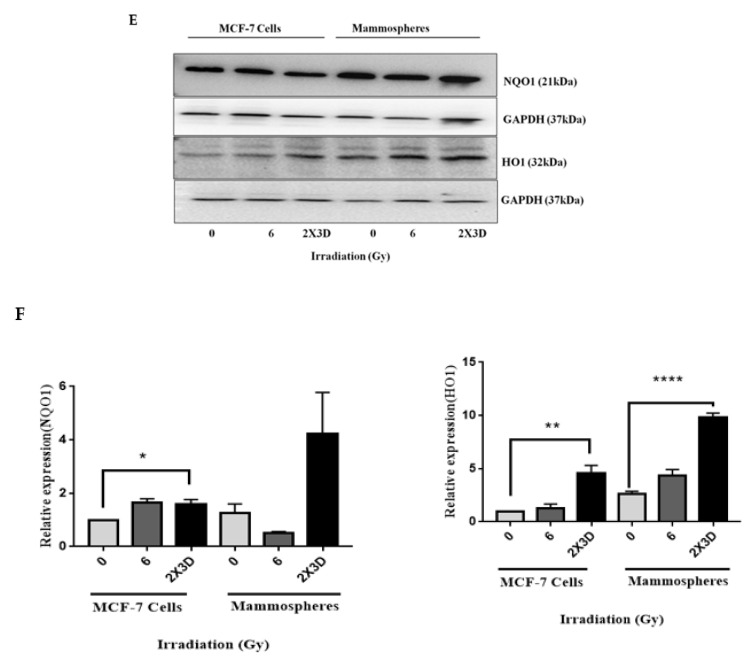
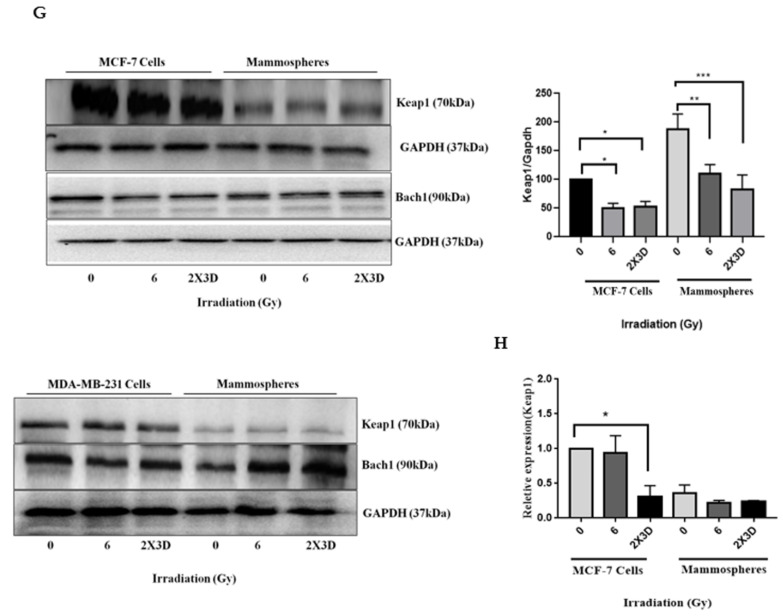
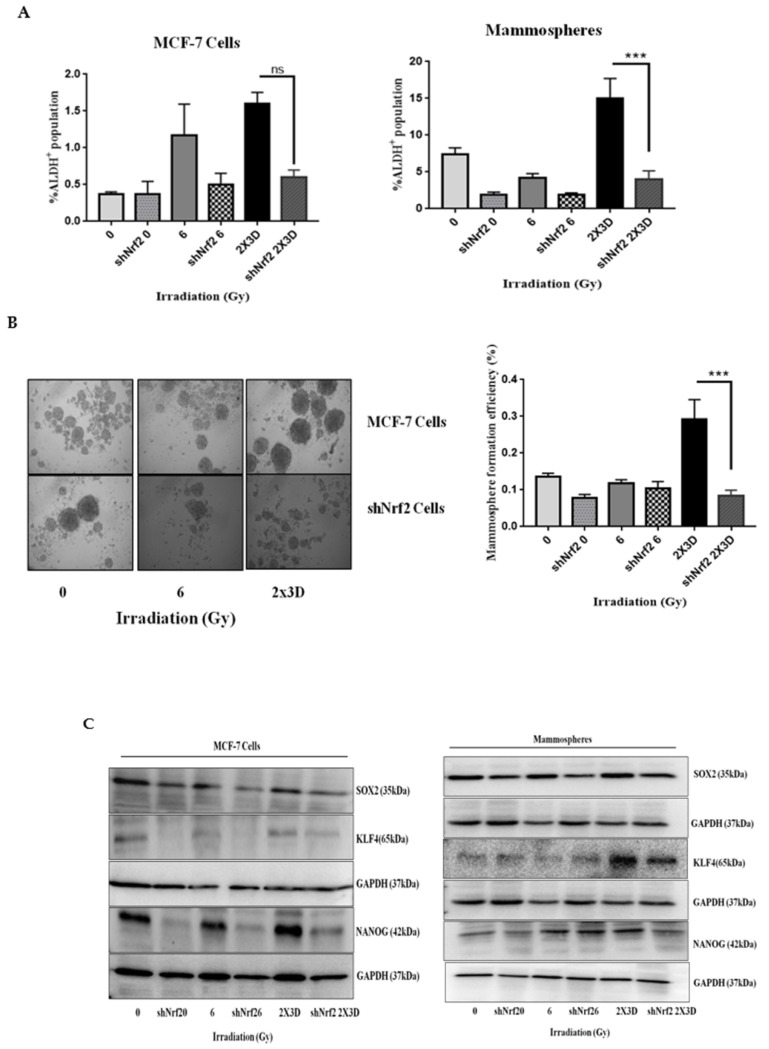
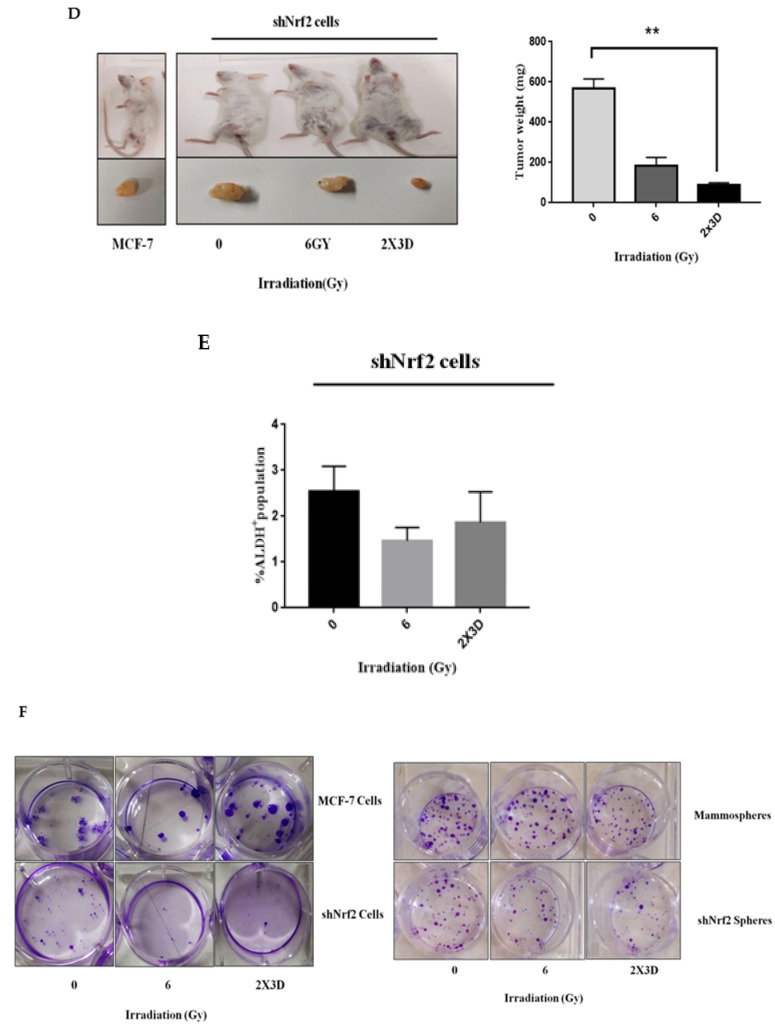
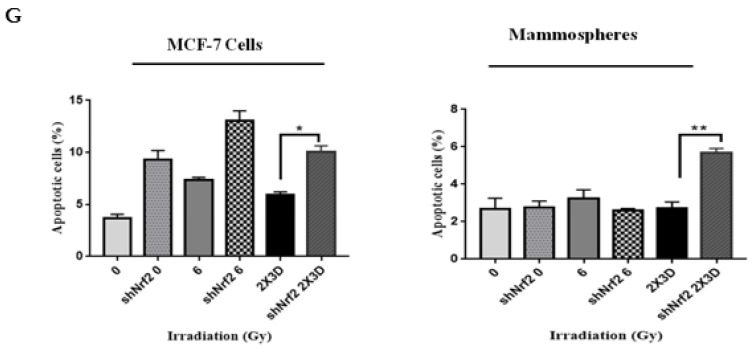
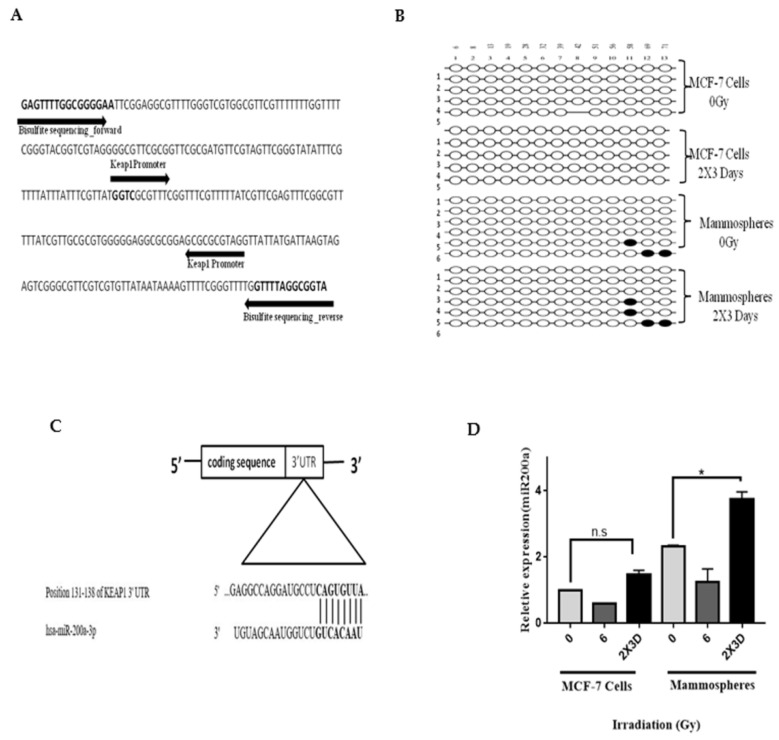
Tumor recurrence after radiotherapy due to the presence of breast cancer stem cells (BCSCs) is a clinical challenge, and the mechanism remains unclear. Low levels of ROS and enhanced antioxidant defenses are shown to contribute to increasing radioresistance. However, the role of Nrf2-Keap1-Bach1 signaling in the radioresistance of BCSCs remains elusive. Fractionated radiation increased the percentage of the ALDH-expressing subpopulation and their sphere formation ability, promoted mesenchymal-to-epithelial transition and enhanced radioresistance in BCSCs. Radiation activated Nrf2 via Keap1 silencing and enhanced the tumor-initiating capability of BCSCs. Furthermore, knockdown of Nrf2 suppressed ALDH+ population and stem cell markers, reduced radioresistance by decreasing clonogenicity and blocked the tumorigenic ability in immunocompromised mice. An underlying mechanism of Keap1 silencing could be via miR200a, as we observed a significant increase in its expression, and the promoter methylation of Keap1 or GSK-3β did not change. Our data demonstrate that ALDH+ BCSC population contributes to breast tumor radioresistance via the Nrf2-Keap1 pathway, and targeting this cell population with miR200a could be beneficial but warrants detailed studies. Our results support the notion that Nrf2-Keap1 signaling controls mesenchymal-epithelial plasticity, regulates tumor-initiating ability and promotes the radioresistance of BCSCs.

Keywords: ALDH activity; BCSC; Keap1; Nrf2; ROS; epithelial–mesenchymal transition (EMT); fractionated dose of γ radiation; miR200a; radioresistance.


Conflict of interest statement

The authors declare no conflict of interest.

Figures

Figure 1
Figure 1
Effect of fractionated doses of radiation on breast cancer stem cell (BCSC) population induction and epithelial–mesenchymal transition (EMT). (A) BCSC population was identified in MCF-7 (left) and MDA-MB-231 cells (right) irradiated with a fractionated and acute dose of radiation by assessing ALDH activity and (B) CD44/CD24 markers using flow cytometry in MCF-7 (left) and MDA-MB-231 cells (right) after irradiation. (C) Expression of stem cell markers, i.e., NANOG and SOX2, was analyzed by Western blotting. (D) Phase-contrast images depict the effect of a fractionated and acute dose of radiation on sphere formation. All values are given as the mean ± SE, * p < 0.05, ** p < 0.01, *** p < 0.001 vs. control. All images are representative of three independent experiments.
Figure 2
Figure 2
Effect of fractionated doses of radiation on EMT. (A) Expression of EMT markers, i.e., E-cadherin, Vimentin, SLUG and SNAIL, were analyzed by Western blotting and (B) qRT-PCR of E-cadherin, Vimentin, SLUG and SNAIL. GAPDH is used as loading control. All values are given as the mean ± SE, * p < 0.05, ** p < 0.01, *** p < 0.001, ****p < 0.0001 vs. control. All images are representative of three independent experiments.
Figure 2
Figure 2
Effect of fractionated doses of radiation on EMT. (A) Expression of EMT markers, i.e., E-cadherin, Vimentin, SLUG and SNAIL, were analyzed by Western blotting and (B) qRT-PCR of E-cadherin, Vimentin, SLUG and SNAIL. GAPDH is used as loading control. All values are given as the mean ± SE, * p < 0.05, ** p < 0.01, *** p < 0.001, ****p < 0.0001 vs. control. All images are representative of three independent experiments.
Figure 3
Figure 3
Fractionated doses of radiation enhance radiation resistance and reduce apoptosis in BCSCs. (A) Clonogenic assay was carried out for up to 14 days. The representative images show an increase in the colony formation of MCF-7 cells. (B) MDA-MB-231 and their corresponding mammospheres after irradiation with fractionated doses. (C) Cell proliferation was measured by analyzing the expression of Ki67 using flow cytometry. (D) The dot plots depict Annexin V-FITC and PI staining by flow cytometry. The horizontal (x) axis represents Annexin V-FITC and the vertical (y) axis represents PI staining. The bar graph represents the percentage of apoptotic cells as Annexin-V-FITC-positive cells (early apoptotic cells) and the percentage of Annexin-V-FITC- and PI-positive cells (late apoptotic cells). (E) BCL2 and BAX levels were analyzed by Western blotting. GAPDH was used as loading control. The representative bar graph shows the ratio of BCL2 and BAX. All values are given mean ± SE; * p < 0.05,; fractionated dose irradiation vs. acute irradiation.
Figure 3
Figure 3
Fractionated doses of radiation enhance radiation resistance and reduce apoptosis in BCSCs. (A) Clonogenic assay was carried out for up to 14 days. The representative images show an increase in the colony formation of MCF-7 cells. (B) MDA-MB-231 and their corresponding mammospheres after irradiation with fractionated doses. (C) Cell proliferation was measured by analyzing the expression of Ki67 using flow cytometry. (D) The dot plots depict Annexin V-FITC and PI staining by flow cytometry. The horizontal (x) axis represents Annexin V-FITC and the vertical (y) axis represents PI staining. The bar graph represents the percentage of apoptotic cells as Annexin-V-FITC-positive cells (early apoptotic cells) and the percentage of Annexin-V-FITC- and PI-positive cells (late apoptotic cells). (E) BCL2 and BAX levels were analyzed by Western blotting. GAPDH was used as loading control. The representative bar graph shows the ratio of BCL2 and BAX. All values are given mean ± SE; * p < 0.05,; fractionated dose irradiation vs. acute irradiation.
Figure 4
Figure 4
Fractionated doses of radiation enhance cell migration in vitro and tumor xenograft volume in vivo by increasing BCSC population. (A) Migration capacity was analyzed by scratch wound assay in confluent monolayers of irradiated MCF-7 cells and was expressed as % of gap closure of irradiated wells. (B) The flow diagram illustrates irradiated MCF-7 cells subcutaneously injected in SCID mice (n = 5). Tumors were dissected and dissociated in single cells, and ALDH activity was analyzed. (C) The image demonstrates isolated tumors. The bar graph represents tumor weight and volume of the xenograft tumors derived from MCF-7 control and irradiated cells. (D) ALDH activity was determined in isolated tumors using flow cytometry. All values are represented as mean ± SE. * p < 0.05; ** p < 0.01; vs. fractionated dose irradiation.
Figure 4
Figure 4
Fractionated doses of radiation enhance cell migration in vitro and tumor xenograft volume in vivo by increasing BCSC population. (A) Migration capacity was analyzed by scratch wound assay in confluent monolayers of irradiated MCF-7 cells and was expressed as % of gap closure of irradiated wells. (B) The flow diagram illustrates irradiated MCF-7 cells subcutaneously injected in SCID mice (n = 5). Tumors were dissected and dissociated in single cells, and ALDH activity was analyzed. (C) The image demonstrates isolated tumors. The bar graph represents tumor weight and volume of the xenograft tumors derived from MCF-7 control and irradiated cells. (D) ALDH activity was determined in isolated tumors using flow cytometry. All values are represented as mean ± SE. * p < 0.05; ** p < 0.01; vs. fractionated dose irradiation.
Figure 5
Figure 5
Fractionated doses of radiation generate low ROS and upregulate Nrf2 in BCSCs. (A) The bar graph represents ROS generation, assessed by DCF-DA staining using flow cytometry in MCF-7 cells and the corresponding CSC-enriched spheroids in control and irradiated cells (mean ± SE. * p < 0.05, fractionated-dose-irradiated MCF-7 cells vs. mammospheres). (B) Western blot analysis and (C) qRT-PCR illustrating the expression of Nrf2 in MCF-7 cell and MDA-MB-231 and their mammospheres. GAPDH served as loading control. (D) The bar graph represents the quantification of Nrf2 activity in irradiated MCF-7 cells and mammospheres. (E) The blots depict the Nrf2 targets HO1 and NQO1 by Western blotting. (F) The bar graph depicts the transcript levels of HO1 and NQO1 in irradiated MCF-7 cells and mammospheres by qRT-PCR. (G) Keap1 and Bach1 expression in irradiated MCF-7 cells (upper) and MDA-MB-231 (lower) and their mammospheres using Western blot analysis. (H) Transcript levels of Keap1 by qRT-PCR. GAPDH served as loading control. Mean from three independent experiments. All values are given mean ± SE. * p < 0.05, ** p < 0.01, *** p < 0.001; vs. fractionated dose irradiation.
Figure 5
Figure 5
Fractionated doses of radiation generate low ROS and upregulate Nrf2 in BCSCs. (A) The bar graph represents ROS generation, assessed by DCF-DA staining using flow cytometry in MCF-7 cells and the corresponding CSC-enriched spheroids in control and irradiated cells (mean ± SE. * p < 0.05, fractionated-dose-irradiated MCF-7 cells vs. mammospheres). (B) Western blot analysis and (C) qRT-PCR illustrating the expression of Nrf2 in MCF-7 cell and MDA-MB-231 and their mammospheres. GAPDH served as loading control. (D) The bar graph represents the quantification of Nrf2 activity in irradiated MCF-7 cells and mammospheres. (E) The blots depict the Nrf2 targets HO1 and NQO1 by Western blotting. (F) The bar graph depicts the transcript levels of HO1 and NQO1 in irradiated MCF-7 cells and mammospheres by qRT-PCR. (G) Keap1 and Bach1 expression in irradiated MCF-7 cells (upper) and MDA-MB-231 (lower) and their mammospheres using Western blot analysis. (H) Transcript levels of Keap1 by qRT-PCR. GAPDH served as loading control. Mean from three independent experiments. All values are given mean ± SE. * p < 0.05, ** p < 0.01, *** p < 0.001; vs. fractionated dose irradiation.
Figure 6
Figure 6
Inhibition of Nrf2 radiosensitizes breast cancer cells by inducing apoptosis and suppressing BCSC population after radiation treatment. (A) BCSC population measured by ALDH activity using flow cytometry in shNrf2 MCF-7 cells and mammospheres. (B) Phase-contrast images depict the effect of fractionated and acute doses of radiation on sphere formation in shNrf2 MCF-7 cells. The bar graph represents mammosphere formation efficiency for the same. (C) Expression of stem cell markers, i.e., SOX2, KLF4 and NANOG, was analyzed in shNrf2 MCF-7 cells and mammospheres by Western blotting, GAPDH is used as loading control. All values are given as the mean ± SE, *** p < 0.001 vs. fractionated-dose-irradiated shNrf2 cells. (D) The image demonstrates isolated tumors of the xenograft derived from shNrf2 MCF-7 control and irradiated cells. (E) ALDH activity was measured in shNrf2-derived tumors. (F) The representative images show a decrease in the colony formation of shNrf2 MCF-7 cells and mammospheres upon fractionated dose radiation treatment. (G) The bar graphs depict the percentage of apoptotic cells in shNrf2 MCF-7 cells and mammospheres. All values are given as the mean ± SE, * p < 0.05, ** p < 0.01; vs. fractionated dose irradiation shNrf2 cells. All images are representative of three independent experiments.
Figure 6
Figure 6
Inhibition of Nrf2 radiosensitizes breast cancer cells by inducing apoptosis and suppressing BCSC population after radiation treatment. (A) BCSC population measured by ALDH activity using flow cytometry in shNrf2 MCF-7 cells and mammospheres. (B) Phase-contrast images depict the effect of fractionated and acute doses of radiation on sphere formation in shNrf2 MCF-7 cells. The bar graph represents mammosphere formation efficiency for the same. (C) Expression of stem cell markers, i.e., SOX2, KLF4 and NANOG, was analyzed in shNrf2 MCF-7 cells and mammospheres by Western blotting, GAPDH is used as loading control. All values are given as the mean ± SE, *** p < 0.001 vs. fractionated-dose-irradiated shNrf2 cells. (D) The image demonstrates isolated tumors of the xenograft derived from shNrf2 MCF-7 control and irradiated cells. (E) ALDH activity was measured in shNrf2-derived tumors. (F) The representative images show a decrease in the colony formation of shNrf2 MCF-7 cells and mammospheres upon fractionated dose radiation treatment. (G) The bar graphs depict the percentage of apoptotic cells in shNrf2 MCF-7 cells and mammospheres. All values are given as the mean ± SE, * p < 0.05, ** p < 0.01; vs. fractionated dose irradiation shNrf2 cells. All images are representative of three independent experiments.
Figure 7
Figure 7
Promoter methylation and the role of miRNA200 in Keap1 regulation. (A) Primers’ design for bisulfite sequencing. The original genomic sequence of the Keap1 promoter region is shown. The Keap1 promoter contains 13 CpGs sites. (B) Keap1 promoter methylation by Quantification Tool for Methylation Analysis (QUMA) analysis: ○, unmethylated CpGs; ●, methylated CpGs. (C) Predicted binding sites between miR200a and Keap1 at 3′ UTR. (D) miR200a expression level in control and fractionated-dose-irradiated MCF-7 cells and mammospheres. All images are representative of three independent experiments. All values are given mean ± SE; * p < 0.05; vs. fractionated dose irradiation.

Similar articles

Cited by

References

    1. Darby S.C., McGale P., Correa C.R., Taylor C.A., Arriagada R., Clarke M., Cutter D., Davies C., Ewertz M., Godwin J., et al. Effect of radiotherapy after breast-conserving surgery on 10-year recurrence and 15-year breast cancer death: Meta-analysis of individual patient data for 10 801 women in 17 randomised trials. Lancet. 2011;378:1707–1716. doi: 10.1016/s0140-6736(11)61629-2. - DOI - PMC - PubMed
    1. Speers C., Zhao S., Liu M., Bartelink H., Pierce L.J., Feng F.Y. Development and Validation of a Novel Radiosensitivity Signature in Human Breast Cancer. Clin. Cancer Res. 2015;21:3667–3677. doi: 10.1158/1078-0432.CCR-14-2898. - DOI - PubMed
    1. Duru N., Fan M., Candas D., Menaa C., Liu H.-C., Nantajit D., Wen Y., Xiao K., Eldridge A., Chromy B.A., et al. HER2-Associated Radioresistance of Breast Cancer Stem Cells Isolated from HER2-Negative Breast Cancer Cells. Clin. Cancer Res. 2012;18:6634–6647. doi: 10.1158/1078-0432.CCR-12-1436. - DOI - PMC - PubMed
    1. Phillips T.M., McBride W.H., Pajonk F. The Response of CD24−/low/CD44+ Breast Cancer–Initiating Cells to Radiation. J. Natl. Cancer Inst. 2006;98:1777–1785. doi: 10.1093/jnci/djj495. - DOI - PubMed
    1. Diehn M., Cho R.W., Lobo N.A., Kalisky T., Dorie M.J., Kulp A.N., Qian D., Lam J.S., Ailles L.E., Wong M., et al. Association of reactive oxygen species levels and radioresistance in cancer stem cells. Nature. 2009;458:780–783. doi: 10.1038/nature07733. - DOI - PMC - PubMed

Publication types

MeSH terms