. 2020 Dec 20;12(12):3847.
doi: 10.3390/cancers12123847.

The YAP/TEAD Axis as a New Therapeutic Target in Osteosarcoma: Effect of Verteporfin and CA3 on Primary Tumor Growth

Affiliations

The YAP/TEAD Axis as a New Therapeutic Target in Osteosarcoma: Effect of Verteporfin and CA3 on Primary Tumor Growth

Sarah Morice et al. Cancers (Basel). .

Abstract

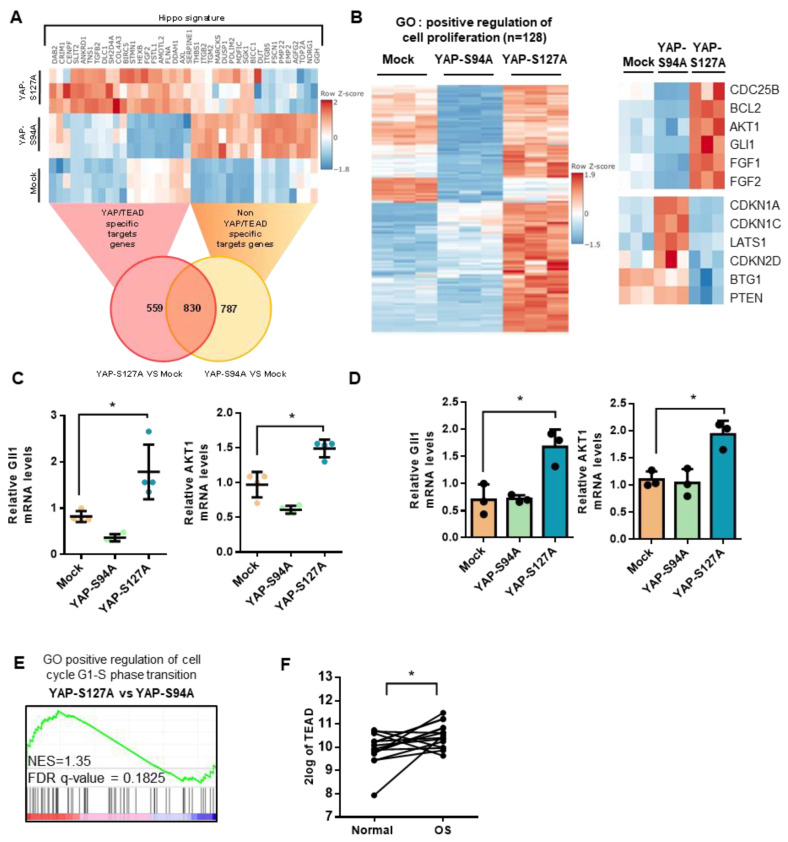
Although some studies suggested that disruption of the Hippo signaling pathway is associated with osteosarcoma progression, the molecular mechanisms by which YAP regulates primary tumor growth is not fully clarified. In addition, the validation of YAP as a therapeutic target through the use of inhibitors in a preclinical model must be demonstrated. RNA-seq analysis and Kaplan-Meier assays identified a YAP signature in osteosarcoma patients and a correlation with patients' outcomes. Molecular and cellular analysis (RNAseq, PLA, immunoprecipitation, promoter/specific gene, proliferation, cell cycle assays) using overexpression of mutated forms of YAP able or unable to interact with TEAD, indicate that TEAD is crucial for YAP-driven cell proliferation and in vivo tumor growth. In addition, in vivo experiments using an orthotopic mice model of osteosarcoma show that two YAP/TEAD inhibitors, verteporfin and CA3, reduce primary tumor growth. In this context, in vitro experiments demonstrate that these inhibitors decrease YAP expression, YAP/TEAD transcriptional activity and cell viability mainly by their ability to induce cell apoptosis. We thus demonstrate that the YAP/TEAD signaling axis is a central actor in mediating primary tumor growth of osteosarcoma, and that the use of YAP inhibitors may be a promising therapeutic strategy against osteosarcoma tumor growth.

Keywords: CA3; Hippo/YAP; osteosarcoma; tumor growth; verteporfin.


Conflict of interest statement

The authors declare no conflict of interest.

Figures

Figure 1
Figure 1
Elevation of Hippo gene expression in osteosarcoma (OS) patients—correlation between YAP expression and overall survival of OS patients. (A) Heatmap showing color-coded expression of Hippo target genes in OS tissue and matched normal tissue from the same OS patient following bioinformatics analysis of RNAseq data GSE99671 [26] from a cohort of 15 OS patients. High expression (red), low expression (blue). (B) GSEA showing a Hippo signature in OS samples following bioinformatics analysis of RNAseq data GSE99671 [26] from an OS patient’s cohort comprising 15 samples. FDR false discovery rate, NES normalized enrichment score. (C) Relative YAP gene expression in OS samples and matched normal tissues of the same patient following bioinformatics analysis of RNAseq data GSE99671 [26] (* p < 0.05). (D) Kaplan–Meier analysis of the survival outcome of patients dichotomized into high and low YAP levels, following analysis of the RNAseq dataset GSE42352 [27] from an OS patient cohort comprising 88 samples. Analysis was performed using R2 (http://r2.amc.nl); p-value is from log-rank tests.
Figure 2
Figure 2
Role of TEAD in YAP-driven transcriptional activity. (A) Localization of endogenous YAP/TEAD1 complexes by in situ PLA in HOS cells. The red signal was obtained using Alexa555-labeled hybridization oligo nucleotides targeting amplified in situ PLA products. DAPI (blue) staining was used for nuclear visualization (left panel). Bars indicate means ± SD of three independent experiments (* p < 0.05, ** p < 0.01, right panel). (B HEK293 were transiently co-transfected with the YAP-S94A, YAP-S127A, TEAD1 or empty vector as indicated. 48 h after transfection lysates were subjected to immunoprecipitation (IP) with anti-Flag antibody followed by Western blotting (WB) by anti-Flag and anti-HA antibodies as indicated. (C) HOS cells were co-transfected with the TEAD-specific construct (TEAD)8-lux with or without empty, YAPS94A and YAPS127A expression vectors. Bars indicate means ± SD of four independent experiments, each performed in triplicate (** p < 0.01). (D) YAP mRNA steady-state levels were quantified by RT-q-PCR analysis in mock-, YAPS94A- and YAPS127A-transfected K-HOS cells. Bars indicate means ± SD of four independent experiments, each performed in duplicate (* p < 0.05, left panel). YAP production was detected by Western blot analysis in mock-, YAPS94A- and YAPS127A-transfected K-HOS cells. Results shown are representative of two independent experiments (right panel). (E) Localization of YAP/TEAD1 complexes by in situ PLA experiments in mock-, YAPS94A- and YAPS127A-transfected K-HOS cells. The red signal was obtained using Alexa555-labeled hybridization oligo nucleotides targeting amplified in situ PLA products. DAPI (blue) staining was used for nuclear visualization (left panel). Bars indicate means ± S.D. of three independent experiments (** p < 0.01, right panel). (F) Mock-, YAPS94A- and YAPS127A-transfected cells were transiently transfected with the TEAD-specific construct (TEAD)8-lux. Bars indicate means ± SD of four independent experiments, each performed in duplicate (* p < 0.05).
Figure 3
Figure 3
Role of TEAD in YAP-driven OS cell proliferation and in vivo OS tumor growth. (A) Schematic representation of the experimental protocols. Briefly, K-HOS cells were stably transfected with mock-, YAPS94A- or YAPS127A-vectors. Intramuscular paratibial injections of these cells were performed in nude mice, and the tumor volume was measured three time per week. In parallel, RNAseq analysis was performed on cells. (B) Realtime proliferation assays were performed to compare the cell proliferation rate between mock-, YAPS94A- and YAPS127A-transfected K-HOS. Each point indicates means ± SD of three independent experiments, each performed in sextuplicate (** p < 0.01). (C) Intramuscular paratibial injections of 1.106 mock-, YAPS94A- and YAPS127A-transfected K-HOS cells were performed in three groups of 12 nude mice. Tumor volumes were measured three times per week for 4 weeks (left panel). Means tumor volumes of each group were measured 29 days after cell injection (middle panel, mean ± SD; * p < 0.05, **** p < 0.001). Photographs show three representative bone tumors in each group of mice (right panel).
Figure 4
Figure 4
Role of TEAD in YAP-driven cell cycle genes expression. (A) Heat map of YAP-associated upregulated gene signature in mock-, YAPS94A- and YAPS127A-transfected K-HOS cells. Color scales are based on Z-scores. (B) Heat map showing mRNA levels of 128 genes significantly overexpressed in YAPS127A-transfected cells involved in the positive regulation of cell proliferation. Color scales are based on Z-scores. (C) Total RNA was extracted from tumor biopsies of mice injected with mock-, YAPS94A- or YAPS127A-transfected cells. Gli1 and AKT1 mRNA steady-state levels were determined by quantitative RT-PCR. Bars indicate means ± S.D. of three independent experiments, each performed in duplicate. (* p < 0.05). (D) Gli1 and AKT1 mRNA steady-state levels were quantified by RT-qPCR analysis in mock-, YAPS94A- and YAPS127A-transfected K-HOS cells. Bars indicate means ± SD of three independent experiments, each performed in triplicate (* p < 0.05). (E) Enrichment score (ES) plots of GSEA analysis show a significant upregulation of genes involved in G1-S phase transition in YAPS127A-transfected K-HOS cells compared to YAPS94A-transfected K-HOS cells. (F) Relative TEAD1 gene expression in OS patients and control samples of the same patients following bioinformatics analysis of RNAseq data GSE99671 [26]. From an OS patient cohort comprising 15 samples. (* p < 0.05).
Figure 5
Figure 5
Verteporfin and CA3 inhibit YAP expression and YAP-driven TEAD transcriptional activity. (A) HOS, MG63 and G292 cells were transfected with the TEAD-specific construct (TEAD)8-lux. 24 h after transfection, cells were treated with verteporfin (left panel) or CA3 (right panel) as indicated concentration for 48 h. Bars indicate means ± S.D. of at least three independent experiments, each performed in duplicate (* p < 0.05, ** p < 0.01, *** p < 0.001, **** p < 0.0001). (B) CYR61 mRNA steady-state levels were quantified by RT-q-PCR analysis in the presence or absence of verteporfin (left panel) or CA3 (right panel) 48 h. Bars indicate the means ± SD of three independent experiments, each performed in duplicate (* p < 0.05, ** p < 0.01, *** p < 0.001,). (C) Localization of YAP/TEAD1 complexes by in situ PLA experiments in HOS cells treated or not with 10 µM verteporfin and 0.75 µM CA3 during 48 h. The red signal was obtained using Alexa555-labeled hybridization oligo nucleotides targeting amplified in situ PLA products. DAPI (blue) staining was used for nuclear visualization (left panel). Bars indicate means ± S.D. of three independent experiments (*p < 0.05, right panel). (D) HOS were stimulate or not with 10 µM verteporfin and 0.75 µM CA3 during 48 h and were then fixed, permeabilized and stained with a monoclonal antibody directed against YAP (far-red). F-actin cytoskeleton and nuclei were respectively revealed by phalloidine (green) and DAPI labelling (blue). Photographs representative of two independent experiments are shown. (E) YAP production was detected by Western blot analysis in HOS cells treated or not with 10 µM verteporfin and 0.6 µM CA3 during 72 h. Results shown are representative of three independent experiments (right panel).
Figure 6
Figure 6
Verteporfin and CA3 inhibits OS primary bone tumor growth. (A) Intramuscular paratibial injections of 1.106 HOS cells were performed in two groups of 12 nude mice treated with vehicle or verteporfin (20 mg/kg), and vehicle or CA3 (10 mg/kg) as indicated. Tumor volumes were measured three times per week for 4 weeks. Means tumor volumes of each group were measured 30 or 33 days after cell injection (right panels, mean ± SD; * p < 0.05 **** p < 0.0001). (B) HOS, MG63, and G292 OS cell lines were treated with verteporfin (left panel) or CA3 (right panel) as indicated for 72 h. Graph represent cell viability after treatment. Mean of three independent experiments, each performed in sextuplicate. (C) Upper panels: Representative dot plots of HOS cells untreated or treated with 10 µM verteporfin or 0.75 µM CA3 for 72 h are shown (representative graphs of three experiments). Lower panels: Bars indicate the means ± SD of the relative number of lives cells, death cells, and cells in early- or late-phase apoptosis (n = 3 independent experiments).

Similar articles

Cited by

References

    1. Simpson E., Brown H.L. Understanding osteosarcomas. JAAPA. 2018;31:15–19. doi: 10.1097/01.JAA.0000541477.24116.8d. - DOI - PubMed
    1. Ottaviani G., Jaffe N. The epidemiology of osteosarcoma. Cancer Treat. Res. 2009;152:3–13. doi: 10.1007/978-1-4419-0284-9_1. - DOI - PubMed
    1. Jo V.Y., Fletcher C.D.M. WHO classification of soft tissue tumours: An update based on the 2013 (4th) edition. Pathology. 2014;46:95–104. doi: 10.1097/PAT.0000000000000050. - DOI - PubMed
    1. Gianferante D.M., Mirabello L., Savage S.A. Germline and somatic genetics of osteosarcoma—Connecting aetiology, biology and therapy. Nat. Rev. Endocrinol. 2017;13:480–491. doi: 10.1038/nrendo.2017.16. - DOI - PubMed
    1. Moore D.D., Luu H.H. Osteosarcoma. Cancer Treat. Res. 2014;162:65–92. doi: 10.1007/978-3-319-07323-1_4. - DOI - PubMed

LinkOut - more resources