

Assessing Velocity and Directionality of Uterine Electrical Activity for Preterm Birth Prediction Using EHG Surface Records
- PMID: 33419319
- PMCID: PMC7766070
- DOI: 10.3390/s20247328
Assessing Velocity and Directionality of Uterine Electrical Activity for Preterm Birth Prediction Using EHG Surface Records
Abstract
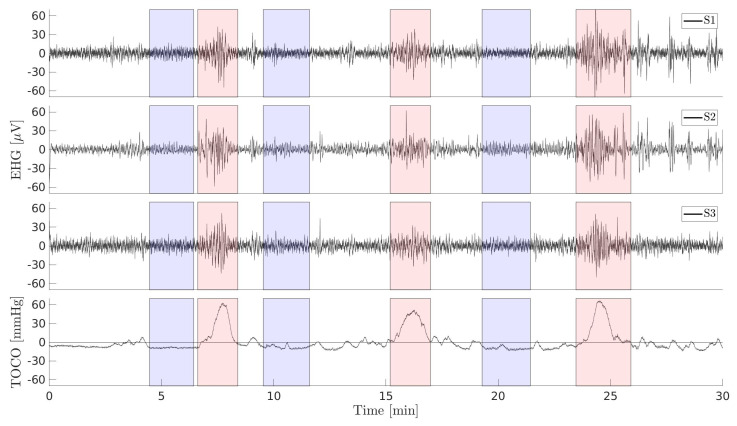
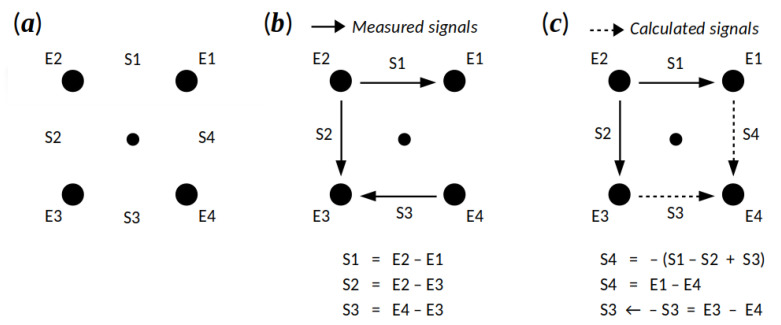
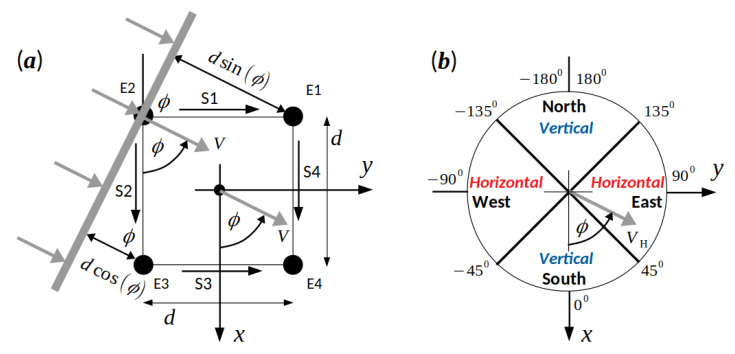
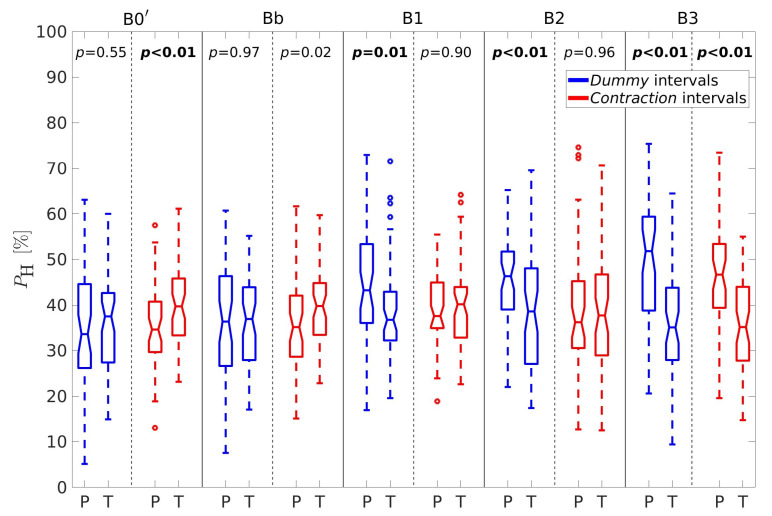
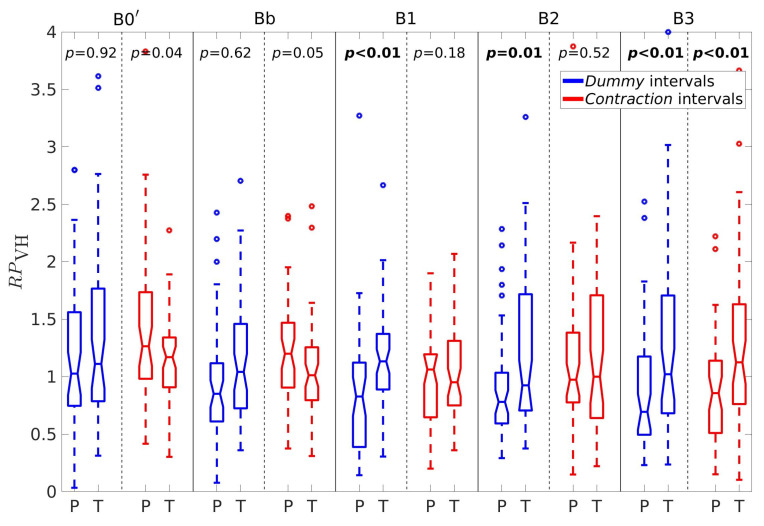
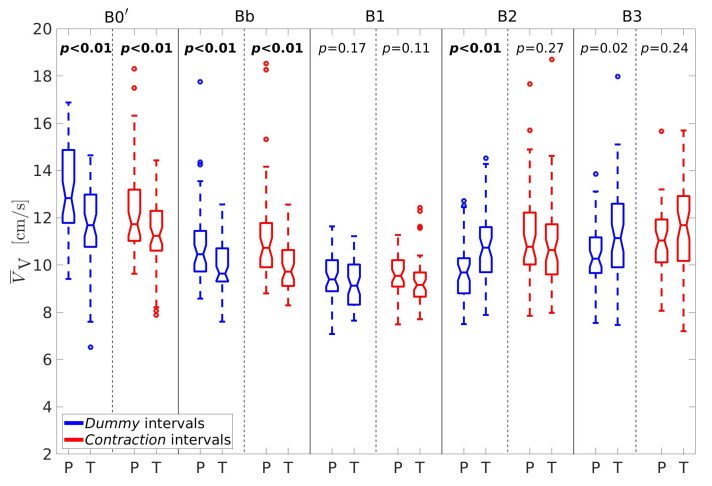
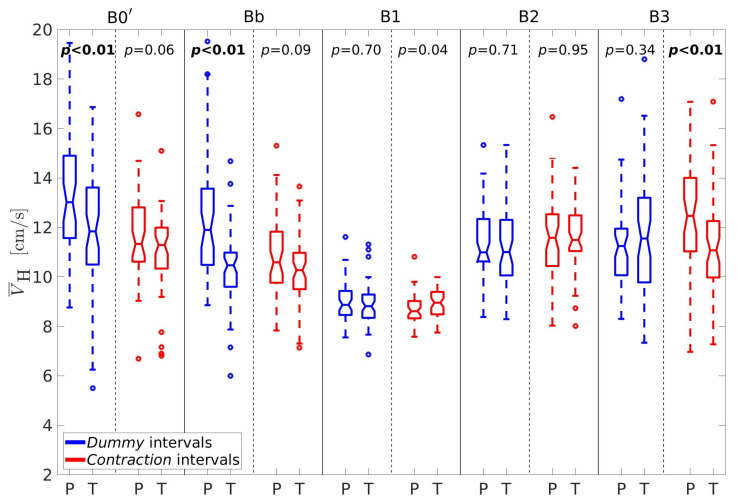
The aim of the present study was to assess the capability of conduction velocity amplitudes and directions of propagation of electrohysterogram (EHG) waves to better distinguish between preterm and term EHG surface records. Using short-time cross-correlation between pairs of bipolar EHG signals (upper and lower, left and right), the conduction velocities and their directions were estimated using preterm and term EHG records of the publicly available Term-Preterm EHG DataSet with Tocogram (TPEHGT DS) and for different frequency bands below and above 1.0 Hz, where contractions and the influence of the maternal heart rate on the uterus, respectively, are expected. No significant or preferred continuous direction of propagation was found in any of the non-contraction (dummy) or contraction intervals; however, on average, a significantly lower percentage of velocity vectors was found in the vertical direction, and significantly higher in the horizontal direction, for preterm dummy intervals above 1.0 Hz. The newly defined features-the percentages of velocities in the vertical and horizontal directions, in combination with the sample entropy of the EHG signal recorded in the vertical direction, obtained from dummy intervals above 1.0 Hz-showed the highest classification accuracy of 86.8% (AUC=90.3%) in distinguishing between preterm and term EHG records of the TPEHGT DS.
Keywords: conduction velocity; conduction velocity directionality; contraction intervals; dummy intervals; electrohysterogram; preterm birth prediction; propagation of EHG waves; short-time cross-correlation.
Conflict of interest statement
The authors declare no conflict of interest. The funders had no role in the design of the study; in the collection, analyses, or interpretation of data; in the writing of the manuscript, or in the decision to publish the results.
Figures


Similar articles
-
Characterization and automatic classification of preterm and term uterine records.PLoS One. 2018 Aug 28;13(8):e0202125. doi: 10.1371/journal.pone.0202125. eCollection 2018. PLoS One. 2018. PMID: 30153264 Free PMC article.
-
Study protocol: PoPE-Prediction of Preterm delivery by Electrohysterography.BMC Pregnancy Childbirth. 2014 Jun 5;14:192. doi: 10.1186/1471-2393-14-192. BMC Pregnancy Childbirth. 2014. PMID: 24898548 Free PMC article.
-
Network Theory Based EHG Signal Analysis and its Application in Preterm Prediction.IEEE J Biomed Health Inform. 2022 Jul;26(7):2876-2887. doi: 10.1109/JBHI.2022.3140427. Epub 2022 Jul 1. IEEE J Biomed Health Inform. 2022. PMID: 34986107
-
Electrohysterography in the diagnosis of preterm birth: a review.Physiol Meas. 2018 Feb 26;39(2):02TR01. doi: 10.1088/1361-6579/aaad56. Physiol Meas. 2018. PMID: 29406317 Review.
-
Accuracy of frequency-related parameters of the electrohysterogram for predicting preterm delivery: a review of the literature.Obstet Gynecol Surv. 2009 Aug;64(8):529-41. doi: 10.1097/OGX.0b013e3181a8c6b1. Obstet Gynecol Surv. 2009. PMID: 19624864 Review.
Cited by
-
Prediction of Preterm Delivery from Unbalanced EHG Database.Sensors (Basel). 2022 Feb 15;22(4):1507. doi: 10.3390/s22041507. Sensors (Basel). 2022. PMID: 35214412 Free PMC article.
-
Prediction of Preterm Labor from the Electrohysterogram Signals Based on Different Gestational Weeks.Sensors (Basel). 2023 Jun 27;23(13):5965. doi: 10.3390/s23135965. Sensors (Basel). 2023. PMID: 37447815 Free PMC article.
-
Characteristics of phase synchronization in electrohysterography and tocodynamometry for preterm birth prediction.Heliyon. 2024 Nov 15;10(22):e40433. doi: 10.1016/j.heliyon.2024.e40433. eCollection 2024 Nov 30. Heliyon. 2024. PMID: 39634434 Free PMC article.
-
An open dataset with electrohysterogram records of pregnancies ending in induced and cesarean section delivery.Sci Data. 2023 Oct 2;10(1):669. doi: 10.1038/s41597-023-02581-6. Sci Data. 2023. PMID: 37783671 Free PMC article.
-
Peak amplitude of the normalized power spectrum of the electromyogram of the uterus in the low frequency band is an effective predictor of premature birth.PLoS One. 2024 Sep 12;19(9):e0308797. doi: 10.1371/journal.pone.0308797. eCollection 2024. PLoS One. 2024. PMID: 39264880 Free PMC article.
References
-
- World Health Organization Born too Soon: The Global Action Report on Preterm Birth. [(accessed on 20 December 2020)]; Available online: https://apps.who.int/iris/bitstream/handle/10665/44864/9789244503430_rus....
-
- Maner W.L., Garfield R.E., Maul H., Olson G., Saade G. Predicting term and preterm delivery with transabdominal uterine electromyography. Obstet. Gynecol. 2003;101:1254–1260. - PubMed
MeSH terms
Grants and funding
LinkOut - more resources
Full Text Sources
