

Characterization of metabolic responses, genetic variations, and microsatellite instability in ammonia-stressed CHO cells grown in fed-batch cultures
- PMID: 33419422
- PMCID: PMC7791692
- DOI: 10.1186/s12896-020-00667-2
Characterization of metabolic responses, genetic variations, and microsatellite instability in ammonia-stressed CHO cells grown in fed-batch cultures
Abstract
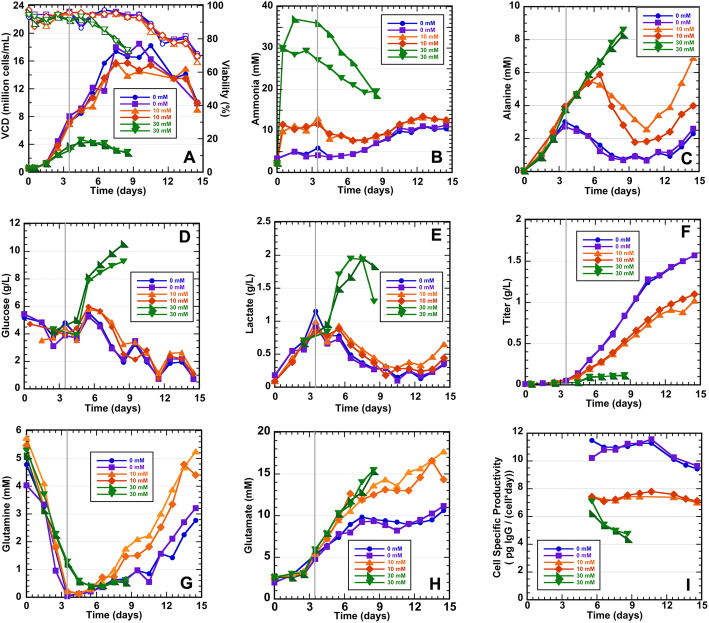
Background: As bioprocess intensification has increased over the last 30 years, yields from mammalian cell processes have increased from 10's of milligrams to over 10's of grams per liter. Most of these gains in productivity can be attributed to increasing cell densities within bioreactors. As such, strategies have been developed to minimize accumulation of metabolic wastes, such as lactate and ammonia. Unfortunately, neither cell growth nor biopharmaceutical production can occur without some waste metabolite accumulation. Inevitably, metabolic waste accumulation leads to decline and termination of the culture. While it is understood that the accumulation of these unwanted compounds imparts a suboptimal culture environment, little is known about the genotoxic properties of these compounds that may lead to global genome instability. In this study, we examined the effects of high and moderate extracellular ammonia on the physiology and genomic integrity of Chinese hamster ovary (CHO) cells.
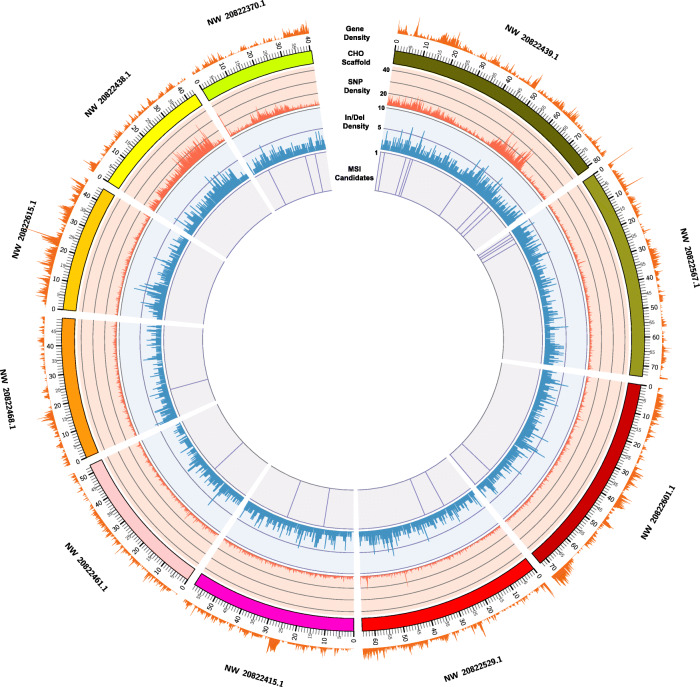
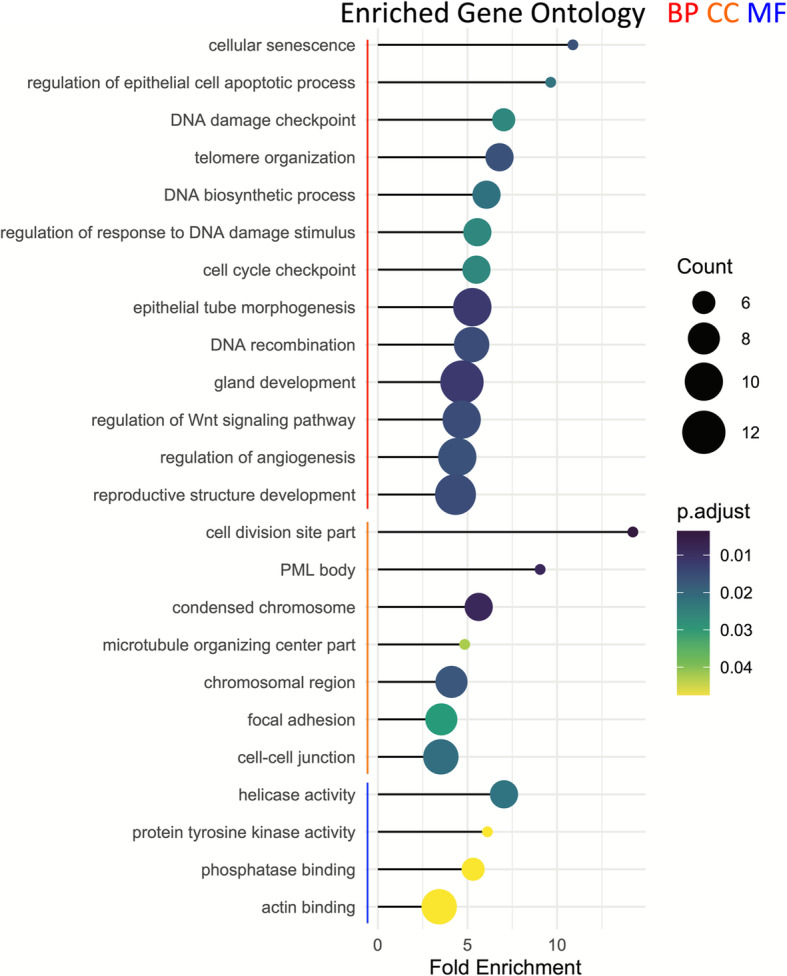
Results: Through whole genome sequencing, we discovered 2394 variant sites within functional genes comprised of both single nucleotide polymorphisms and insertion/deletion mutations as a result of ammonia stress with high or moderate impact on functional genes. Furthermore, several of these de novo mutations were found in genes whose functions are to maintain genome stability, such as Tp53, Tnfsf11, Brca1, as well as Nfkb1. Furthermore, we characterized microsatellite content of the cultures using the CriGri-PICR Chinese hamster genome assembly and discovered an abundance of microsatellite loci that are not replicated faithfully in the ammonia-stressed cultures. Unfaithful replication of these loci is a signature of microsatellite instability. With rigorous filtering, we found 124 candidate microsatellite loci that may be suitable for further investigation to determine whether these loci may be reliable biomarkers to predict genome instability in CHO cultures.
Conclusion: This study advances our knowledge with regards to the effects of ammonia accumulation on CHO cell culture performance by identifying ammonia-sensitive genes linked to genome stability and lays the foundation for the development of a new diagnostic tool for assessing genome stability.
Keywords: Ammonia; Biomarker; CHO; Genome instability; MSI.
Conflict of interest statement
The authors declare that they have no competing interests.
Figures


Similar articles
-
Identification and control of novel growth inhibitors in fed-batch cultures of Chinese hamster ovary cells.Biotechnol Bioeng. 2017 Aug;114(8):1779-1790. doi: 10.1002/bit.26313. Epub 2017 May 12. Biotechnol Bioeng. 2017. PMID: 28409820
-
Concomitant reduction of lactate and ammonia accumulation in fed-batch cultures: Impact on glycoprotein production and quality.Biotechnol Prog. 2018 Mar;34(2):494-504. doi: 10.1002/btpr.2607. Epub 2018 Jan 18. Biotechnol Prog. 2018. PMID: 29314777
-
Tuning metabolic efficiency for increased product yield in high titer fed-batch Chinese hamster ovary cell culture.Biotechnol Prog. 2023 May-Jun;39(3):e3327. doi: 10.1002/btpr.3327. Epub 2023 Mar 7. Biotechnol Prog. 2023. PMID: 36700684
-
Metabolic trends of Chinese hamster ovary cells in biopharmaceutical production under batch and fed-batch conditions.Biotechnol Prog. 2022 Jan;38(1):e3220. doi: 10.1002/btpr.3220. Epub 2021 Nov 14. Biotechnol Prog. 2022. PMID: 34676699 Review.
-
Towards dynamic metabolic flux analysis in CHO cell cultures.Biotechnol J. 2012 Jan;7(1):61-74. doi: 10.1002/biot.201100052. Epub 2011 Nov 21. Biotechnol J. 2012. PMID: 22102428 Review.
Cited by
-
Microevolutionary dynamics of eccDNA in Chinese hamster ovary cells grown in fed-batch cultures under control and lactate-stressed conditions.Sci Rep. 2023 Jan 21;13(1):1200. doi: 10.1038/s41598-023-27962-0. Sci Rep. 2023. PMID: 36681715 Free PMC article.
-
The Role of Endoplasmic Reticulum Stress on Reducing Recombinant Protein Production in Mammalian Cells.Biochem Eng J. 2024 Oct;210:109434. doi: 10.1016/j.bej.2024.109434. Epub 2024 Jul 20. Biochem Eng J. 2024. PMID: 39220803
-
Regeneration of Spent Culture Media for Sustainable and Continuous mAb Production via Ion Concentration Polarization.Biotechnol Bioeng. 2025 Feb;122(2):373-381. doi: 10.1002/bit.28888. Epub 2024 Nov 18. Biotechnol Bioeng. 2025. PMID: 39558516 Free PMC article.
-
Progress in fed-batch culture for recombinant protein production in CHO cells.Appl Microbiol Biotechnol. 2023 Feb;107(4):1063-1075. doi: 10.1007/s00253-022-12342-x. Epub 2023 Jan 17. Appl Microbiol Biotechnol. 2023. PMID: 36648523 Free PMC article. Review.
-
Valine feeding reduces ammonia production through rearrangement of metabolic fluxes in central carbon metabolism of CHO cells.Appl Microbiol Biotechnol. 2022 Feb;106(3):1113-1126. doi: 10.1007/s00253-021-11755-4. Epub 2022 Jan 19. Appl Microbiol Biotechnol. 2022. PMID: 35044498
References
-
- Carlson R. BioDesic. 2011. Biodesic 2011 bioeconomy update.
-
- The Pharmaceutical and Biotech Industries in the United States [http://selectusa.commerce.gov/industry-snapshots/pharmaceutical-and-biot...].
MeSH terms
Substances
LinkOut - more resources
Full Text Sources
Other Literature Sources
Research Materials
Miscellaneous
