. 2021 Jan 8;18(1):3.
doi: 10.1186/s12989-020-00393-9.

Exposure to diesel exhaust particles results in altered lung microbial profiles, associated with increased reactive oxygen species/reactive nitrogen species and inflammation, in C57Bl/6 wildtype mice on a high-fat diet

Affiliations

Exposure to diesel exhaust particles results in altered lung microbial profiles, associated with increased reactive oxygen species/reactive nitrogen species and inflammation, in C57Bl/6 wildtype mice on a high-fat diet

Sarah Daniel et al. Part Fibre Toxicol. .

Abstract

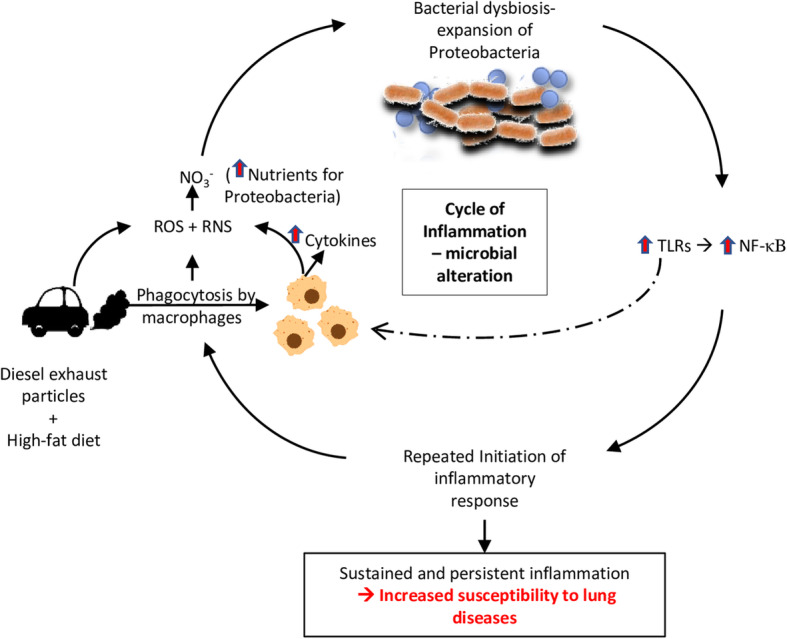
Background: Exposure to traffic-generated emissions is associated with the development and exacerbation of inflammatory lung disorders such as chronic obstructive pulmonary disorder (COPD) and idiopathic pulmonary fibrosis (IPF). Although many lung diseases show an expansion of Proteobacteria, the role of traffic-generated particulate matter pollutants on the lung microbiota has not been well-characterized. Thus, we investigated the hypothesis that exposure to diesel exhaust particles (DEP) can alter commensal lung microbiota, thereby promoting alterations in the lung's immune and inflammatory responses. We aimed to understand whether diet might also contribute to the alteration of the commensal lung microbiome, either alone or related to exposure. To do this, we used male C57Bl/6 mice (4-6-week-old) on either regular chow (LF) or high-fat (HF) diet (45% kcal fat), randomly assigned to be exposed via oropharyngeal aspiration to 35 μg DEP, suspended in 35 μl 0.9% sterile saline or sterile saline only (control) twice a week for 30 days. A separate group of study animals on the HF diet was concurrently treated with 0.3 g/day of Winclove Ecologic® Barrier probiotics in their drinking water throughout the study.

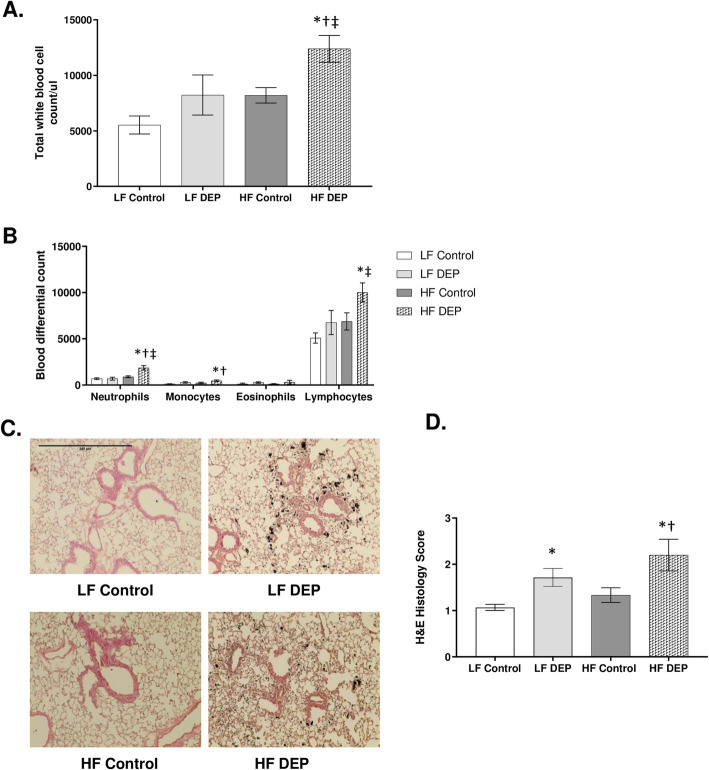
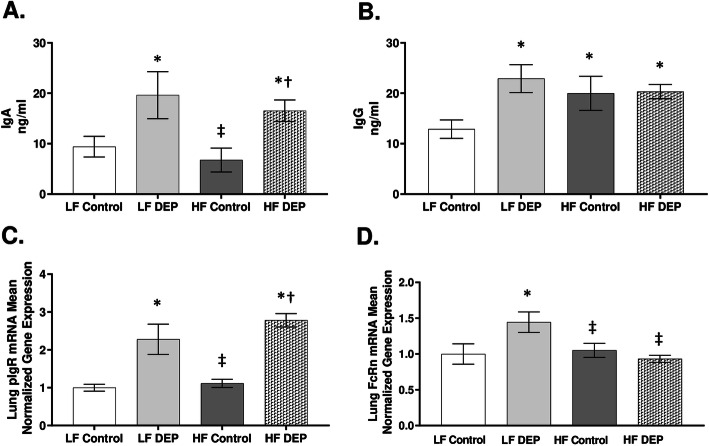
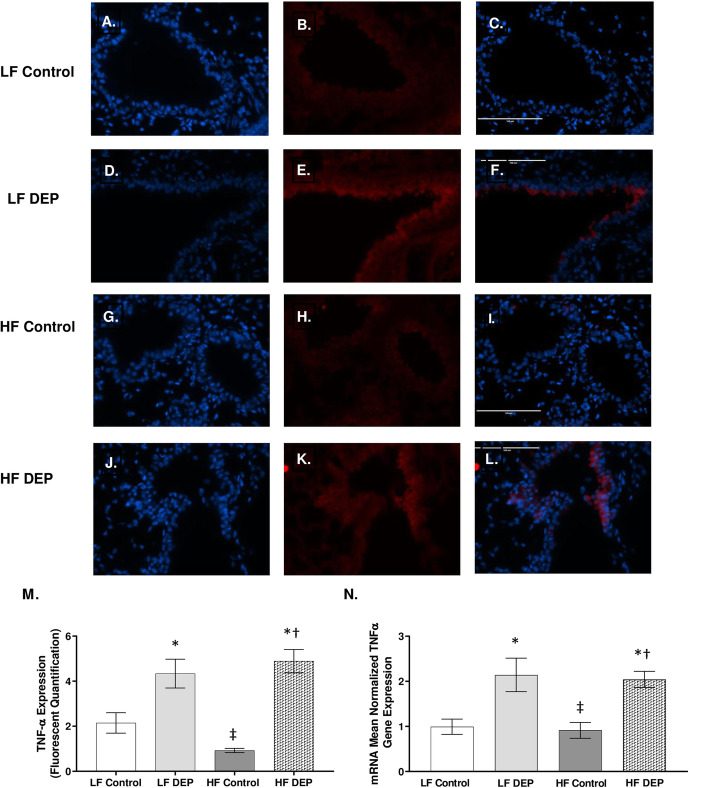
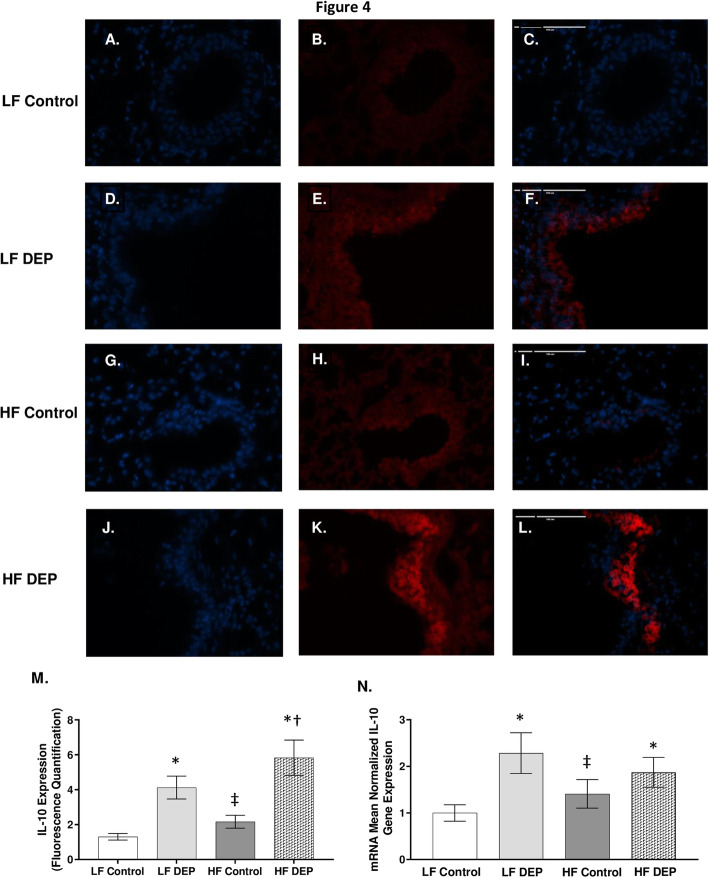
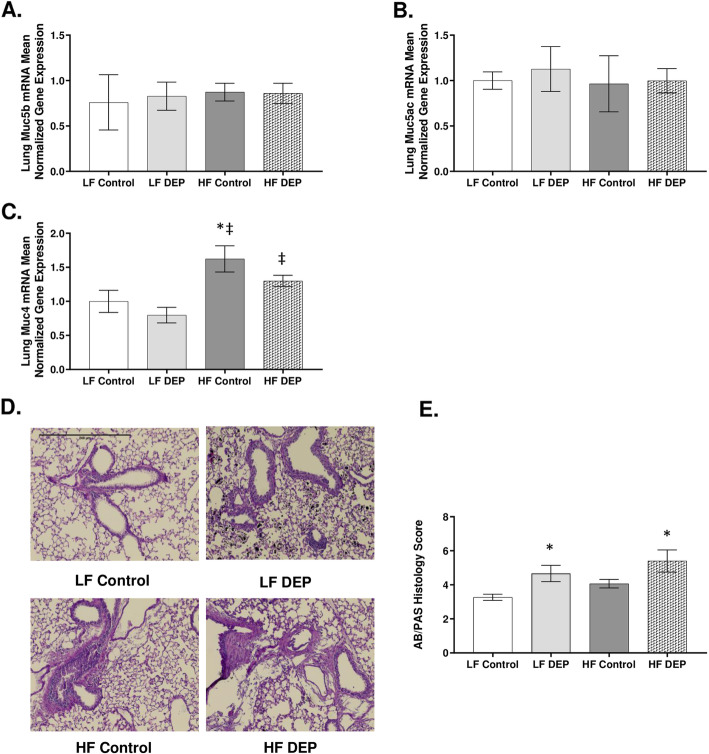
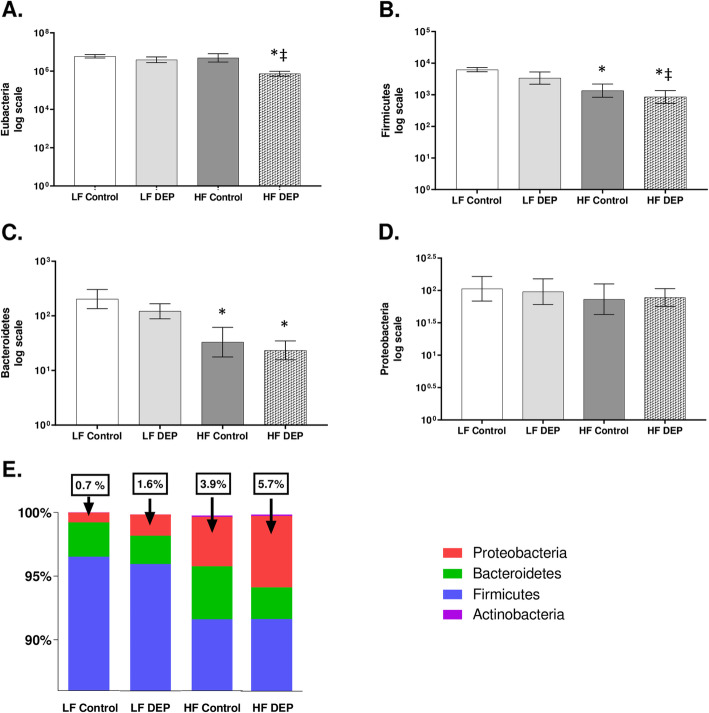
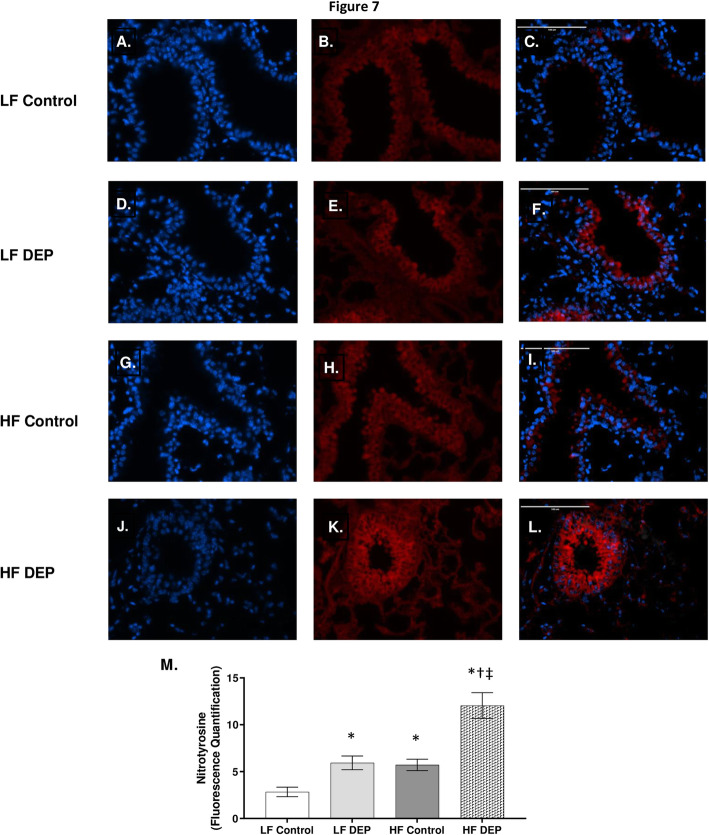
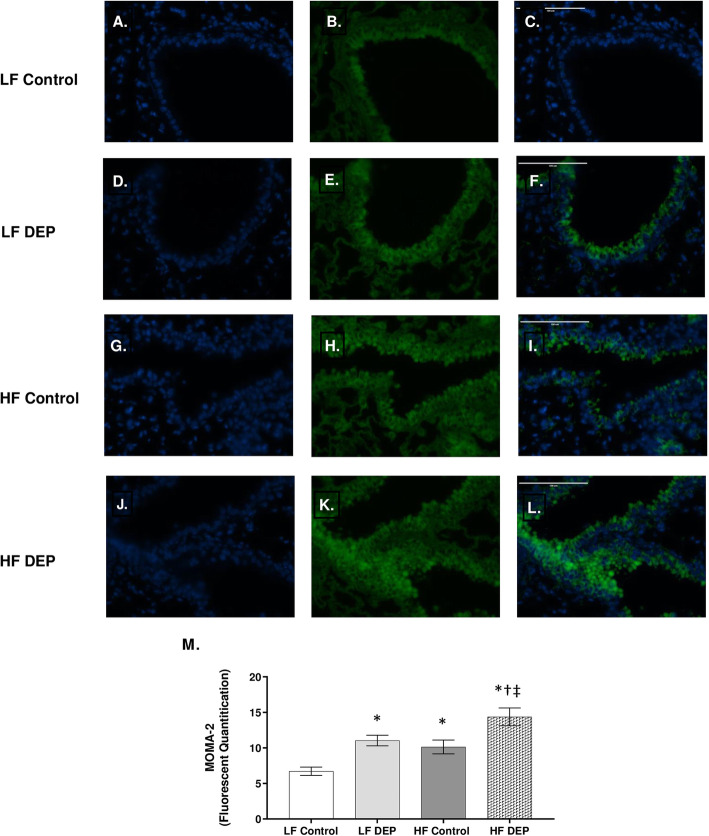
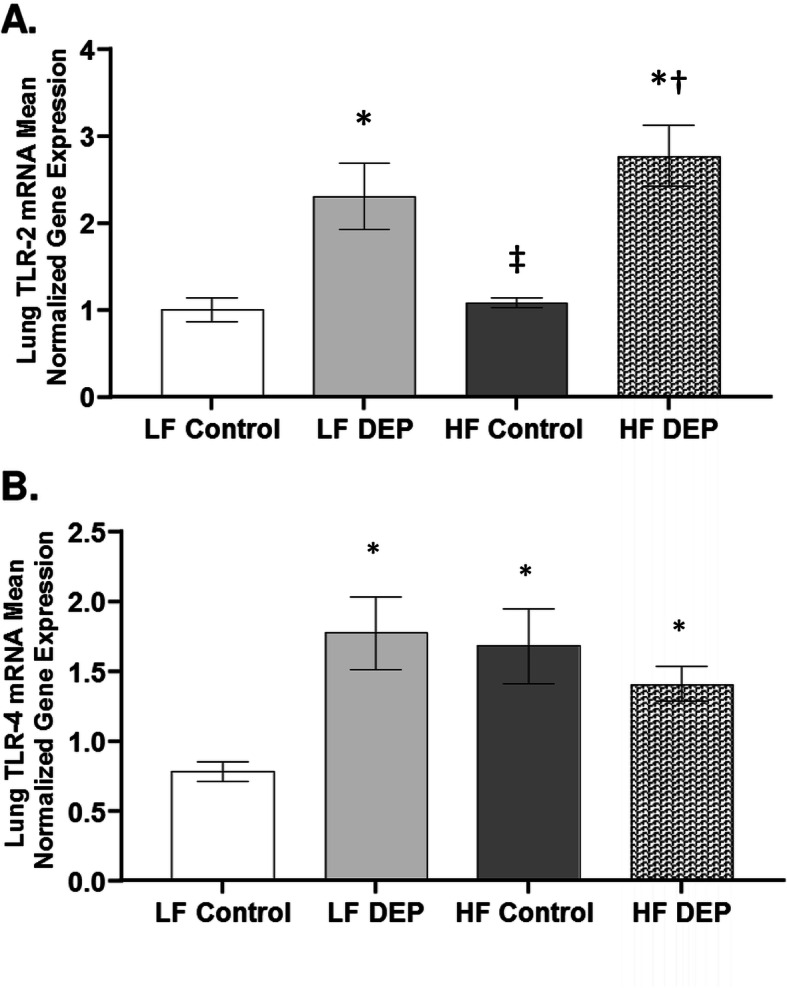
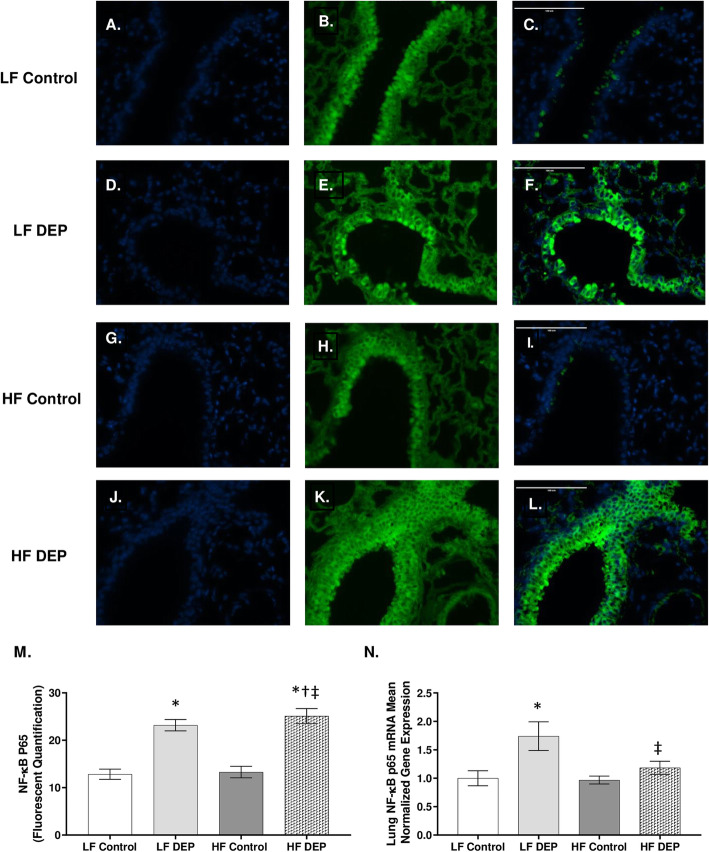
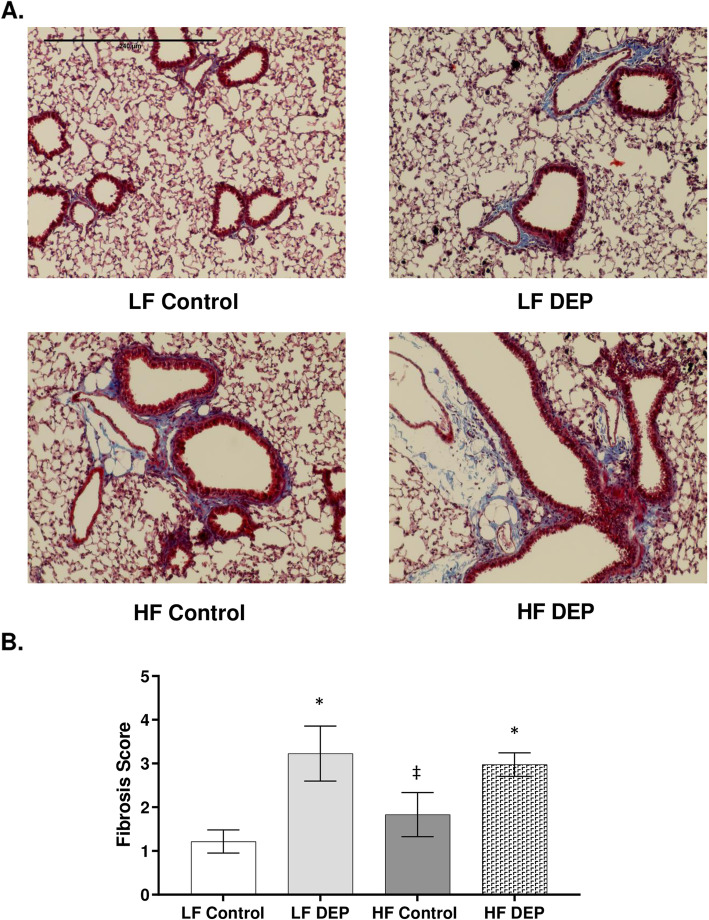
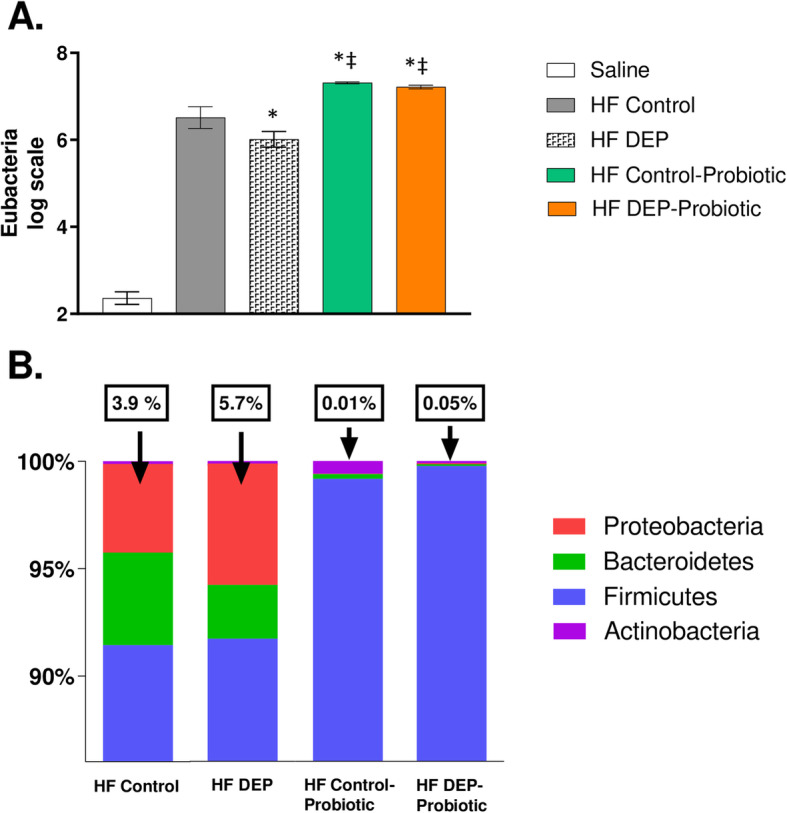
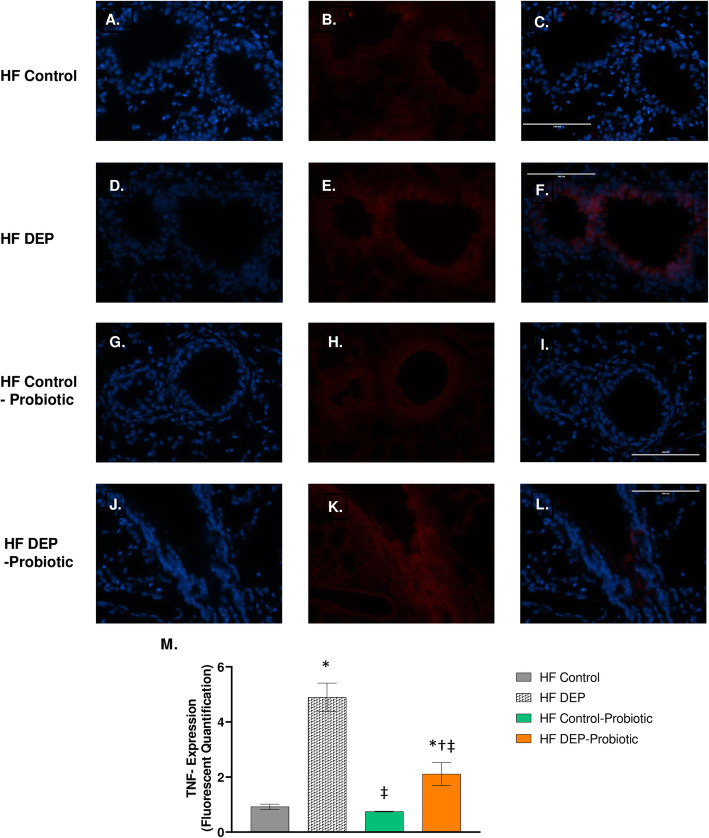
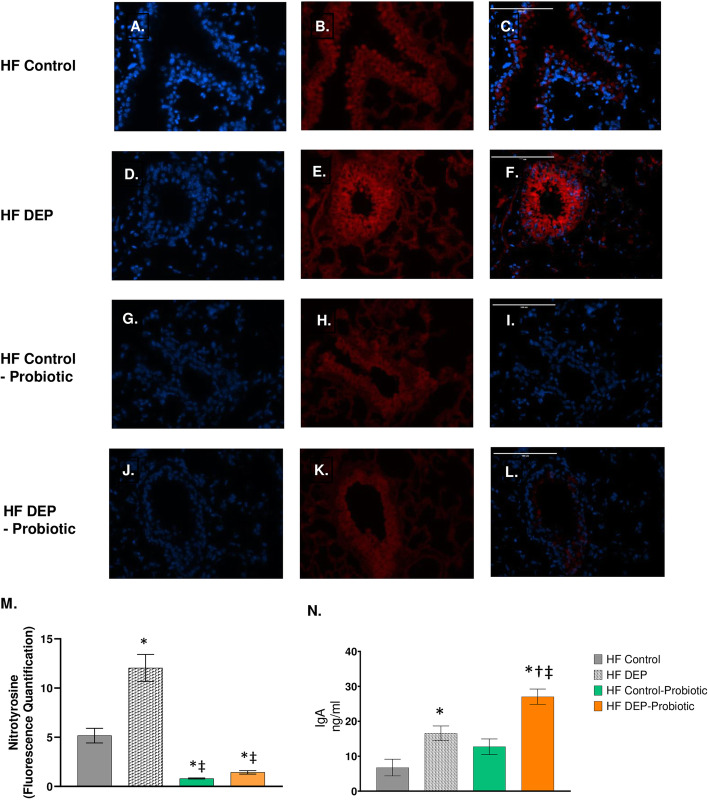
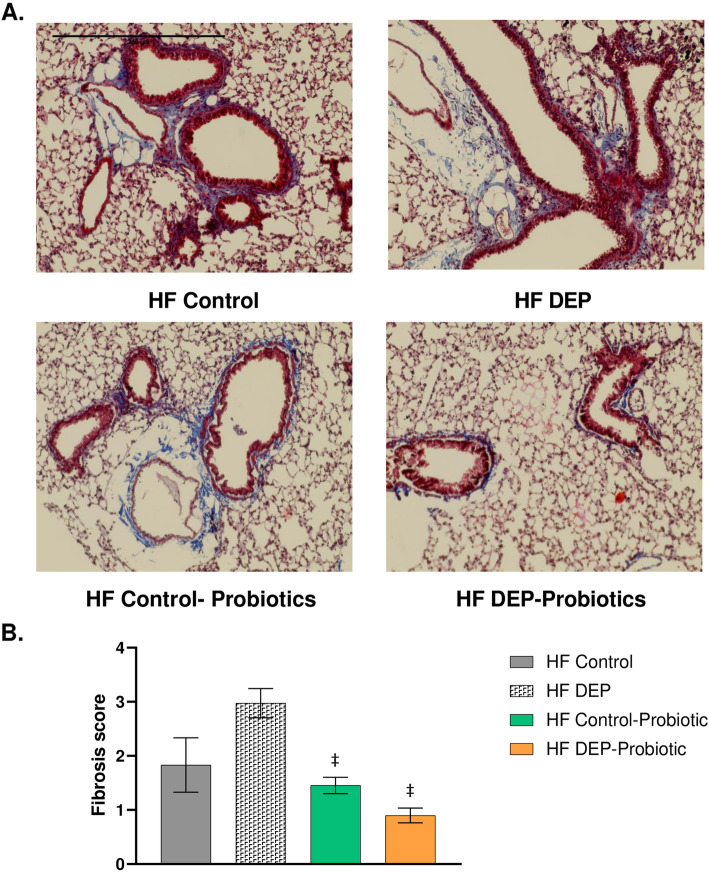
Results: Our results show that DEP-exposure increases lung tumor necrosis factor (TNF)-α, interleukin (IL)-10, Toll-like receptor (TLR)-2, TLR-4, and the nuclear factor kappa B (NF-κB) histologically and by RT-qPCR, as well as Immunoglobulin A (IgA) and Immunoglobulin G (IgG) in the bronchoalveolar lavage fluid (BALF), as quantified by ELISA. We also observed an increase in macrophage infiltration and peroxynitrite, a marker of reactive oxygen species (ROS) + reactive nitrogen species (RNS), immunofluorescence staining in the lungs of DEP-exposed and HF-diet animals, which was further exacerbated by concurrent DEP-exposure and HF-diet consumption. Histological examinations revealed enhanced inflammation and collagen deposition in the lungs DEP-exposed mice, regardless of diet. We observed an expansion of Proteobacteria, by qPCR of bacterial 16S rRNA, in the BALF of DEP-exposed mice on the HF diet, which was diminished with probiotic-treatment.

Conclusions: Our findings suggest that exposure to DEP causes persistent and sustained inflammation and bacterial alterations in a ROS-RNS mediated fashion, which is exacerbated by concurrent consumption of an HF diet.

Keywords: Diesel particulate matter; Inflammation; Lung microbiome; Probiotics; Reactive nitrogen species; Reactive oxygen species.


Conflict of interest statement

Probiotics were provided by Winclove Probiotics and funding from a grant received from the National Institute of Environmental Health Sciences at National Institute of Health was used to conduct some of the studies described, herein; however, the authors declare no conflict of interest or financial gains to these entities associated with this publication.

Figures

Fig. 1
Fig. 1
Exposure to diesel exhaust particles results in systemic and peri-bronchial inflammation. a Graphs representing total white blood cell count and b blood differential counts in 4–6 week-old male C57Bl/6 wildtype mice, on either control (LF) or high-fat (HF) diet exposed to either saline (control) or diesel exhaust particles (DEP – 35 μg PM) for 1 week. c Representative images of H&E staining of lung sections in control and exposed groups after 30 days of exposure. d Quantification of histological injury score in mice exposed to either DEP or saline. Images displayed are using 20X magnification. Scale bar = 240 μm. Data are depicted as mean ± SEM with *p < 0.05 compared to LF Control, †p < 0.05 compared to HF Control, ‡p < 0.05 compared to LF DEP by two way ANOVA
Fig. 2
Fig. 2
Exposure to DEP results in increased levels of immunoglobulins in the BALF. a Quantification of IgA (ng/ml) and b IgG (ng/ml), in the bronchoalveolar lavage fluid (BALF) of 4–6 week-old male C57Bl/6 wildtype mice, on either control (LF) or high-fat (HF) diet exposed to either saline (control) or diesel exhaust particles (DEP – 35 μg PM) twice a week for a total of 30 days, by ELISA. c Mean normalized gene expression of IgA receptor - pIgR and d IgG receptor – FcRn in lung tissues, as determined by RT-qPCR. Data are depicted as mean ± SEM with *p < 0.05 compared to LF Control, †p < 0.05 compared to HF Control, ‡p < 0.05 compared to LF DEP by two way ANOVA
Fig. 3
Fig. 3
Exposure to diesel exhaust particles results in increased expression of TNF-α. Representative images of tumor necrosis factor (TNF)-α expression in the lungs of C57Bl/6 mice on a control (LF; a-c) or high-fat (HF; g-i) diet exposed to saline (control) or on a LF (d-f) or HF diet (j-l) exposed to diesel exhaust particles (DEP – 35 μg PM) twice a week for a total of 30 days. Red fluorescence indicates TNF-α expression, blue fluorescence is nuclear staining (Hoechst). Right panels (c, f, i, l) are merged figures of left (blue; a, d, g, j) and center (red; b, e, h, k) panels. m Graph of histology analysis of lung TNF-α fluorescence and n mean normalized gene expression of TNF-α mRNA transcript expression within the lungs, as determined by RT-qPCR. 40x magnification; scale bar = 100 μm. *p < 0.05 compared to LF Control, †p < 0.05 compared to HF Control, ‡p < 0.05 compared to LF DEP by two way ANOVA
Fig. 4
Fig. 4
Exposure to diesel exhaust particles results in increased expression of IL-10. Representative images of Interleukin - 10 (IL-10) expression in the lungs of C57Bl/6 mice on a low-fat (LF; a-c or high-fat (HF; g-i) diet exposed to saline (control) or on a LF (d-f) or HF diet (j-l) exposed to diesel exhaust particles (DEP – 35 μg PM) twice a week for a total of 30 days. Red fluorescence indicates IL-10 expression, blue fluorescence is nuclear staining (Hoechst). Right panels (c, f, i, l) are merged figures of left (blue; a, d, g, j) and center (red; b, e, h, k) panels. m Graph of histology analysis of lung IL-10 fluorescence and n mean normalized gene expression of IL-10 mRNA transcript expression within the lung, as determined by RT-qPCR. 40x magnification, scale bar = 100 μm. *p < 0.05 compared to LF Control, †p < 0.05 compared to HF Control, ‡p < 0.05 compared to LF DEP by two way ANOVA
Fig. 5
Fig. 5
Exposure to diesel exhaust particles results in increased mucus production. a Mean normalized gene expression of Muc5b, b Muc5ac and c Muc4 mRNA transcript expression within the lungs of C57Bl/6 wildtype mice, as determined by RT-qPCR, on either control (LF) or high-fat (HF) diet, exposed to either saline (control) or diesel exhaust particles (DEP − 35 μg PM) twice a week for a total of 30 days. d Representative images of AB/PAS staining of lung sections and e quantification of histological mucus score. Images displayed are using 20X magnification, scale bar = 240 μm. Data are depicted as mean ± SEM with *p < 0.05 compared to LF Control, ‡p < 0.05 compared to LF DEP by two way ANOVA
Fig. 6
Fig. 6
Exposure to diesel exhaust particles results in an increased relative abundance of Proteobacteria. a Quantification in log scale of (a) Eubacteria (total bacteria), b Firmicutes, c Bacteroidetes and d Proteobacteria within the lungs of C57Bl/6 wildtype mice on either control (LF) or high-fat (HF) diet exposed to either saline (control) or diesel exhaust particles (DEP – 35 μg PM) twice a week for a total of 30 days by qPCR. e 100% stacked columns representing the percentages of major lung phyla. Data are depicted as mean ± SEM with *p < 0.05 compared to LF Control, ‡p < 0.05 compared to LF DEP by two way ANOVA
Fig. 7
Fig. 7
Exposure to diesel exhaust particles results in increased expression of nitrotyrosine. Representative images of nitrotyrosine expression in the lungs of C57Bl/6 mice on a control (LF; a-c) or high-fat (HF; g-i) diet exposed to saline (control) or on a LF (d-f) or HF diet (j-l) exposed to diesel exhaust particles (DEP – 35 μg PM) twice a week for a total of 30 days. Red fluorescence indicates nitrotyrosine expression, blue fluorescence is nuclear staining (Hoechst). Right panels (c, f, i, l) are merged figures of left (blue; a, d, g, j) and center (red; b, e, h, k) panels. m Graph of histology analysis of lung nitrotyrosine fluorescence. 40x magnification, scale bar = 100 μm. Data are depicted as mean ± SEM with *p < 0.05 compared to LF Control, †p < 0.05 compared to HF Control, ‡p < 0.05 compared to LF DEP by two way ANOVA
Fig. 8
Fig. 8
Mice exposed to diesel exhaust particles express higher levels of MOMA-2. Representative images of MOMA-2 expression in the lungs of C57Bl/6 mice on a control (LF; a-c) or high-fat (HF; g-i) diet exposed to saline (control) or on a LF (d-f) or HF diet (j-l) exposed to diesel exhaust particles (DEP – 35 μg PM) twice a week for a total of 30 days. Green fluorescence indicates MOMA-2 expression, blue fluorescence is nuclear staining (Hoechst). Right panels (c, f, i, l) are merged figures of left (blue; a, d, g, j) and center (green; b, e, h, k) panels. m Graph of histology analysis of lung MOMA-2 fluorescence. 40x magnification; scale bar = 100 μm. Data are depicted as mean ± SEM with *p < 0.05 compared to LF Control, †p < 0.05 compared to HF Control, ‡p < 0.05 compared to LF DEP by two way ANOVA
Fig. 9
Fig. 9
Exposure to diesel exhaust particles results in the activation of TLR2 and TLR4. Mean normalized gene expression of (a) TLR2 and (b) TLR4 mRNA transcript expression within the lungs of C57Bl/6 wildtype mice, as quantified by RT-qPCR, on either control (LF) or high-fat (HF) diet, exposed to either saline (control) or diesel exhaust particles (DEP − 35 μg PM) twice a week for a total of 30 days. Data are depicted as mean ± SEM with *p < 0.05 compared to LF Control, †p < 0.05 compared to HF Control, ‡p < 0.05 compared to LF DEP by two way ANOVA
Fig. 10
Fig. 10
Mice exposed to diesel exhaust particles have increased expression of NF-κB p65. Representative images of NF-κB p65 expression in the lungs of C57Bl/6 mice on a control (LF; a-c) or high-fat (HF; g-i) diet exposed to saline (control) or on a LF (d-f) or HF diet (j-l) exposed to diesel exhaust particles (DEP – 35 μg PM/m3) twice a week for a total of 30 days. Green fluorescence indicates NF-κB p65 expression, blue fluorescence is nuclear staining (Hoechst). Right panels (c, f, i, l) are merged figures of left (blue; a, d, g, j) and center (green; b, e, h, k) panels. m Graph of histology analysis of lung NF-κB p65 fluorescence. n Mean normalized gene expression of NF-κB p65 mRNA transcript expression within the lung, as determined by RT-qPCR. 40x magnification, scale bar = 100 μm. Data are depicted as mean ± SEM with *p < 0.05 compared to LF Control, †p < 0.05 compared to HF Control, ‡p < 0.05 compared to LF DEP by two way ANOVA
Fig. 11
Fig. 11
Exposure to diesel exhaust particles results in increased collagen deposition surrounding the bronchioles. a Representative images of lung tissue sections stained with Masson’s trichrome in C57Bl/6 wildtype mice on either control (LF) or high-fat (HF) diet exposed to either saline (control) or diesel exhaust particles (DEP – 35 μg PM) twice a week for a total of 30 days. Blue areas indicate collagen deposition. b Graph of histology scoring of Masson’s trichrome staining. 20x magnification, scale bar = 240 μm. Data are depicted as mean ± SEM with *p < 0.05 compared to LF Control, ‡p < 0.05 compared to LF DEP by two way ANOVA
Fig. 12
Fig. 12
Probiotic supplementation alters the microbial profile and decreases the expansion of Proteobacteria. a Quantification by qPCR of (a) Eubacteria (log scale), b 100% stacked columns representing the percentages of major phyla within the lungs of C57Bl/6 wildtype mice on high-fat (HF) diet exposed to either saline (control) or diesel exhaust particles (DEP – 35 μg PM) twice a week for a total of 30 days alongside a dose of 0.3 g/day (~ 7.5 × 107 cfu/day) of Ecologic® Barrier probiotics in the drinking water over the course of the exposures. Data are depicted as mean ± SEM with *p < 0.05 compared to HF Control, ‡p < 0.05 compared to HF DEP by two way ANOVA. The saline group included on the graph is a negative control reference and was not included in the two way ANOVA analysis
Fig. 13
Fig. 13
Probiotic supplementation attenuates the pro-inflammatory TNF-α response with diesel exhaust particle exposure. Representative images of TNF-α expression in the lungs of C57Bl/6 mice, on a high-fat (HF) diet exposed to either (a–c) saline, (d–f) DEP – 35 μg PM, or (g–i) saline and probiotics - 0.3 g/day (~ 7.5 × 107 cfu/day) and (j-l) DEP and probiotics. Red fluorescence indicates TNF-α expression, blue fluorescence is nuclear staining (Hoechst). Right panels (c, f, i, l) are merged figures of left (blue; a, d, g, j) and center (red; b, e, h, k) panels. m Graph of histology analysis of lung TNF-α fluorescence. 40x magnification, scale bar = 100 μm. Data are depicted as mean ± SEM with *p < 0.05 compared to HF Control, †p < 0.05 compared to HF Control - Probiotics, ‡p < 0.05 compared to HF DEP by two way ANOVA
Fig. 14
Fig. 14
Probiotic supplementation decreases nitrotyrosine expression and enhances IgA production. Representative images of nitrotyrosine expression in the lungs of C57Bl/6 mice, on a high-fat (HF) diet exposed to either (a–c) saline, (d–f) DEP – 35 μg PM, or (g–i) saline and probiotics - 0.3 g/day (~ 7.5 × 107 cfu/day) and (j-l) DEP and probiotics. Red fluorescence indicates nitrotyrosine expression, blue fluorescence is nuclear staining (Hoechst). Right panels (c, f, i, l) are merged figures of left (blue; a, d, g, j) and center (red; b, e, h, k) panels. m Graph of histology analysis of lung nitrotyrosine fluorescence. n Quantification of IgA (ng/ml) in the bronchoalveolar lavage fluid by ELISA. Data are depicted as mean ± SEM with *p < 0.05 compared to HF Control, †p < 0.05 compared to HF Control - Probiotics, ‡p < 0.05 compared to HF DEP by two way ANOVA
Fig. 15
Fig. 15
Probiotic supplementation decreases collagen deposition surrounding the bronchioles. a Representative images of lung tissue sections stained with Masson’s trichrome in of 4–6 week-old C57Bl/6 wildtype mice on high-fat (HF) diet exposed to either saline (control) or diesel exhaust particles (DEP – 35 μg PM) twice a week for a total of 30 days alongside a dose of 0.3 g/day (~ 7.5 × 107 cfu/day) of Ecologic® Barrier probiotics in the drinking water over the course of the exposures. Blue areas indicate collagen deposition. b Graph of histology scoring of Masson’s trichrome staining. 20x magnification, scale bar = 240 μm. Data are depicted as mean ± SEM with ‡p < 0.05 compared to HF DEP by two way ANOVA
Fig. 16
Fig. 16
Synergistic effects of diesel exhaust particles (DEP) and high-fat (HF) diet results in increased reactive oxygen and nitrogen species (ROS + RNS) produced possibly by macrophages, which increases nitrates within the lung environment. These nitrates provide nutrients for anaerobic respiration and selective growth of Proteobacteria within the lungs resulting in alterations in the commensal microbial composition. Both DEP and the bacterial alterations could activate Toll-like receptors (TLRs) which results in the subsequent activation of NF-κB mediated inflammatory gene transcription. Since NF-κB signaling is understood to be required for sustained cytokine expression in macrophages, the production of inflammatory cytokines, ROS, and RNS is sustained, resulting in a continuous cycle of inflammation and microbial shifts throughout the duration of DEP exposures. This sustained and persistent inflammation is a possible contributor and significant in the development of lung diseases

Similar articles

Cited by

References

    1. Riediker M, Zink D, Kreyling W, Oberdörster G, Elder A, Graham U, et al. Particle toxicology and health - where are we? Part Fibre Toxicol. 2019;16(1):19. doi: 10.1186/s12989-019-0302-8. - DOI - PMC - PubMed
    1. Bevan RJ, Kreiling R, Levy LS, Warheit DB. Toxicity testing of poorly soluble particles, lung overload and lung cancer. Regul Toxicol Pharmacol. 2018;100:80–91. doi: 10.1016/j.yrtph.2018.10.006. - DOI - PubMed
    1. Winterbottom CJ, Shah RJ, Patterson KC, Kreider ME, Panettieri RA, Jr, Rivera-Lebron B, Miller WT, Litzky LA, Penning TM, Heinlen K, Jackson T, Localio AR, Christie JD. Exposure to ambient particulate matter is associated with accelerated functional decline in idiopathic pulmonary fibrosis. Chest. 2018;153(5):1221–1228. doi: 10.1016/j.chest.2017.07.034. - DOI - PMC - PubMed
    1. Guarnieri M, Balmes JR. Outdoor air pollution and asthma. Lancet. 2014;383(9928):1581–1592. doi: 10.1016/S0140-6736(14)60617-6. - DOI - PMC - PubMed
    1. Stanek LW, Brown JS, Stanek J, Gift J, Costa DL. Air pollution toxicology--a brief review of the role of the science in shaping the current understanding of air pollution health risks. Toxicol Sci. 2011;120(Suppl 1):S8–27. doi: 10.1093/toxsci/kfq367. - DOI - PubMed

Publication types