. 2021 Jan 8;6(55):eabb6808.
doi: 10.1126/sciimmunol.abb6808.

T resident helper cells promote humoral responses in the lung

Affiliations

T resident helper cells promote humoral responses in the lung

Nivedya Swarnalekha et al. Sci Immunol. .

Abstract

Influenza is a deadly and costly infectious disease, even during flu seasons when an effective vaccine has been developed. To improve vaccines against respiratory viruses, a better understanding of the immune response at the site of infection is crucial. After influenza infection, clonally expanded T cells take up permanent residence in the lung, poised to rapidly respond to subsequent infection. Here, we characterized the dynamics and transcriptional regulation of lung-resident CD4+ T cells during influenza infection and identified a long-lived, Bcl6-dependent population that we have termed T resident helper (TRH) cells. TRH cells arise in the lung independently of lymph node T follicular helper cells but are dependent on B cells, with which they tightly colocalize in inducible bronchus-associated lymphoid tissue (iBALT). Deletion of Bcl6 in CD4+ T cells before heterotypic challenge infection resulted in redistribution of CD4+ T cells outside of iBALT areas and impaired local antibody production. These results highlight iBALT as a homeostatic niche for TRH cells and advocate for vaccination strategies that induce TRH cells in the lung.


Conflict of interest statement

Competing interests: The authors declare that they have no competing interests.

Figures

Fig. 1.
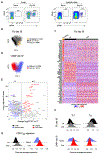
Fig. 1.. Inflammatory T cells at site of infection confound a tissue-residency signature.
Analysis of scRNA-seq of antigen-specific CD4+ T cells >30 days after viral infection. (A to C) PR8 influenza-infected mice 30 days after infection. (A) Gating strategy for NP-specific CD4+ T cells in lung and mLN of naive and infected mice. (B) PCA showing day 30 LN and lung samples, with a putative circulating cluster identified in lung samples. (C) Heatmap showing centered scaled single-cell expression of top 20 genes sorted according to cluster average log2 fold change (FC), adjusted P < 0.05. (D) PCA showing scRNA-seq of GP66-specific CD4+ T cells from spleen and liver of mice 37 days after LCMV infection. (E) Differentially expressed genes discriminating lung from LN (flu) or liver from spleen (LCMV). To enable plotting the highest y-axis values, P values of 0 were assigned the lowest nonzero P value. (F) Log-normalized average expression of TFH and Th1 memory signatures (22). (G) Log-normalized average expression of combined CD8 residency signature from multiple tissues (69, 70). Sequenced cells were pooled from n = 12 mice in (B) and n = 2 in (D).
Fig. 2.
Fig. 2.. Controlling for T helper function improves tissue residency signature.
Analysis of scRNA-seq of NP-specific CD4+ T cells at day 30 after influenza infection. (A) Unsupervised hierarchical clustering of lung cells using Ward’s method, visualized using PCA and t-distributed stochastic neighbor embedding (tSNE). (B) Heatmap showing centered single-cell expression of top 20 cluster-defining genes sorted according to lung cluster average log2FC. (C) Log-normalized average expression of TFH and TH1 memory signatures (22). (D) Unsupervised hierarchical clustering of LN cells using Ward's method: PCA and tSNE. (E) Heatmap of centered scaled single-cell expression from both lung and LN showing conserved genes for NLT and LT. Genes included are differentially expressed in the tissue in all three of the noncirculating cluster pairs. (F) Genes discriminating LN TH1 cells from lung TH1-like cells with reference to conserved tissue-specific signature. (G) Genes discriminating LN TFH cells from lung TFH-like cells with reference to conserved tissue-specific signature. (H) Genes discriminating lung TFH-like cluster 3 from lung TFH-like cluster 1 with reference to conserved tissue-specific signature. For (B) and (E) to (H), adjusted P < 0.05. Sequenced cells were pooled from n = 12 mice.
Fig. 3.
Fig. 3.. Protein expression confirms TH1 and TFH phenotypes in the lung.
(A) Representative flow cytometry gating for identification of TRM1 (red) and TRH (blue) subsets in NP-specific lung-resident CD4+ T cells. (B) Total numbers of FR4+ and FR4 NP-specific T cells over time after influenza infection. (C to F) Histograms (C and E) and geometric mean fluorescence intensity (MFI) (D and F) of indicated phenotypic markers in TRH (blue), TRM1 (red), and naïve CD4+ T cells (gray). Data are presented as the mean ± SEM (n = 5, representing two experiments) in (B). Thin lines represent mean in (D) and (F) (n = 4 to 5, representing two experiments). Significance was determined by unpaired Student’s t test. P values are as follows: **P < 0.01, ***P < 0.001, and ****P < 0.0001.
Fig. 4.
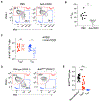
Fig. 4.. Progressive differentiation of resident CD4+ T cell subsets.
(A and B) Representative flow cytometry plots of FR4 and PSGL1 expression on lung NP-specific tissue-resident CD4+ T cells (A), and CXCR5 and PD1 expression on NP-specific CD4+ T cells in lung and mLN at indicated time points after PR8 infection (B). (C) NP-specific total CD4+ T cells, TRM1, and TRH cell numbers in control and FTY720-treated mice. ns, not significant. Data in (C) represent two experiments with n = 4 to 6 mice. Statistical significance was determined by unpaired Student’s t test. Thin lines represent mean. P < 0.05 is considered significant. (D to G) scRNA-seq of pooled cells from n = 3 (day 9), n = 4 (day 14), and n = 12 (day 30) mice. (D) PCA showing time point by tissue. (E) Centered scaled average expression of select genes in lung at day 9. (F) Log-normalized average expression of published TFH and TH1 signatures by time point and tissue (22). (G) Centered scaled average area under curve (AUC) calculated with SCENIC showing top five differentially active TFs (regulons) in lung by time point. Adjusted P < 0.01.
Fig. 5.
Fig. 5.. TRH cell generation requires B cells and T cell—intrinsic Bcl6.
(A to C) Mice were treated with PBS or anti-CD20 starting 1 week before PR8 infection and euthanized 30 days later. Representative flow cytometry plot of NP-specific T cells (A) frequency of TRH (B) and total number of NP-specific TRM1 and TRH cells (C). (D and E) Irradiated mice were reconstituted with Bcl6ΔCD4 (CD45.2) and WT (CD45.1) bone marrow cells. Mice were infected with PR8 and euthanized 30 days later. (D) NP-specific T cells in control and Bcl6-deficient subsets. (E) Bcl6ΔCD4:wild-type ratio in CD4+ T cells after reconstitution from blood (before infection), TRM1, and TRH. Thin lines represent mean in (B) and (C) (n = 10, pooled from two experiments) and (E) (n = 15, pooled from three experiments). Significance was determined by unpaired Student’s t test. P values are as follows: **P < 0.01 and ****P < 0.0001.
Fig. 6.
Fig. 6.. CD4+ TRH cells localize in lung B cell clusters.
(A) Representative X40 immunofluorescence confocal images from T-bet—ZsGreen and Bcl6-RFP reporter mice, 30 to 60 days after infection, stained with the indicated markers. Scale bars, 200 μm. (B) Quantified representations of segmented CD4+ objects, showing iBALT location, log mean TF intensity per object, and location of Tbethi (above) or Bcl6hi (below) objects. (C) Count of Tbethi and Bcl6hi CD4+ T cell objects inside B220+ iBALT clusters, normalized by iBALT volume, analyzed by Mann-Whitney-Wilcoxon test. Segmentation performed in Imaris (left) or with machine learning algorithm (right). Each dot represents one iBALT. n = 2 mice per condition. (D) Count of Tbethi and Bcl6hi CD4+ T cell objects outside B220+ iBALT clusters, normalized by tissue volume less iBALT volume, analyzed by Mann-Whitney-Wilcoxon test. Segmentation performed in Imaris. Each dot represents one tissue slice. n = 2 mice per condition. P values are as follows: ***P < 0.001 and ****P < 0.0001.
Fig. 7.
Fig. 7.. Maintenance of TRH cells requires antigen presentation.
(A and B) Histograms and frequency of BrdU+ cells in NP-specific (A) and CD44+ (B) lung-resident and circulating cells at day 65 after PR8 infection. (C) Frequency of BrdU+ cells in TRM1 and TRH. (D) Infected MHC-IIfl/fl and MHC-IIΔUBC-ERT2 mice were analyzed 1 week after inducible deletion. (E and F) Flow cytometry plots (E) and TRH frequency (F) in MHC-IIfl/fl and MHC-IIΔUBC-ERT2 mice. (G and H) Total number of NP-specific TRM1 and TRH from infected MHC-IIfl/fl and MHC-IIΔUBC-ERT2 mice that were treated with tamoxifen starting at days 40 to 50 (G) or day 100 (H) after infection and analyzed 1 week later. Data in (A) to (C) were analyzed by paired t tests (n = 5, representing three experiments). Data in (F) to (H) were analyzed by unpaired Student’s t test (n = 3 to 6, representing two experiments). Thin lines represent mean. P values are as follows: *P < 0.05, **P < 0.01, and ****P < 0.0001.
Fig. 8.
Fig. 8.. TRH cells are plastic and promote local antibody production during re-infection with the X31 influenza strain.
(A and B) scRNA-seq analysis from lung day 30. (A) PHATE dimensionality reduction used as input to slingshot trajectory inference. PHATE colored by cluster (left) and pseudotime (right). (B) Imputed expression of selected genes across pseudotime and two trajectories. (C to F) Representative plots of FR4+ cells in rechallenged TRM1 and TRH recipients in lung at day 9 (C), frequencies in (D), at day 20 (E), and frequencies in (F). (G) Total numbers of NP-specific TRM1 and TRH. (H) Count of CD4+ T cell objects inside B220+ iBALT clusters, normalized by iBALT volume, and analyzed by Mann-Whitney-Wilcoxon test. Imaris segmentation. Each dot represents one iBALT. (I) Count of iBALT-external CD4+ T cell objects across all images, normalized by total tissue volume less iBALT volume. n = 2 mice. (J) PR8-infected, tamoxifen-treated Bcl6flox/flox, and Bcl6ΔCD4-ERT2 memory mice were treated with FTY720 and α-CD8 before X31 rechallenge and analyzed 4 days later. (K) Number of NP-specific IgG antibody-secreting cells (ASC) per mouse lung. Data in (D) (n = 6, pooled from two experiments), (F) (n = 6 to 8, pooled from two experiments), (G) (n = 11 to 12, pooled from three experiments), and (K) (n = 4 to 7, representing two experiments) were analyzed by unpaired Student’s t test. Thin lines represent mean. P values are as follows: *P < 0.05, **P < 0.01, ***P < 0.001, and ****P < 0.0001.

Comment in

Similar articles

Cited by

References

    1. Palache A, Abelin A, Hollingsworth R, Cracknell W, Jacobs C, Tsai T, Barbosa P; IFPMA Influenza Vaccine Supply (IFPMA IVS) task force, Survey of distribution of seasonal influenza vaccine doses in 201 countries (2004-2015): The 2003 World Health Assembly resolution on seasonal influenza vaccination coverage and the 2009 influenza pandemic have had very little impact on improving influenza control and pandemic preparedness. Vaccine 35, 4681–4686 (2017). - PubMed
    1. Sambhara S, Kurichh A, Miranda R, Tumpey T, Rowe T, Renshaw M, Arpino R, Tamane A, Kandil A, James O, Underdown B, Klein M, Katz J, Burt D, Heterosubtypic immunity against human influenza A viruses, including recently emerged avian H5 and H9 viruses, induced by FLU-ISCOM vaccine in mice requires both cytotoxic T-lymphocyte and macrophage function. Cell. Immunol. 211,143–153 (2001). - PubMed
    1. Tumpey TM, Renshaw M, Clements JD, Katz JM, Mucosal delivery of inactivated influenza vaccine induces B-cell-dependent heterosubtypic cross-protection against lethal influenza A H5N1 virus infection. J. Virol. 75, 5141–5150 (2001). - PMC - PubMed
    1. Rangel-Moreno J, Carragher DM, Misra RS, Kusser K, Hartson L, Moquin A, Lund FE, Randall TD, B cells promote resistance to heterosubtypic strains of influenza via multiple mechanisms. J. Immunol. 180, 454–463 (2007). - PMC - PubMed
    1. Zens KD, Chen JK, Guyer RS, Wu FL, Cvetkovski F, Miron M, Farber DL, Reduced generation of lung tissue-resident memory T cells during infancy. J. Exp. Med. 214, 2915–2932 (2017). - PMC - PubMed

Publication types

MeSH terms

Substances