. 2021 Jan 8;6(55):eabb6852.
doi: 10.1126/sciimmunol.abb6852.

Tissue-resident CD4+ T helper cells assist the development of protective respiratory B and CD8+ T cell memory responses

Affiliations

Tissue-resident CD4+ T helper cells assist the development of protective respiratory B and CD8+ T cell memory responses

Young Min Son et al. Sci Immunol. .

Abstract

Much remains unknown about the roles of CD4+ T helper cells in shaping localized memory B cell and CD8+ T cell immunity in the mucosal tissues. Here, we report that lung T helper cells provide local assistance for the optimal development of tissue-resident memory B and CD8+ T cells after the resolution of primary influenza virus infection. We have identified a population of T cells in the lung that exhibit characteristics of both follicular T helper and TRM cells, and we have termed these cells as resident helper T (TRH) cells. Optimal TRH cell formation was dependent on transcription factors involved in T follicular helper and resident memory T cell development including BCL6 and Bhlhe40. We show that TRH cells deliver local help to CD8+ T cells through IL-21-dependent mechanisms. Our data have uncovered the presence of a tissue-resident helper T cell population in the lung that plays a critical role in promoting the development of protective B cell and CD8+ T cell responses.


Conflict of interest statement

Competing interests: The authors declare that they have no competing interests.

Figures
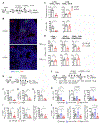
Fig. 1.
Fig. 1.. Lung CD4+ T cells deliver localized help to B and CD8+ T cells.
(A to D) WT mice were infected with PR8 strain of influenza virus and treated with control (Ctl) IgG or α-CD4 starting at 14 d.p.i. Mice were injected with α-CD45 intravenously 5 min before sacrifice at 42 d.p.i. (A) Experimental scheme. (B) Representative confocal images of iBALT in the lung. Lung sections were stained with α-CD4 (red), α-B220 (green), and DAPI (blue). (C) Frequencies and cell number of influenza HA-B cells in the lung tissue or blood vessels. (D) Lung tissue CD8+, CD8+CD69+, or CD8+CD69+CD103+ NP366–374 or PA224–233 TRM cells were enumerated. (E to I) WT mice were infected with PR8 and treated with Ctl IgG or α-CD4 (starting at 14 d.p.i.) in the presence of daily injection of FTY720 (starting at 13 d.p.i.). (E) Schematic of experimental design. (F) BGC, (G) total HA-B (CD45i.v.HA-B), or (H) HA-BRM cells were enumerated by flow cytometry. (I) Lung tissue CD8+, CD8+CD69+, or CD8+CD69+CD103+ NP366–374 TRM cells were enumerated. (J to L) WT mice were infected with PR8 and received Ctl IgG and high or low dose of α-CD4. (J) Experimental scheme. (K) Cell number of BGC, HA-BRM, or NP-BRM cells in the lung tissue. (L) Lung parenchymal CD8+, CD8+CD69+, or CD8+CD69+CD103+ NP366–374 TRM cells were enumerated. In (B) to (D) were the representative data from at least two independent experiments (four to five mice per group). In (F), (G), and (I) to (L), data were pooled from two (F to G and I) or three (K and L) independent experiments (two to five mice per group). P values were calculated by unpaired two-tailed Student’s t test in (C), (D), and (F) to (I). P values in (J) and (K) were analyzed by one-way ANOVA. Data are means ± SEM. *P < 0.05, **P < 0.01, and ***P < 0.001. n.s., not significant.
Fig. 2.
Fig. 2.. Identification of a population of TFH-like cells in the lung tissue.
WT (A to E) or IL-21-VFP reporter (F) mice were infected with PR8. (A) t-Distributed stochastic neighbor embedding (tSNE) plot of scRNA-seq analysis of sorted lung CD45i.v.CD4+CD44Hi cells (pooled from five mice) at 28 d.p.i. (B) Heat map of indicated genes in each cluster from scRNA-seq data. (C) Kinetics of the percentages of PD-1HiFR4Hi population in lung tissue, total CD4+, or influenza NP-specific (NP311–325) CD4+ T cells. (D) Expression of TFH cell–associated markers in lung total or influenza-specific PD-1HiFR4Hi, PD-1LowFR4Low, or splenic TFH (CD4+CD44HiPD-1+CXCR5+) cells at 28 d.p.i. (E) Frequency positive for IFN-γ, IL-17, or IL-4 by lung PD-1HiFR4Hi, PD-1LowFR4Low, or spleen TFH cells were identified by intracellular staining at 28 d.p.i. (F) IL-21-VFP expression in lung CD4+ PD-1HiFR4Hi, PD-1LowFR4Low, or spleen TFH at 28 d.p.i. In (C) to (F), representative plots, histograms, and graphs were collected from at least two independent experiments (two to four mice per group). P values in (E) and (F) were analyzed by one-way ANOVA. Data are means ± SEM. *P < 0.05, **P < 0.01, ***P < 0.001, and ****P < 0.0001.
Fig. 3.
Fig. 3.. Transcriptional profiling reveals PD-1HiFR4Hi cells exhibit both TFH and TRM gene signatures.
(A to F) WT mice were infected with PR8. Lung PD-1HiFR4Hi or PD-1LowFR4Low CD4+ T cells and splenic TFH or non-TFH cells were sorted after exclusion of GITRHi Treg cells, and RNA-seq analysis was performed at 28 d.p.i. (A) Heatmap of DEGs among lung PD-1HiFR4Hi, PD-1LowFR4Low CD4+ T cells, and splenic TFH or non-TFH cells. (B) Principal component analysis (PCA) of RNA-seq data of lung PD-1HiFR4Hi, PD-1LowFR4Low CD4+ T cells, and splenic TFH or non-TFH cells. (C) Volcano plot of RNA-seq analysis of lung PD-1HiFR4Hi or PD-1 LowFR4Low CD4+ T cells. (D) GSEA of the core TFH signature genes in lung CD4+ PD-1HiFR4Hi and CD4+ PD-1LowFR4Low cells. (E) Volcano plot of RNA-seq analysis on lung PD-1HiFR4Hi CD4+ T and splenic TFH cells. (F) GSEA of the core tissue residency signature genes of TRM cells in lung PD-1HiFR4Hi and splenic TFH cells. (G and H) WT mice were infected with PR8. Lung PD-1HiFR4Hi or PD-1LowFR4Low CD4+ T cells and splenic TFH cells were sorted at 28 d.p.i. Nanostring analysis on 560 immune-associated genes was performed. The expression of TFH-associated genes (G) or tissue residency–associated genes (H) in the three cell populations was depicted. For RNA-seq, data were from duplicates of pooled samples (n = 15). For nanostring analysis, data were from pooled samples (n = 10). ES, enrichment score; NES, normalized enrichment score; FDR, false discovery rate.
Fig. 4.
Fig. 4.. Lung PD1HiFR4Hi CD4+ T cells are tissue resident.
(A) WT mice were infected with PR8. The expression of CD69, CXCR6, and Bhlhe40 in lung CD4+ PD-1HiFR4Hi, CD4+ PD-1LowFR4Low NP311–325 T cells, or splenic TFH cells at 28 d.p.i. (B to E) CD45.1+ (host) or CD45.1+ CD45.2+ (partner) WT mice were infected with PR8. Parabiosis surgery was performed at 21 d.p.i. Mice were euthanized 14 days later for analysis. (B) Schematic of parabiosis experiments. (C) Composition of Host-derived or Partner-derived CD4+ T cells in the spleen of the parabionts. (D) Frequencies of Host-derived or Partner-derived cells in the lung PD-1HiFR4Hi or PD-1LowFR4Low total CD4+ T cell compartment. (E) Frequencies of Host-derived or Partner-derived cells in influenza-specific lung CD4+ PD-1HiFR4Hi or CD4+ PD-1LowFR4Low NP311–325 T cell compartment. In (A), the representative histograms were from at least two independent experiments (three to four mice per group). In (C) to (E), parabiosis data were pooled from two different experiments. P values were calculated by one-way ANOVA in (D) and (E). Data are means ± SEM. **P < 0.01, ***P < 0.001, and ****P < 0.0001.
Fig. 5.
Fig. 5.. Both BCL6 and Bhlhe40 are required for optimal lung TRH cell responses.
(A to D) Bcl6fl/fl or Bcl6ΔT mice were infected with PR8. (A) Representative dot plot, (B) frequencies, and (C) cell numbers of TRH or non-TRH in lung CD45i.v. total CD4+ or CD45i.v. influenza-specific CD4+ NP311–325 T cells at 28 d.p.i. (D) Frequencies (top) or cell numbers (bottom) of splenic total TFH or NP311–325 TFH at 28 d.p.i. (E) GSEA of the Bhlhe40-associated genes in lung TRH (PD-1HiFR4Hi) and spleen TFH cells. (F to H) Bhlhe40fl/fl or Bhlhe40ΔT mice were infected with PR8. (F) Representative dot plot, (G) frequencies (top), or cell numbers (bottom) of lung NP311–325 TRH or non-TRH cells at 28 d.p.i. (H) Active caspase 3/7–fluorochrome-labeled inhibitors of caspases (FLICA)+ cells in lung NP311–325 TRH or non-TRH cells at 28 d.p.i. In (A) to (D) and (F) to (G), data were pooled from two independent experiments (three to four mice per group). In (H), representative data were from at least two independent experiments (four mice per group). P values were calculated by unpaired two-tailed Student’s t test. Data are means ± SEM. *P < 0.05, **P < 0.01, ***P < 0.001, and ****P < 0.0001.
Fig. 6.
Fig. 6.. TRH cells are required for the development of lung protective CD8+ TRM and B cell immunity.
(A to J) Bcl6fl/fl or Bcl6ΔCD4ERT2 mice were infected with PR8. (A to E) Tamoxifen was administrated daily (12 to 16 d.p.i.) in the presence of daily FTY720 administration (11 to 34 d.p.i.). (A) Schematic of experimental design. Cell numbers of (B) BGC, (C) HA-BRM, (D) NP-BRM, (E) CD8+CD69+ NP366–374 TRM, or CD8+CD69+ PA224–233 TRM at 35 d.p.i. (F to J) Tamoxifen was administrated daily from 21 to 25 d.p.i. in the presence of daily FTY720 administration (20 to 41 d.p.i.). (F) Schematic of experimental design. Cell numbers of (G) BGC, (H) HA-BRM, (I) NP-BRM, (J) CD8+CD69+ NP366–374 TRM, or CD8+CD69+ PA224–233 TRM at 42 d.p.i. (K) Bcl6fl/fl or Bcl6ΔCD4ERT2 mice were infected with X31 strain (H3N2) of influenza. Tamoxifen was administrated daily (12 to 16 d.p.i.) in the presence of daily FTY720 administration (11 to 34 d.p.i.). Representative dot plot (left) and cell numbers (right) of X31 strain-specific BRM or cross-reactive HA-BRM (to H3N2 A/Uruguay/716/07 strain) at 35 d.p.i. (L and M) Bcl6fl/fl (n = 11) or Bcl6ΔCD4ERT2 (n = 15) mice were infected with X31 and administered tamoxifen from 12 to 16 d.p.i. Mice were rechallenged with PR8 at 42 d.p.i. in the presence of FTY720 (starting from 41 days). (L) Schematic of experimental design. (M) Host mortality following PR8 challenge was monitored. (N and O) Bcl6fl/fl or Bcl6ΔCD4ERT2 mice were infected with X31 and administered tamoxifen. Mice were challenged with PR8 at 40 d.p.i. in the presence of FTY720. Lung (N) infectious virus titers and (O) viral gene expression were measured at day 2 post rechallenge. In (A) to (H) and (J) to (K), all data were pooled from two (C, D, G, H, J, and K) or three (B and E) independent experiments (two to five mice per group). In (A) to (O), P values were calculated by unpaired two-tailed Student’s t test. P value of survival study in (M) was calculated by log-rank test. Data are means ± SEM. *P < 0.05, **P < 0.01, and ****P < 0.0001.
Fig. 7.
Fig. 7.. TRH help to CD8+ T cells is IL-21 dependent.
(A) Representative dot plot of IL-21Hi or IL-21Low CD4+ T cells from the IL-21-VFP reporter mice infected with PR8 (28 d.p.i.). (B to E) WT mice were infected PR8 with or without IL-21R blockade through intraperitoneal (i.p.) route starting at 14 d.p.i. in the presence of FTY720 administration (13 to 34 d.p.i.). (B) Experimental scheme. Cell numbers of lung parenchymal (C) BGC, (D) HA-BRM, and (E) CD8+CD69+ NP366–374, or CD8+CD69+ PA224–233 TRM cells. (F to J) WT mice were infected with PR8 with or without IL-21R blockade through intranasal (i.n.) route at 14 d.p.i. (F) Experimental scheme. (G) Frequencies or (H) cell numbers of lung tissue CD8+CD69+ NP366–374 or CD8+CD69+ PA224–233 TRM. (I) Percentage of apoptotic cells were identified by active caspase 3/7-FLICA staining within lung CD8+ NP366–374 TRM or splenic CD8+ NP366–374 TMEM at 28 d.p.i. (J) Representative histogram of BATF expression in lung CD8+ NP366–374 or CD8+ PA224–233 TRM of mice received with Ctl IgG or α-IL21R at 35 d.p.i. FMO, fluorescence minus one control. (K to M) WT mice were infected with PR8 with or without IL-21R blockade in the presence of FTY720. Mice were challenged with X31 at 40 d.p.i. (K) Experimental scheme. (L) Lung infectious virus titer or (M) viral gene expression were measured at day 2 after rechallenge. In (A) and (I) to (M), representative data were from at least two independent experiments (four to five mice per group). In (C), (E), and (G) to (H), data were pooled from two independent experiments (three to five mice per group). P values of all experiments were calculated by unpaired two-tailed Student’s t test. Data are means ± SEM. *P < 0.05, **P < 0.01, and ***P < 0.001.

Comment in

Similar articles

Cited by

References

    1. Onodera T, Takahashi Y, Yokoi Y, Ato M, Kodama Y, Hachimura S, Kurosaki T, Kobayashi K, Memory B cells in the lung participate in protective humoral immune responses to pulmonary influenza virus reinfection. Proc. Natl. Acad. Sci. U.S.A 109, 2485–2490 (2012). - PMC - PubMed
    1. Schenkel JM, Masopust D, Tissue-resident memory T cells. Immunity 41, 886–897 (2014). - PMC - PubMed
    1. Mueller SN, Mackay LK, Tissue-resident memory T cells: Local specialists in immune defence. Nat. Rev. Immunol. 16, 79–89 (2016). - PubMed
    1. Milner JJ, Goldrath AW, Transcriptional programming of tissue-resident memory CD8(+) T cells. Curr. Opin. Immunol. 51, 162–169 (2018). - PMC - PubMed
    1. Allie SR, Bradley JE, Mudunuru U, Schultz MD, Graf BA, Lund FE, Randall TD, The establishment of resident memory B cells in the lung requires local antigen encounter. Nat. Immunol. 20, 97–108 (2019). - PMC - PubMed

Publication types

MeSH terms

Substances