

Influenza virus infection increases ACE2 expression and shedding in human small airway epithelial cells
- PMID: 33419885
- PMCID: PMC8378143
- DOI: 10.1183/13993003.03988-2020
Influenza virus infection increases ACE2 expression and shedding in human small airway epithelial cells
Abstract
Background: Patients with coronavirus disease 2019 (COVID-19) caused by severe acute respiratory syndrome coronavirus 2 (SARS-CoV-2) demonstrate high rates of co-infection with respiratory viruses, including influenza A (IAV), suggesting pathogenic interactions.
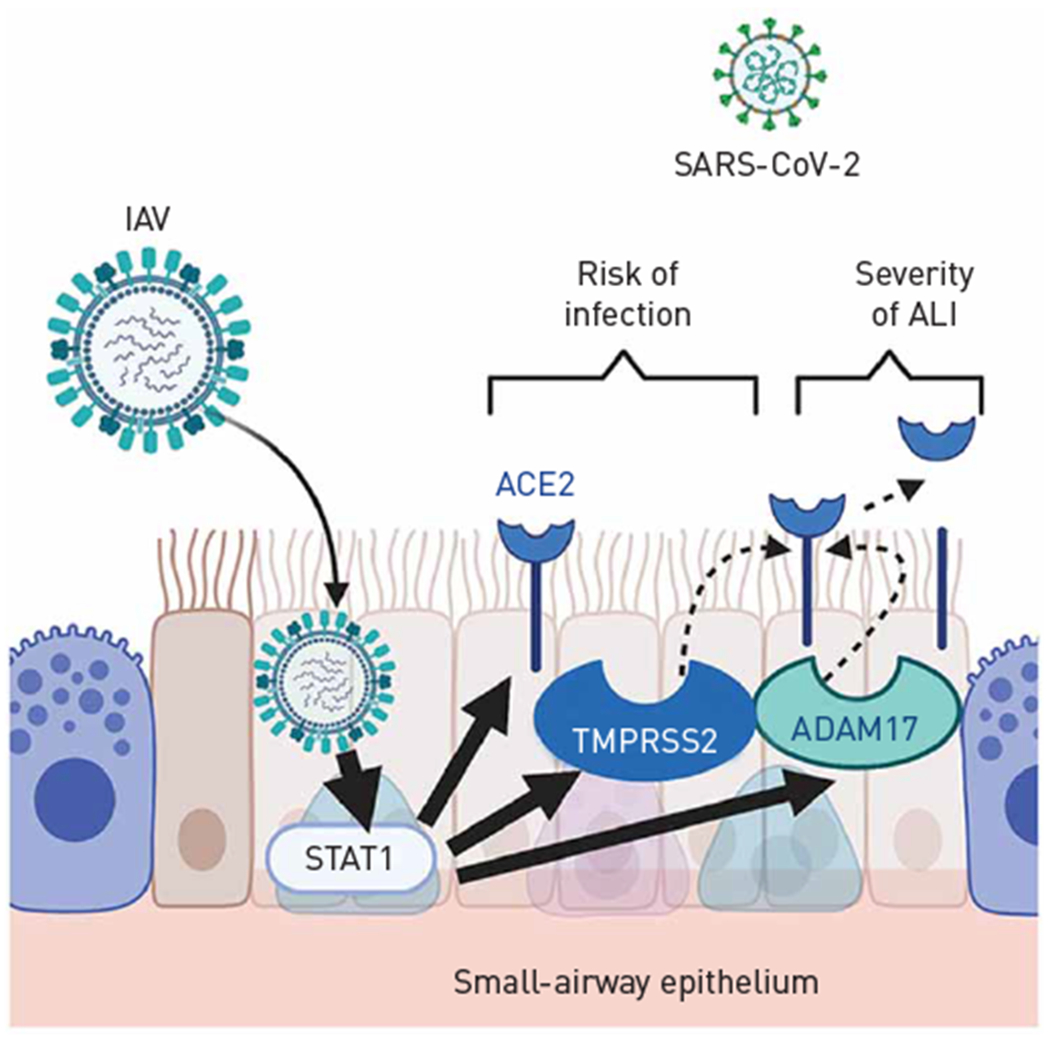
Methods: We investigated how IAV may increase the risk of COVID-19 lung disease, focusing on the receptor angiotensin-converting enzyme (ACE)2 and the protease TMPRSS2, which cooperate in the intracellular uptake of SARS-CoV-2.
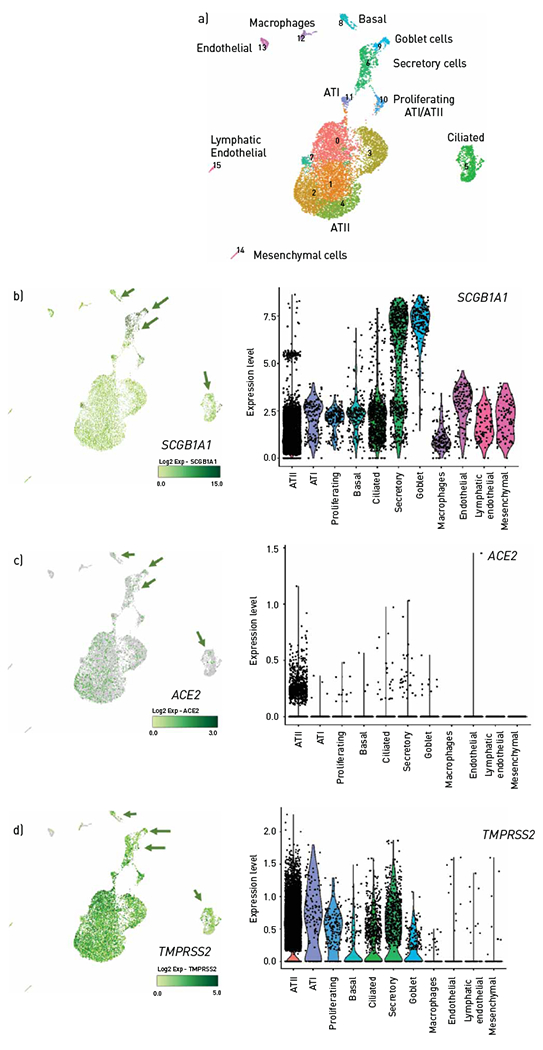
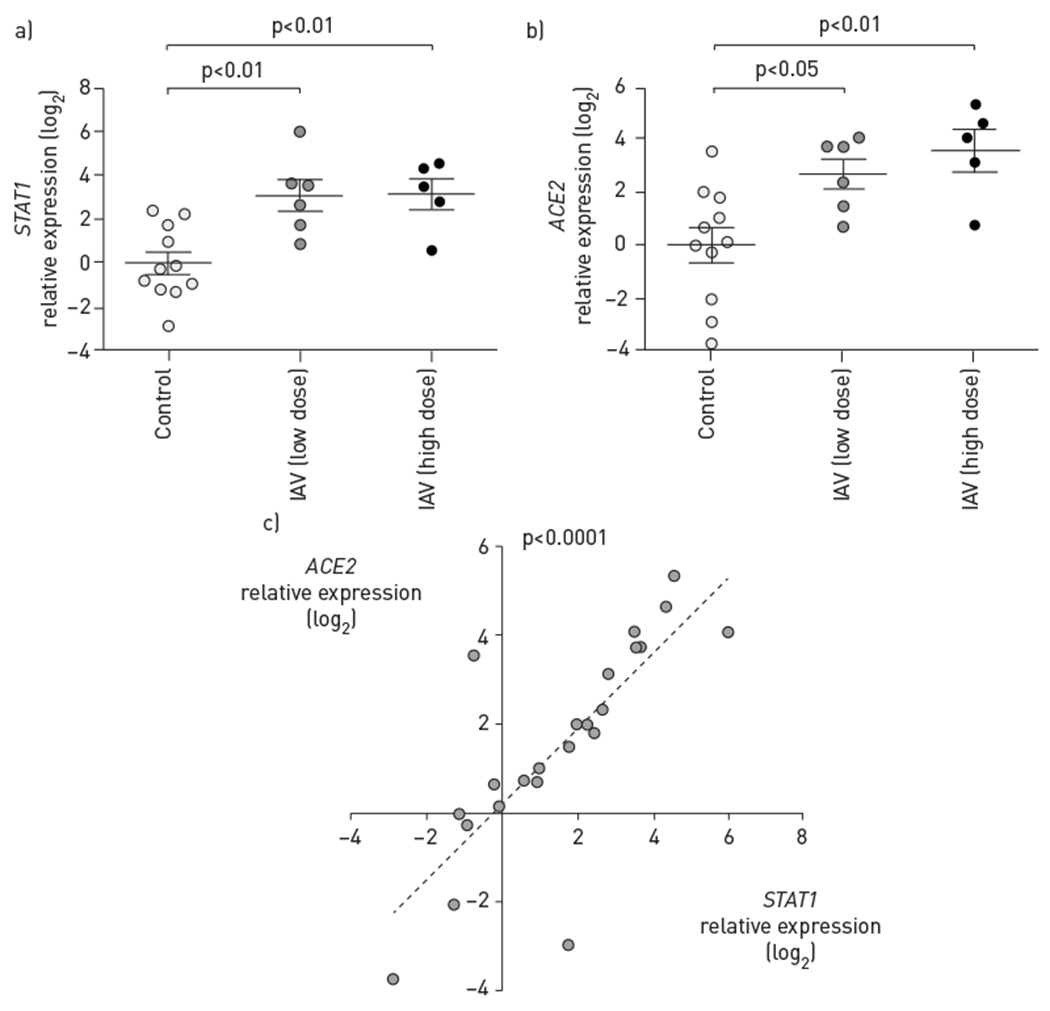
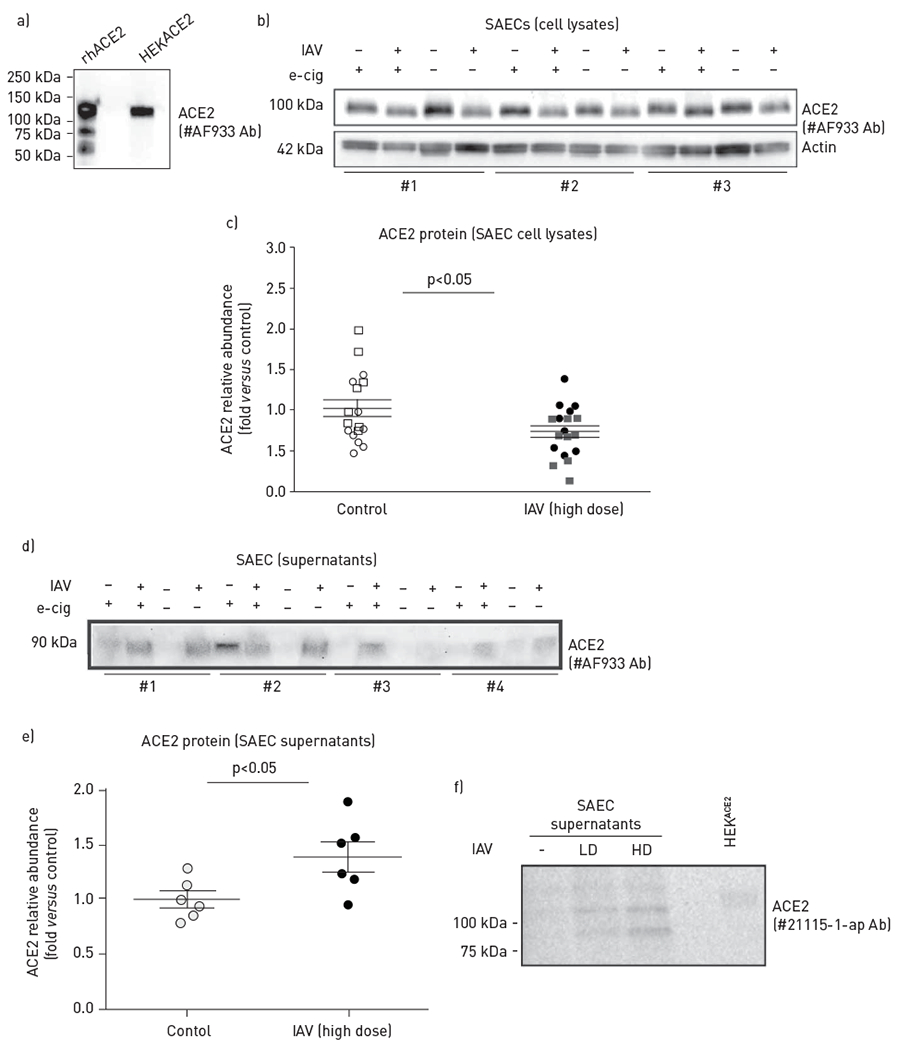
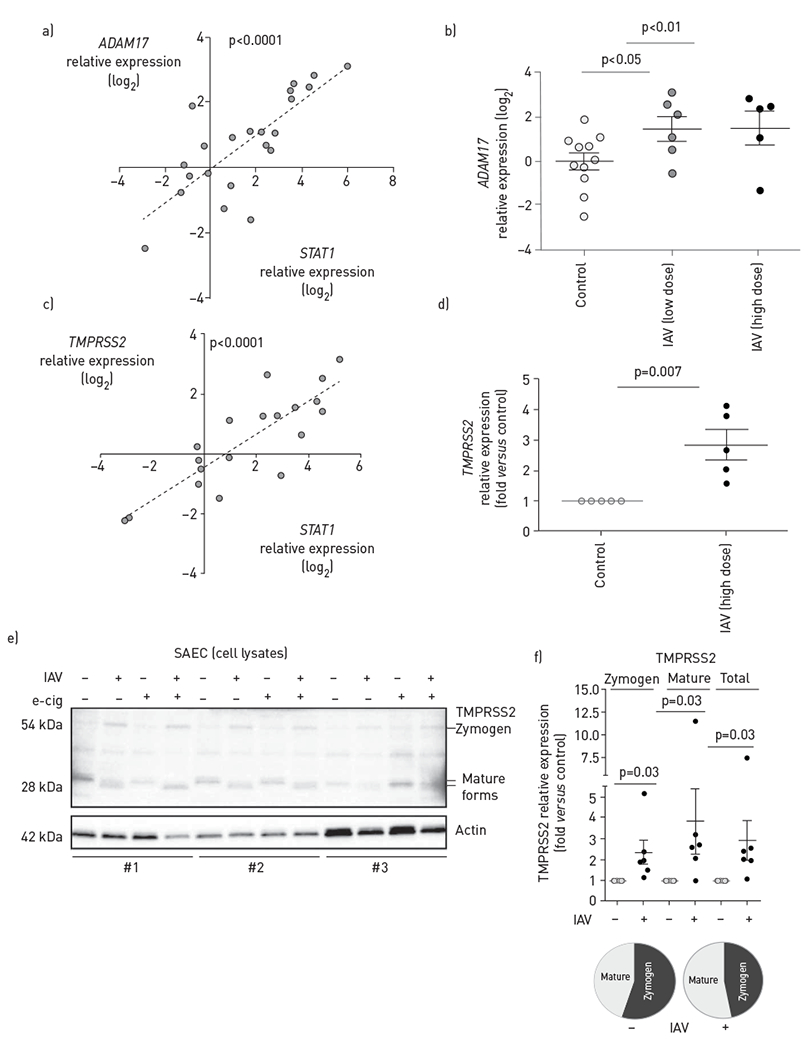
Results: We found, using single-cell RNA sequencing of distal human nondiseased lung homogenates, that at baseline, ACE2 is minimally expressed in basal, goblet, ciliated and secretory epithelial cells populating small airways. We focused on human small airway epithelial cells (SAECs), central to the pathogenesis of lung injury following viral infections. Primary SAECs from nondiseased donor lungs apically infected (at the air-liquid interface) with IAV (up to 3×10⁵ pfu; ∼1 multiplicity of infection) markedly (eight-fold) boosted the expression of ACE2, paralleling that of STAT1, a transcription factor activated by viruses. IAV increased the apparent electrophoretic mobility of intracellular ACE2 and generated an ACE2 fragment (90 kDa) in apical secretions, suggesting cleavage of this receptor. In addition, IAV increased the expression of two proteases known to cleave ACE2, sheddase ADAM17 (TACE) and TMPRSS2 and increased the TMPRSS2 zymogen and its mature fragments, implicating proteolytic autoactivation.
Conclusion: These results indicate that IAV amplifies the expression of molecules necessary for SARS-CoV-2 infection of the distal lung. Furthermore, post-translational changes in ACE2 by IAV may increase vulnerability to lung injury such as acute respiratory distress syndrome during viral co-infections. These findings support efforts in the prevention and treatment of influenza infections during the COVID-19 pandemic.
Copyright ©ERS 2021. For reproduction rights and permissions contact permissions@ersnet.org.
Conflict of interest statement
Conflict of interest: K.S. Schweitzer has nothing to disclose. Conflict of interest: T. Crue has nothing to disclose. Conflict of interest: J.M. Nall has nothing to disclose. Conflict of interest: D. Foster has nothing to disclose. Conflict of interest: S. Sajuthi has nothing to disclose. Conflict of interest: K.A. Correll has nothing to disclose. Conflict of interest: M. Nakamura has nothing to disclose. Conflict of interest: J.L. Everman has nothing to disclose. Conflict of interest: G.P. Downey has nothing to disclose. Conflict of interest: M.A. Seibold reports grants from NIH (U01 HL138626, R01 HL135156, R01 MD010443, R01 HL128439, P01 HL132821, P01 HL107202, R01 HL117004), during the conduct of the study. Conflict of interest: J.P. Bridges has nothing to disclose. Conflict of interest: K.A. Serban has nothing to disclose. Conflict of interest: H.W. Chu has nothing to disclose. Conflict of interest: I. Petrache has nothing to disclose.
Figures
Similar articles
-
ACE2 acts as a novel regulator of TMPRSS2-catalyzed proteolytic activation of influenza A virus in airway cells.J Virol. 2024 Apr 16;98(4):e0010224. doi: 10.1128/jvi.00102-24. Epub 2024 Mar 12. J Virol. 2024. PMID: 38470058 Free PMC article.
-
Gene expression and in situ protein profiling of candidate SARS-CoV-2 receptors in human airway epithelial cells and lung tissue.Eur Respir J. 2020 Sep 3;56(3):2001123. doi: 10.1183/13993003.01123-2020. Print 2020 Sep. Eur Respir J. 2020. PMID: 32675206 Free PMC article.
-
Single-cell analysis of SARS-CoV-2 receptor ACE2 and spike protein priming expression of proteases in the human heart.Cardiovasc Res. 2020 Aug 1;116(10):1733-1741. doi: 10.1093/cvr/cvaa191. Cardiovasc Res. 2020. PMID: 32638018 Free PMC article.
-
Angiotensin-converting enzyme 2 (ACE2), SARS-CoV-2 and the pathophysiology of coronavirus disease 2019 (COVID-19).J Pathol. 2020 Jul;251(3):228-248. doi: 10.1002/path.5471. Epub 2020 Jun 10. J Pathol. 2020. PMID: 32418199 Free PMC article. Review.
-
Angiotensin-Converting Enzyme 2: SARS-CoV-2 Receptor and Regulator of the Renin-Angiotensin System: Celebrating the 20th Anniversary of the Discovery of ACE2.Circ Res. 2020 May 8;126(10):1456-1474. doi: 10.1161/CIRCRESAHA.120.317015. Epub 2020 Apr 8. Circ Res. 2020. PMID: 32264791 Free PMC article. Review.
Cited by
-
P38 MAPK activated ADAM17 mediates ACE2 shedding and promotes cardiac remodeling and heart failure after myocardial infarction.Cell Commun Signal. 2023 Apr 12;21(1):73. doi: 10.1186/s12964-023-01087-3. Cell Commun Signal. 2023. PMID: 37046278 Free PMC article.
-
Surveillance of Influenza and Other Airborne Transmission Viruses during the 2021/2022 Season in Hospitalized Subjects in Tuscany, Italy.Vaccines (Basel). 2023 Mar 31;11(4):776. doi: 10.3390/vaccines11040776. Vaccines (Basel). 2023. PMID: 37112687 Free PMC article.
-
A Game of Infection - Song of Respiratory Viruses and Interferons.Front Cell Infect Microbiol. 2022 Jun 29;12:937460. doi: 10.3389/fcimb.2022.937460. eCollection 2022. Front Cell Infect Microbiol. 2022. PMID: 35846766 Free PMC article. Review.
-
The Impact of Coronavirus Disease 2019 on Viral, Bacterial, and Fungal Respiratory Infections.Clin Chest Med. 2023 Jun;44(2):407-423. doi: 10.1016/j.ccm.2022.11.018. Epub 2023 Feb 26. Clin Chest Med. 2023. PMID: 37085229 Free PMC article. Review.
-
SARS-CoV-2 versus other minor viral infection on kidney injury in asymptomatic and mildly symptomatic patients.Virulence. 2022 Dec;13(1):1349-1357. doi: 10.1080/21505594.2022.2107602. Virulence. 2022. PMID: 35924838 Free PMC article. Review.
References
-
- Khodamoradi Z, Moghadami M, Lotfi M. Co-infection of coronavirus disease 2019 and influenza A: a report from Iran. Arch Iran Med 2020; 23: 239–243. - PubMed
Publication types
MeSH terms
Substances
Grants and funding
- P01 HL107202/HL/NHLBI NIH HHS/United States
- R01 HL157424/HL/NHLBI NIH HHS/United States
- R01 HL132950/HL/NHLBI NIH HHS/United States
- R01 HL135156/HL/NHLBI NIH HHS/United States
- T32 HL007085/HL/NHLBI NIH HHS/United States
- R01 HL128439/HL/NHLBI NIH HHS/United States
- R01 HL117004/HL/NHLBI NIH HHS/United States
- R01 HL144396/HL/NHLBI NIH HHS/United States
- U19 AI125357/AI/NIAID NIH HHS/United States
- U01 HL138626/HL/NHLBI NIH HHS/United States
- P01 HL132821/HL/NHLBI NIH HHS/United States
- R01 MD010443/MD/NIMHD NIH HHS/United States
LinkOut - more resources
Full Text Sources
Other Literature Sources
Medical
Research Materials
Miscellaneous