. 2021 Feb 12;371(6530):708-712.
doi: 10.1126/science.abf2946. Epub 2021 Jan 8.

Establishment and lineage dynamics of the SARS-CoV-2 epidemic in the UK

Affiliations

Establishment and lineage dynamics of the SARS-CoV-2 epidemic in the UK

Louis du Plessis et al. Science. .

Abstract

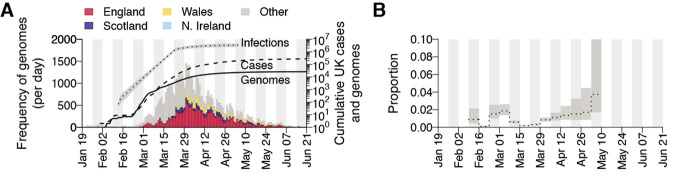
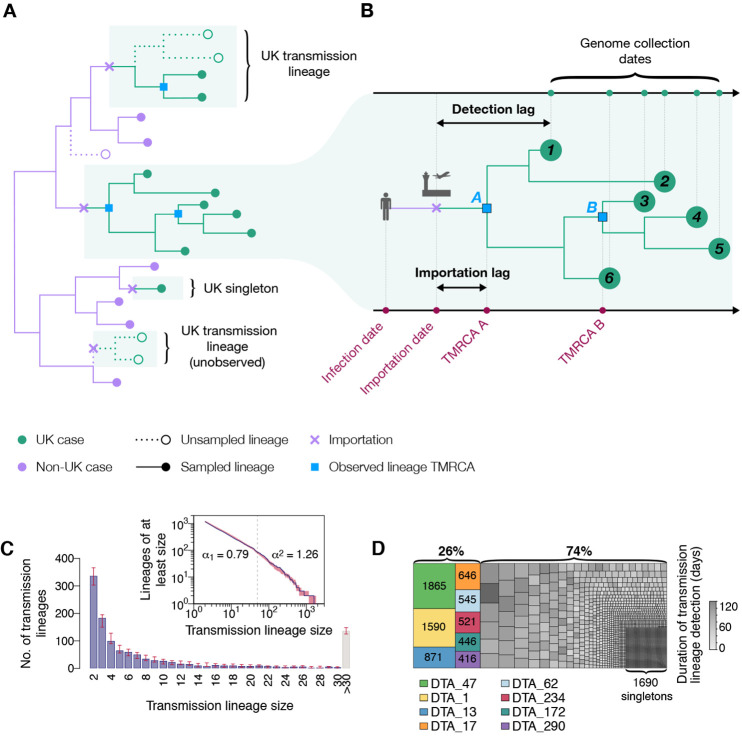
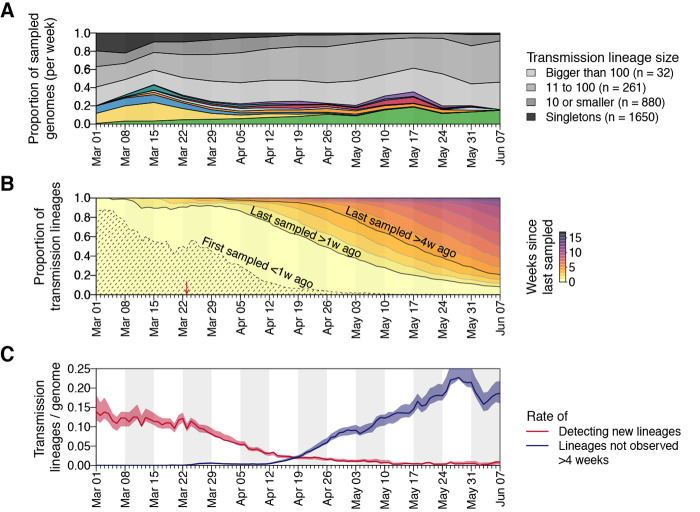
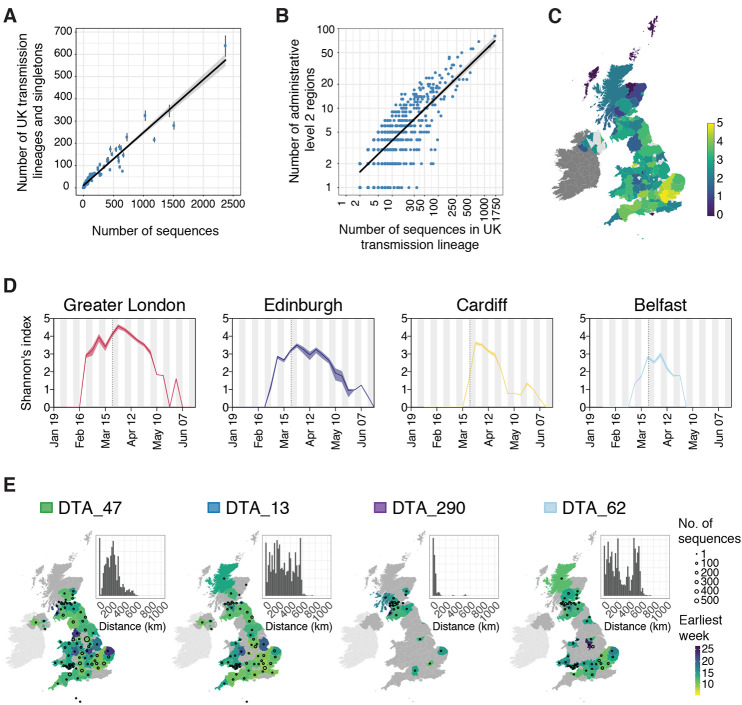
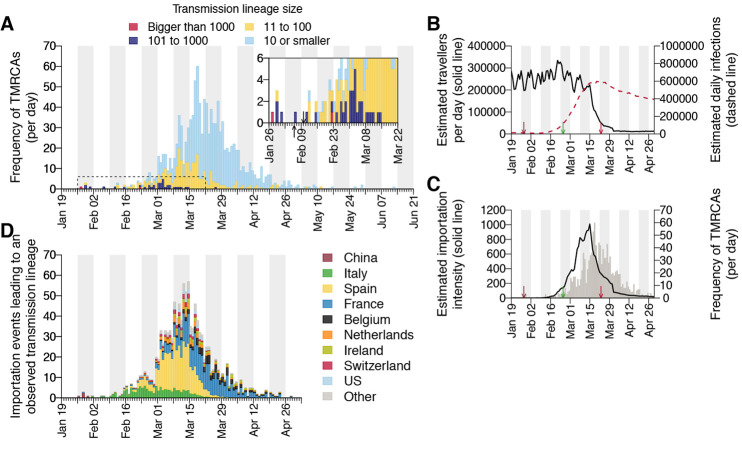
The United Kingdom's COVID-19 epidemic during early 2020 was one of world's largest and was unusually well represented by virus genomic sampling. We determined the fine-scale genetic lineage structure of this epidemic through analysis of 50,887 severe acute respiratory syndrome coronavirus 2 (SARS-CoV-2) genomes, including 26,181 from the UK sampled throughout the country's first wave of infection. Using large-scale phylogenetic analyses combined with epidemiological and travel data, we quantified the size, spatiotemporal origins, and persistence of genetically distinct UK transmission lineages. Rapid fluctuations in virus importation rates resulted in >1000 lineages; those introduced prior to national lockdown tended to be larger and more dispersed. Lineage importation and regional lineage diversity declined after lockdown, whereas lineage elimination was size-dependent. We discuss the implications of our genetic perspective on transmission dynamics for COVID-19 epidemiology and control.


Figures

Fig. 1
Fig. 1. Genomic sequence data.
(A) Collection dates of the 50,887 genomes analyzed here (left-hand axis). Genomes are colored by sampling location (England = red, Scotland = dark blue, Wales = yellow, Northern Ireland = light blue, elsewhere = grey). The solid line shows the cumulative number of UK virus genomes (right-hand axis). The dashed and dotted lines show, respectively, the cumulative number of laboratory-confirmed UK cases (by specimen date) and the estimated number of UK infections (18); grey shading = 95% CI; right-hand axis). Due to retrospective screening, the cumulative number of genomes early in the epidemic exceeds that of confirmed cases. (B) Proportion of weekly estimated UK infections (18) included in our genome sequence dataset.
Fig. 2
Fig. 2. Structure of UK transmission lineages detected through genome sampling.
(A) Figurative illustration of the international context of UK transmission lineages. Note only half of the cases in the top UK transmission lineage are observed and the bottom UK transmission lineage is unobserved. To be detected, a UK transmission lineage must contain two or more sampled genomes; singletons are not classified here as UK transmission lineages. (B) Detailed view of one of the UK transmission lineages from (A), used to illustrate the terms TMRCA, detection lag, and importation lag. The lineage TMRCA is sample-dependent; for example, TMRCA A is observed if genomes 1–6 are sampled and TMRCA B is observed if only genomes 3–5 are sampled. (C) Distribution of UK transmission lineage sizes. Blue bars show the number of transmission lineages of each size (red bars = 95% HPD of these sizes across the posterior tree distribution). Inset: the corresponding cumulative frequency distribution of lineage size (blue line), on double logarithmic axes (red shading = 95% HPD of this distribution across the posterior tree distribution). Values either side of vertical dashed line show coefficients of power-law distributions (P[Xx] ~ x–α) fitted to lineages containing ≤50 (α1) and >50 (α2) virus genomes, respectively. (D) Partition of 26,181 UK genomes into UK transmission lineages and singletons, colored by (i) lineage, for the 8 largest lineages, or (ii) duration of lineage detection (time between the lineage’s oldest and most recent genomes) for the remainder. The sizes of the 8 largest lineages are also shown in the figure.
Fig. 3
Fig. 3. Dynamics of UK transmission lineages.
(A) Lineage size breakdown of UK genomes collected each week. Colors of the 8 largest lineages are as depicted in Fig. 2D. (B) Trends through time in the detection of UK transmission lineages. For each day, all lineages detected up to that day are colored by the time since the transmission lineage was last sampled. Isoclines correspond to weeks. Shaded area = transmission lineages that were first sampled <1 week ago. The red arrow indicates the start of the UK lockdown. (C) Red line = daily rate of detecting new transmission lineages. Blue line = rate at which lineages have not been observed for >4 weeks, shading = 95% HPD across the posterior distribution of trees.
Fig. 4
Fig. 4. Spatial distribution of UK transmission lineages.
(A) Correlation between the number of transmission lineages detected in each region (points = median values, bars = 95% HPD intervals) and the number of UK virus genomes from each region (Pearson’s r = 0.96, 95% CI = 0.95-0.98). (B) Correlation between the spatial range of each transmission lineage and the number of virus genomes it contains (Pearson’s r = 0.8, 95% CI = 0.78-0.82,) (C) Map showing Shannon’s index (SI) for each region, calculated across the study period (2nd Feb-26th Jun). Yellow colors indicate higher SI values and darker colors lower values. (D) SI through time for the UK national capital cities. The dotted lines indicate the start of the UK national lockdown. (E) Illustration of the diverse spatial range distributions of UK transmission lineages. Colors represent the week of the first detected genome in the transmission lineage in each location. Circles show the number of sampled genomes per location. Insets show the distribution of geographic distances for all sequence pairs within the lineage (see data S4 and fig. S12 for further details). Colored boxes next to lineage names are as depicted in Fig. 2D.
Fig. 5
Fig. 5. Dynamics of UK transmission lineage importation.
(A) Histogram of lineage TMRCAs, colored by lineage size. Inset: expanded view of the days prior to UK lockdown. Left-hand arrow = collection date of the UK’s first laboratory-confirmed case; right-hand arrow = collection date of the earliest UK virus genome in our dataset. (B) Estimated number of inbound travellers to the UK per day (black) and estimated number of infectious cases worldwide (dashed red). Arrows here show, from left to right, dates of the first self-isolation advice for returning travellers from China, Italy, and of the start of the UK national lockdown. (C) Estimated importation intensity (EII) curve (black) and the histogram of lineage TMRCAs (grey). (D) Estimated histogram of virus lineage importation events per day, obtained from our lag model. Colors show the proportion attributable each day to inbound travel from various countries (see table S4 and figs. S19 and S20). This assignment is statistical, i.e., we cannot ascribe a specific source location to any given lineage.

Comment in

Similar articles

Cited by

References

    1. Centers for Disease Control and Prevention , Severe acute respiratory syndrome - Singapore, 2003. MMWR Morb. Mortal. Wkly. Rep. 52, 405–411 (2003). - PubMed
    1. Faye O., Boëlle P. Y., Heleze E., Faye O., Loucoubar C., Magassouba N., Soropogui B., Keita S., Gakou T., Bah H. I., Koivogui L., Sall A. A., Cauchemez S., Chains of transmission and control of Ebola virus disease in Conakry, Guinea, in 2014: An observational study. Lancet Infect. Dis. 15, 320–326 (2015). 10.1016/S1473-3099(14)71075-8 - DOI - PMC - PubMed
    1. Kim K. H., Tandi T. E., Choi J. W., Moon J. M., Kim M. S., Middle East respiratory syndrome coronavirus (MERS-CoV) outbreak in South Korea, 2015: Epidemiology, characteristics and public health implications. J. Hosp. Infect. 95, 207–213 (2017). 10.1016/j.jhin.2016.10.008 - DOI - PMC - PubMed
    1. Bahl J., Nelson M. I., Chan K. H., Chen R., Vijaykrishna D., Halpin R. A., Stockwell T. B., Lin X., Wentworth D. E., Ghedin E., Guan Y., Peiris J. S. M., Riley S., Rambaut A., Holmes E. C., Smith G. J. D., Temporally structured metapopulation dynamics and persistence of influenza A H3N2 virus in humans. Proc. Natl. Acad. Sci. U.S.A. 108, 19359–19364 (2011). 10.1073/pnas.1109314108 - DOI - PMC - PubMed
    1. Baillie G. J., Galiano M., Agapow P. M., Myers R., Chiam R., Gall A., Palser A. L., Watson S. J., Hedge J., Underwood A., Platt S., McLean E., Pebody R. G., Rambaut A., Green J., Daniels R., Pybus O. G., Kellam P., Zambon M., Evolutionary dynamics of local pandemic H1N1/2009 influenza virus lineages revealed by whole-genome analysis. J. Virol. 86, 11–18 (2012). 10.1128/JVI.05347-11 - DOI - PMC - PubMed

Publication types