. 2021 Mar 19;59(4):e02292-20.
doi: 10.1128/JCM.02292-20. Print 2021 Mar 19.

Performance Characteristics of the Vidas SARS-CoV-2 IgM and IgG Serological Assays

Affiliations

Performance Characteristics of the Vidas SARS-CoV-2 IgM and IgG Serological Assays

Nathalie Renard et al. J Clin Microbiol. .

Abstract

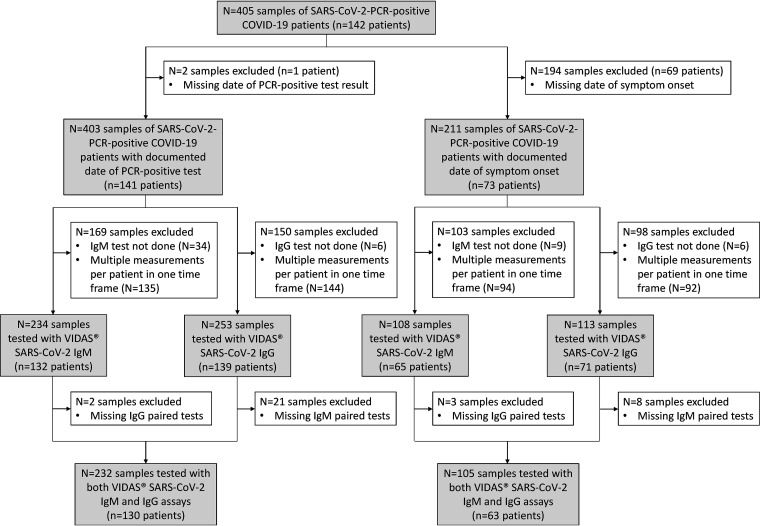
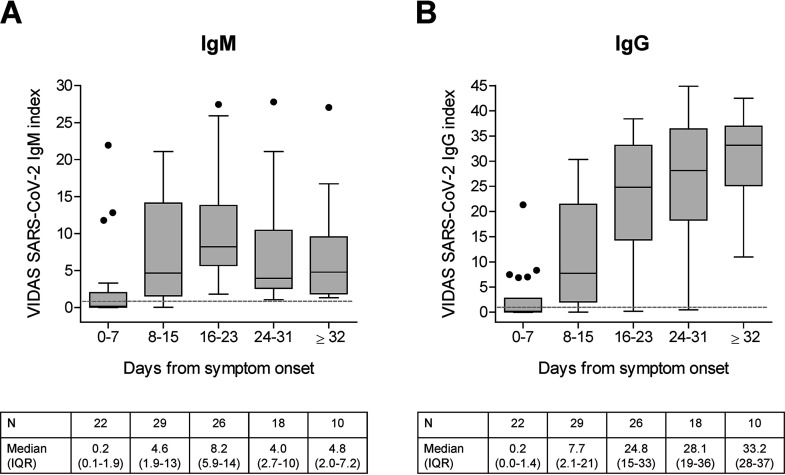
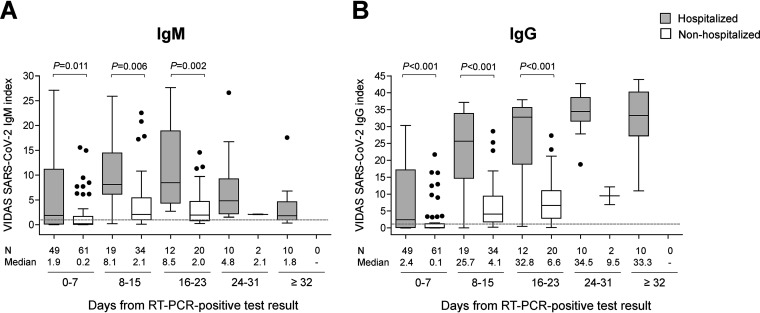
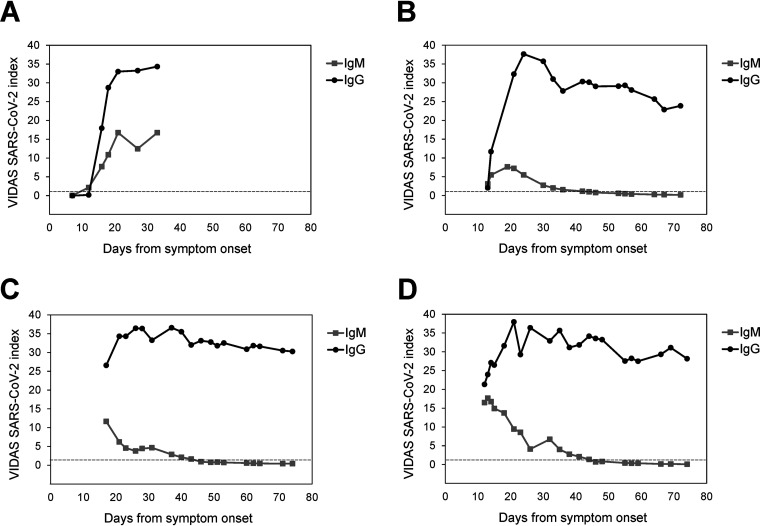
The COVID-19 pandemic, caused by the new severe acute respiratory syndrome coronavirus 2 (SARS-CoV-2), continues to spread worldwide. Serological testing for SARS-CoV-2-specific antibodies plays an important role in understanding and controlling the pandemic, notably through epidemiological surveillance. Well-validated and highly specific SARS-CoV-2 serological assays are urgently needed. We describe here the analytical and clinical performance of Vidas SARS-CoV-2 IgM and Vidas SARS-CoV-2 IgG, two CE-marked, emergency use authorization (EUA)-authorized, automated, qualitative assays for the detection of SARS-CoV-2-specific IgM and IgG, respectively. Both assays showed high within-run and within-laboratory precision (coefficients of variation < 11.0%) and very low cross-reactivity toward sera of patients with a past common coronavirus or respiratory virus infection. Clinical specificity determined on up to 989 prepandemic healthy donors was ≥99% with a narrow 95% confidence interval for both IgM and IgG assays. Clinical sensitivity was determined on up to 232 samples from 130 reverse transcriptase PCR (RT-PCR)-confirmed SARS-CoV-2 patients. The positive percent agreement (PPA) with SARS-CoV-2 PCR reached 100% at ≥16 days (Vidas SARS-CoV-2 IgM) and ≥32 days (Vidas SARS-CoV-2 IgG) of symptom onset. Combined IgM/IgG test results improved the PPA compared to each test alone. SARS-CoV-2 IgG seroconversion followed closely that of SARS-CoV-2 IgM and remained stable over time, while SARS-CoV-2 IgM levels rapidly declined. Interestingly, SARS-CoV-2-specific IgM and IgG responses were significantly higher in COVID-19 hospitalized versus nonhospitalized patients. Altogether, the Vidas SARS-CoV-2 IgM and IgG assays are highly specific and sensitive serological tests suitable for the reliable detection of past acute SARS-CoV-2 infections.

Keywords: COVID-19; SARS-CoV-2; Vidas; diagnosis; immunoserology.


Figures

FIG 1
FIG 1
Study flow diagram. Description of SARS-CoV-2-positive samples used to determine the positive percent agreement relative to the time of RT-PCR positive test result and to the time of symptom onset. The number of and reason for sample exclusion are indicated in the white boxes. Included samples are indicated in the gray boxes. Altogether, out of the 405 collected samples (from 142 SARS-CoV-2-positive patients), 232 samples from 130 patients with a documented date for the SARS-CoV-2-specific PCR positive test and 105 samples from 63 patients with a documented date of symptom onset were tested with both the Vidas SARS-CoV-2 IgM and IgG assays (paired tests).
FIG 2
FIG 2
(A and B) Distribution of IgM (A) and IgG (B) index values obtained using the Vidas SARS-CoV-2 IgM and IgG assays, respectively, in patients confirmed positive for SARS-CoV-2, according to the time from symptom onset. Vidas SARS-CoV-2 IgM and IgG index values of 105 paired tests from 63 SARS-CoV-2-positive patients (Table 4, Table 2, and Fig. 1) are displayed as Tukey box plots according to the time from symptom onset. No more than one patient’s sample is included per time frame. The number of tested samples (N), and the median and interquartile range (IQR) of index values are indicated below each graph. The dashed line shows the positivity cutoff of both assays (i = 1.00).
FIG 3
FIG 3
(A and B) Distribution of IgM (A) and IgG (B) index values obtained using the Vidas SARS-CoV-2 IgM and IgG assays, respectively, in hospitalized versus nonhospitalized patients confirmed positive for SARS-CoV-2, according to the time from PCR-positive result. Out of the 232 paired tests (Table 3), 15 were from patients with an unknown hospitalization status (Table 2) and were thus excluded from the analysis. Vidas SARS-CoV-2 IgM and IgG index values of 217 paired tests from 115 SARS-CoV-2-positive patients (100 samples from 54 hospitalized patients and 117 samples from 61 nonhospitalized patients) are depicted as Tukey box plots according to the time from RT-PCR positive test result. No more than one patient’s sample is included per time frame. The number of tested samples (N) and the median index are indicated below each graph. The dashed line shows the positivity cutoff of both assays (i = 1.00). Differences between the groups of hospitalized and nonhospitalized patients were tested at each time frame (0 to 7, 8 to 15, and 16 to 23 days post-positive PCR) using a two-sided MWU test; the respective P values are displayed above each graph. No statistical testing was performed at 24 to 31 and ≥32 days due to the too low N values, notably in the group of nonhospitalized patients.
FIG 4
FIG 4
Kinetics of IgM and IgG seroconversion in four selected hospitalized patients. Vidas SARS-CoV-2 IgM and IgG index values of four patients (panels A to D, respectively) measured over time after symptom onset are presented. The dashed line indicates the positivity cutoff of both assays (i = 1.00). (A to D) Additional patient information is as follows: (A) the 78-year-old male patient was in the intensive-care unit (ICU) at all investigated time points, except at the first (day 7) and last (day 33) measurement time points; (B) the 77-year-old male patient was in the ICU at all investigated time points; (C) the 43-year-old male patient was in the ICU at all investigated times, except at the last two measurement time points (day 71 and 74); (D) the 67-year-old male patient was in the ICU at all investigated time points.

Similar articles

Cited by

References

    1. Zhou P, Yang X-L, Wang X-G, Hu B, Zhang L, Zhang W, Si H-R, Zhu Y, Li B, Huang C-L, Chen H-D, Chen J, Luo Y, Guo H, Jiang R-D, Liu M-Q, Chen Y, Shen X-R, Wang X, Zheng X-S, Zhao K, Chen Q-J, Deng F, Liu L-L, Yan B, Zhan F-X, Wang Y-Y, Xiao G-F, Shi Z-L. 2020. A pneumonia outbreak associated with a new coronavirus of probable bat origin. Nature 579:270–273. doi:10.1038/s41586-020-2012-7. - DOI - PMC - PubMed
    1. Coronaviridae Study Group of the International Committee on Taxonomy of Viruses. 2020. The species severe acute respiratory syndrome-related coronavirus: classifying 2019-nCoV and naming it SARS-CoV-2. Nat Microbiol 5:536–544. doi:10.1038/s41564-020-0695-z. - DOI - PMC - PubMed
    1. World Health Organization. 2020. Coronavirus disease (COVID-19) situation reports. https://www.who.int/emergencies/diseases/novel-coronavirus-2019/situatio.... Accessed 29 October 2020.
    1. Dong E, Du H, Gardner L. 2020. An interactive Web-based dashboard to track COVID-19 in real time. Lancet Infect Dis 20:533–534. doi:10.1016/S1473-3099(20)30120-1. - DOI - PMC - PubMed
    1. Johns Hopkins University. 2020. COVID-19 Resource Center. https://coronavirus.jhu.edu/map.html. Accessed 29 October 2020.

Publication types

LinkOut - more resources