. 2021 Jan 8;12(1):145.
doi: 10.1038/s41467-020-20243-8.

Nanoscale coordination polymers induce immunogenic cell death by amplifying radiation therapy mediated oxidative stress

Affiliations

Nanoscale coordination polymers induce immunogenic cell death by amplifying radiation therapy mediated oxidative stress

Zhusheng Huang et al. Nat Commun. .

Abstract

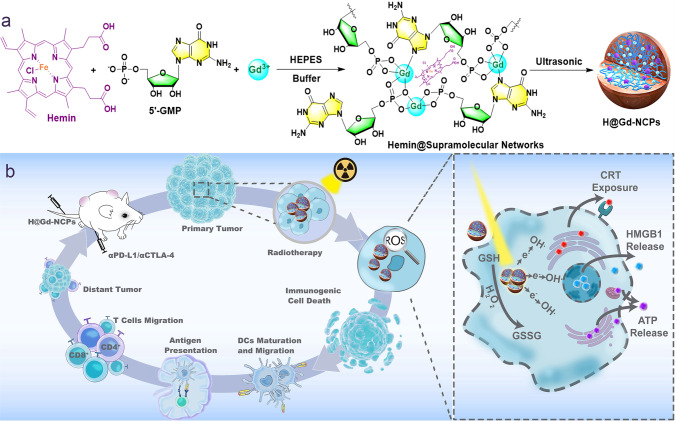
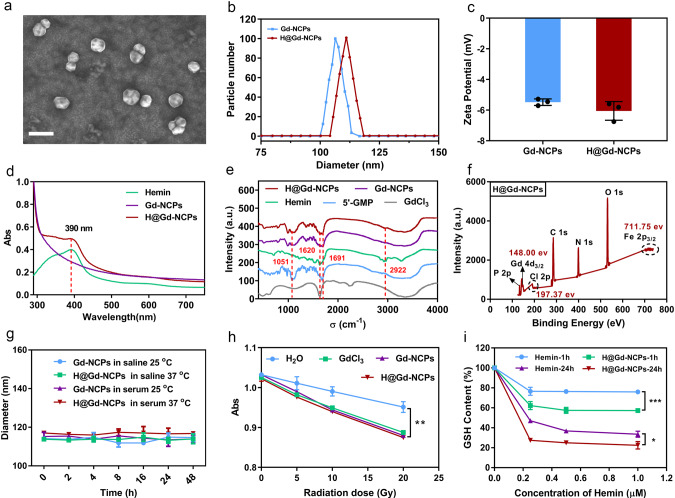
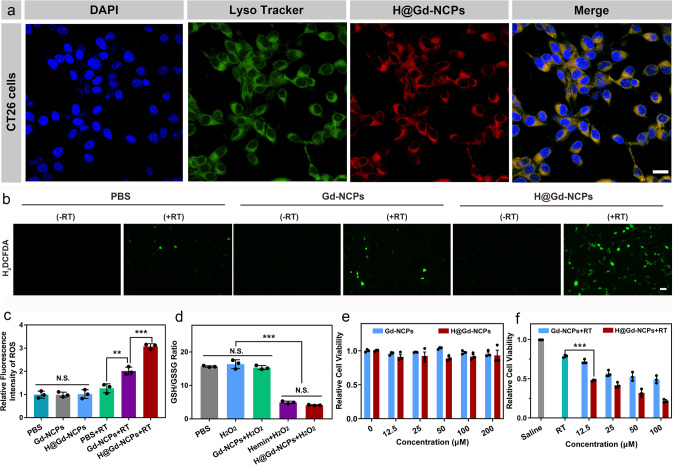
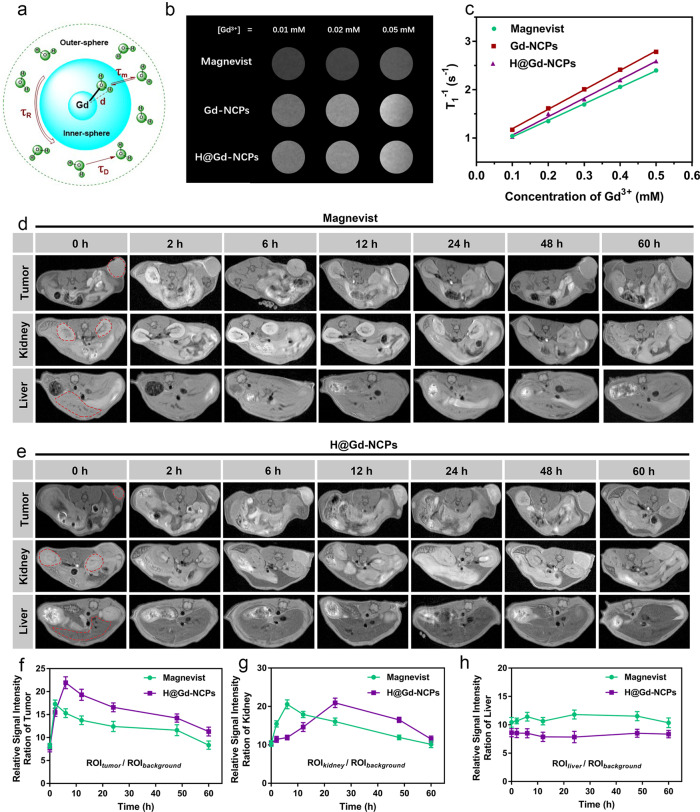
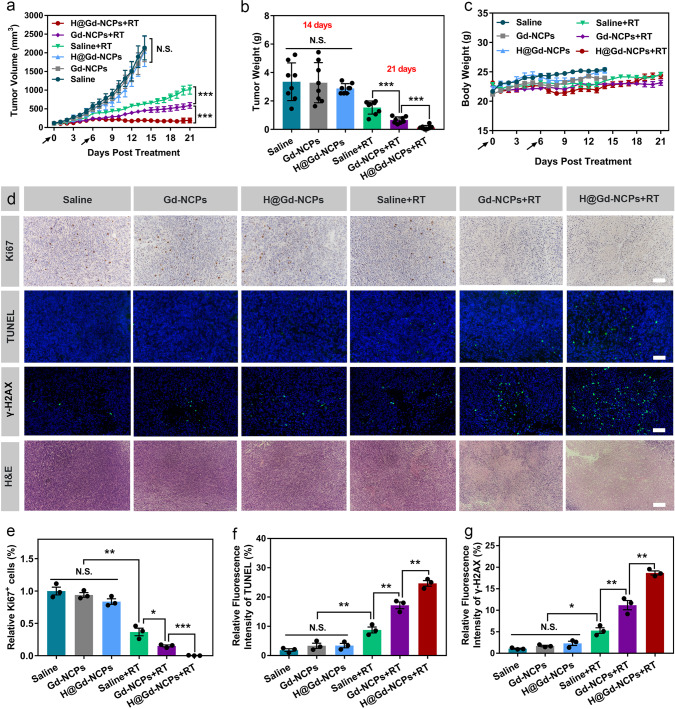
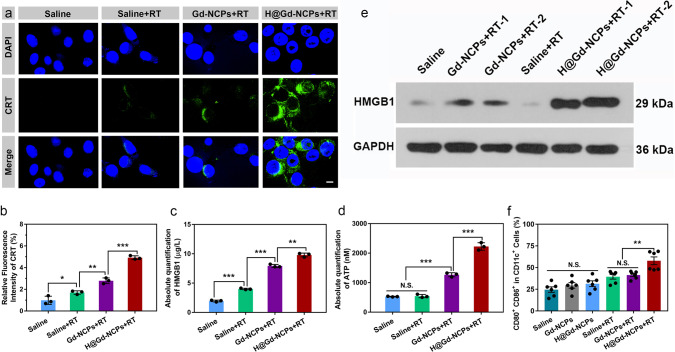
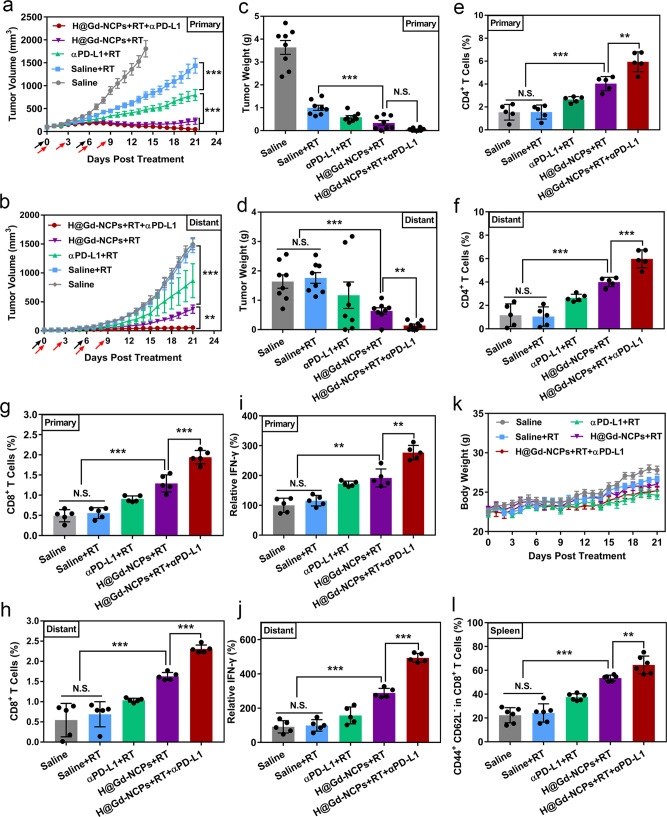
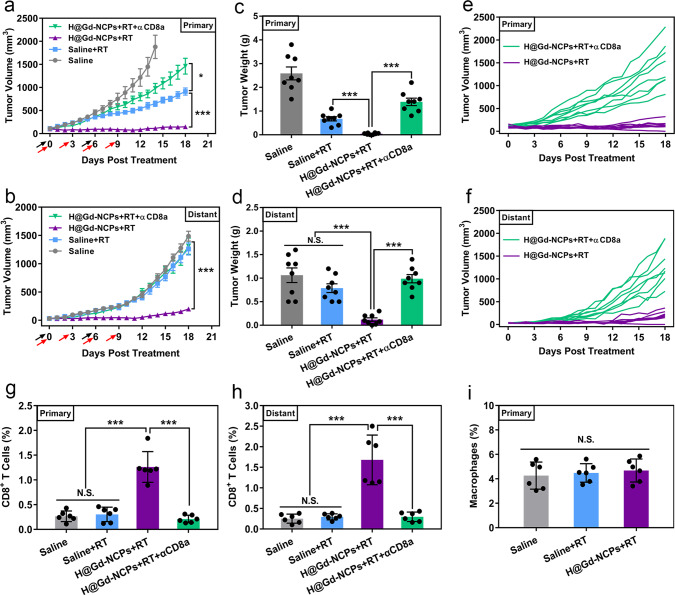
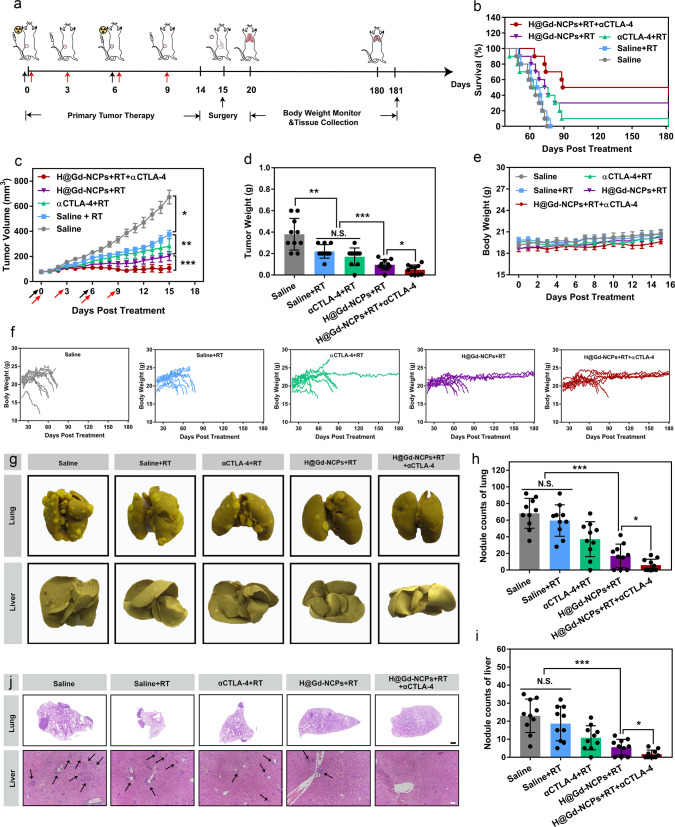
Radiation therapy can potentially induce immunogenic cell death, thereby priming anti-tumor adaptive immune responses. However, radiation-induced systemic immune responses are very rare and insufficient to meet clinical needs. Here, we demonstrate a synergetic strategy for boosting radiation-induced immunogenic cell death by constructing gadolinium-hemin based nanoscale coordination polymers to simultaneously perform X-ray deposition and glutathione depletion. Subsequently, immunogenic cell death is induced by sensitized radiation to potentiate checkpoint blockade immunotherapies against primary and metastatic tumors. In conclusion, nanoscale coordination polymers-sensitized radiation therapy exhibits biocompatibility and therapeutic efficacy in preclinical cancer models, and has the potential for further application in cancer radio-immunotherapy.


Conflict of interest statement

All authors declare no competing interests.

Figures

Fig. 1
Fig. 1. The preparation and mechanism of H@Gd-NCPs.
a Schematic illustration of the preparation of nanoscale coordination polymers H@Gd-NCPs. b The mechanism of H@Gd-NCPs for radiosensitization via amplifying intracellular oxidative stress to potentiate checkpoint blockade immunotherapies. Dendritic cells (DCs), glutathione (GSH), oxidized glutathione (GSSG), hydroxyl radicals (•OH), calreticulin (CRT), high mobility group protein B1 (HMGB1), adenosine triphosphate (ATP).
Fig. 2
Fig. 2. Characterization of Gd-NCPs and H@Gd-NCPs.
a Ultra-high-resolution field emission scanning electron microscope (FE-SEM) imaging of H@Gd-NCPs, scale bar = 200 nm. b Particle size of H@Gd-NCPs and Gd-NCPs measured by dynamic light scattering (n = 3 biologically independent samples). c Zeta potential of Gd-NCPs and H@Gd-NCPs (n = 3 biologically independent samples). d Normalized UV-vis spectra of Hemin, Gd-NCPs and H@Gd-NCPs. e Fourier transform infrared (FT-IR) spectrum of 5′-GMP, GdCl3, Hemin, Gd-NCPs, and H@Gd-NCPs. f Qualitative element analysis of H@Gd-NCPs by X-ray photoelectron spectroscopy (XPS). g Dynamic light scattering data of Gd-NCPs and H@Gd-NCPs incubated with saline or 50% serum at 25 or 37 °C, respectively (n = 3 biologically independent samples). h Comparison of reactive oxygen species (ROS) production between H2O, GdCl3, Gd-NCPs and H@Gd-NCPs groups ([Gd3+] = 20 μM) under various radiation doses as determined by the decay of methylene blue absorption (Abs) at λ = 664 nm (n = 3 biologically independent samples, **p = 0.0049). i Concentration and time-dependent glutathione (GSH) elimination by free Hemin and H@Gd-NCPs in vitro (n = 3 biologically independent samples, ***p = 0.0001, *p = 0.0463). All experiments were repeated twice independently with similar results. All data were presented as mean ± SD. Two-sided Student’s t-test was used to calculate the statistical difference between two groups. *p < 0.05, **p < 0.01, ***p < 0.001. Source data are provided as a Source data file.
Fig. 3
Fig. 3. Cellular uptake and radiosensitization of H@Gd-NCPs in vitro.
a Confocal laser scanning microscope (CLSM) images of CT26 cells after treatment with DAPI, Lysotracker and H@Gd-NCPs, respectively. Yellow regions indicated localization of H@Gd-NCPs in the lysosomes, scale bar = 20 μm. b Fluorescence images of CT26 cells treated with PBS, Gd-NCPs, and H@Gd-NCPs with or without 8 Gy × 1 irradiation and detected with a reactive oxygen species (ROS) probe H2DCFDA (green fluorescence) for intracellular ROS evaluation, scale bar = 200 μm. c Quantification of fluorescence based on (b) by ImageJ software (n = 3 biologically independent cells, **p = 0.0071, ***p = 0.0008). d PBS, Hemin, Gd-NCPs and H@Gd-NCPs decrease intracellular GSH/GSSG ratios in CT26 cells (n = 3 biologically independent cells, ***p = 0.0001). e The cytotoxicity of Gd-NCPs and H@Gd-NCPs without irradiation ([Gd3+] = 0, 12.5, 25, 50, 100, 200 μM) (n = 3 biologically independent cells). f The cytotoxicity of Gd-NCPs and H@Gd-NCPs against CT26 cells with 8 Gy × 1 irradiation ([Gd3+] = 0, 12.5, 25, 50, 100 μM) (n = 3 biologically independent cells, ***p = 0.0002). All experiments were repeated twice independently with similar results. All data were presented as mean ± SD. Two-sided Student’s t-test was used to calculate the statistical difference between two groups. N.S. represented non-significance, and **p < 0.01, ***p < 0.001. Source data are provided as a Source data file.
Fig. 4
Fig. 4. Magnetic resonance imaging (MRI) in vitro and in vivo.
a Schematic diagram of MRI. b T1-weighted MR images of Magnevist, Gd-NCPs, and H@Gd-NCPs at pH 7.4 (n = 3 biologically independent samples), this experiment was repeated twice independently with similar results. c Determination of longitudinal relaxivities (r1) values for Magnevist, Gd-NCPs and H@Gd-NCPs (n = 3 biologically independent samples), this experiment was repeated twice independently with similar results. d Dynamic MR imaging after intravenous injection of Magnevist ([Gd3+] = 30 mg kg−1), and the dashed red circles indicated tumor, kidney, or liver (n = 3 biologically independent animals). e Dynamic MRI after intravenous injection of H@Gd-NCPs ([Gd3+] = 30 mg kg−1) in vivo, and the dashed red circles indicated tumor, kidney and liver, respectively (n = 3 biologically independent animals). fh Relative background signal intensity ration of tumor (f), kidney (g) and liver (h) regions based on Magnevist MR images (d) and H@Gd-NCPs MR images (e) at different time points (n = 3 biologically independent samples). All data were presented as mean ± SD. Source data are provided as a Source data file.
Fig. 5
Fig. 5. Therapeutic efficacy of H@Gd-NCPs in CT26-bearing mice.
a Tumor growth curves after various treatments ([Gd3+] = 30 mg kg−1 and [Hemin] = 12.5 mg kg−1) with or without irradiation. Treatments were performed on days 0 and 6. X-ray radiation therapy was performed 6 h after nanomedicines intravenous injection (black arrow). RT 6 Gy × 2 with fractions delivered 6 days apart (n = 8 biologically independent animals, ***p = 0.0001). Data were presented as mean ± SEM. b Tumor weight without irradiation groups collected on day 14, tumor weight with irradiation groups collected on day 21 (n = 8 biologically independent animals, ***p = 0.0001). c Dynamic body weight of CT26-bearing mice in different groups during treatments (n = 8 biologically independent animals). d Images of Ki67 immunohistochemical staining of tumor slices, immunofluorescence images of tumor slices stained with TUNEL assay kit and γ-H2Aχ antibody and H&E sections, scale bar = 100 μm. The γ-H2Aχ tumor slices were harvested 24 h after radiotherapy (6 Gy × 1) and the Ki67, TUNEL tumor slices were harvested 48 h after radiotherapy (6 Gy × 1). These experiments were repeated twice independently with similar results. eg Quantification of the relative percentage of (e) Ki67 positive cells (**p = 0.0016, *p = 0.0227, ***p = 0.0005) (f) TUNEL (**p = 0.0035, **p = 0.0053, **p = 0.0072) and γ-H2Aχ (*p = 0.0364, **p = 0.0093, **p = 0.0031) mean fluorescence intensity after different treatments (n = 3 biologically independent animals). Data (b, c, eg) were presented as mean ± SD. Two-sided Student’s t-test was used to calculate the statistical difference between two groups. N.S. represented non-significance, and *p < 0.05, **p < 0.01, ***p < 0.001. Source data are provided as a Source data file.
Fig. 6
Fig. 6. Immunogenic cell death induction in vitro and in vivo.
a Immunofluorescence of CT26 colorectal tumor cells stained with calreticulin (CRT) antibody (n = 3 biologically independent cells), RT 0 or 8 Gy × 1, scale bar = 5 μm. This experiment was repeated twice independently with similar results. b Quantification of relative CRT means fluorescence intensity after different treatments (n = 3 biologically independent cells, *p = 0.0389, **p = 0.0037, ***p = 0.0003). c Detection of high mobility group protein B1 (HMGB1) release by ELISA kit (n = 3 biologically independent cells, ***p = 0.0001, ***p = 0.0001, **p = 0.0014), RT 0 or 8 Gy × 1. This experiment was repeated twice independently with similar results. d Detection of adenosine triphosphate (ATP) secretion by luciferin-based ATP assay kit (n = 3 biologically independent cells, ***p = 0.0001, ***p = 0.0003), RT 0 or 8 Gy × 1. This experiment was repeated twice independently with similar results. e Western blot of HMGB1 in CT26-bearing mice tumor tissues after various treatments, the tumor tissues were harvested 48 h after radiotherapy (0 or 6 Gy × 1, n = 3 biologically independent animals). This experiment was repeated once independently with similar results. f Flow cytometry analysis of dendritic cells (DCs) maturation in tumor-draining lymph nodes (TDLNs), the TDLNs were harvested 5 days after radiotherapy (0 or 6 Gy × 1, n = 6 biologically independent animals, **p = 0.0063). All data were presented as mean ± SD. Two-sided Student’s t-test was used to calculate the statistical difference between two groups. N.S. represented non-significance, and *p < 0.05, **p < 0.01, ***p < 0.001. Source data are provided as a Source data file.
Fig. 7
Fig. 7. Abscopal effect and systemic antitumor immunity of H@Gd-NCPs-sensitized RT synergizes with immune checkpoint blockade in vivo.
a Primary (***p = 0.0001, ***p = 0.0001) and b distant (***p = 0.0001, **p = 0.002) tumor growth curves of CT26 colorectal bilateral tumor-bearing mice treated with Saline, Saline + RT, αPD-L1 + RT, H@Gd-NCPs+RT and H@Gd-NCPs+RT + αPD-L1. [Gd3+] = 30 mg kg−1, [Hemin] = 12.5 mg kg−1 and [αPD-L1] = 10 mg kg−1. Treatments were performed on days 0 and 6. X-ray radiation therapy was performed 6 h after nanomedicines intravenous injection (black arrow). RT 6 Gy × 2 with fractions delivered 6 days apart and only primary tumors received radiation therapy. Anti-PD-L1 antibody was treated via intraperitoneal injection 6 h after radiation therapy (red arrow, n = 8 biologically independent animals). Data (a, b) were presented as mean ± SEM. c Primary (***p = 0.0006) and d distant (***p = 0.0001, **p = 0.0012) CT26 tumors weight (n = 8 biologically independent animals). e, f The percentages of CD4+ T cells in the e primary (***p = 0.0003, **p = 0.0039) and f distant (***p = 0.0003, ***p = 0.0009) tumors analyzed with flow cytometry (n = 5 biologically independent animals). g, h The percentages of CD8+ T cells in the g primary (***p = 0.0001, ***p = 0.0006) and h distant (***p = 0.0001, ***p = 0.0001) tumors analyzed by flow cytometry (n = 5 biologically independent animals). i, j Relative content of IFN-γ in the i primary (**p = 0.0012, **p = 0.0011) and j distant (***p = 0.0001, ***p = 0.0001) tumors detected with ELISA kit (n = 5 biologically independent animals), this experiment was repeated twice independently with similar results. Tumor tissues (ej) in different groups were harvested on day 21 for flow cytometry and IFN-γ analysis. k Dynamic body weight of bilateral CT26-bearing mice in different groups during treatments (n = 8 biologically independent animals). (l) Percentages of effector memory T cells (TEM) in the spleen analyzed by flow cytometry, the spleen in different groups were collected on day 21 (n = 6 biologically independent animals, ***p = 0.0001, **p = 0.0062). Data (cl) were presented as mean ± SD. Two-sided Student’s t-test was used to calculate the statistical difference between two groups. N.S. represented non-significance, and **p < 0.01, ***p < 0.001. Source data are provided as a Source data file.
Fig. 8
Fig. 8. CD8+ T cells depletion experiments and ex vivo analysis of immune cells.
a Primary (*p = 0.0345, ***p = 0.0001) and b distant (***p = 0.0001) tumor growth curves of CT26 colorectal bilateral tumor-bearing mice treated with Saline, Saline+RT, H@Gd-NCPs+RT and H@Gd-NCPs+RT + αCD8a, (n = 8 biologically independent animals). [Gd3+] = 30 mg kg−1, [Hemin] =12.5 mg kg−1 and [αCD8a] = 10 mg kg−1. Treatments were performed on days 0 and 6. X-ray radiation therapy was performed 6 h after nanomedicines intravenous injection (black arrow). RT 6 Gy × 2 with fractions delivered 6 days apart and only primary tumors received radiation therapy. Anti-CD8a antibody was treated via intraperitoneal injection 6 h after radiation therapy (red arrow). Data (a, b) were presented as mean ± SEM. c Primary (***p = 0.0001, ***p = 0.0001) and d distant (***p = 0.0001, ***p = 0.0001) CT26 tumor weight (n = 8 biologically independent animals). e, f Growth curves of e primary and f distant individual tumors in the H@Gd-NCPs + RT and H@Gd-NCPs + RT + αCD8a groups. g, h The percentages of CD8+ T cells in the g primary (***p = 0.0001, ***p = 0.0001) and h distant (***p = 0.0002, ***p = 0.0003) tumors analyzed by flow cytometry (n = 6 biologically independent animals). i The percentages of macrophages (F4/80+ and CD11b+) in the primary tumors analyzed by flow cytometry (n = 6 biologically independent animals). Tumor tissues (gi) in different groups were harvested on day 18 for flow cytometry analysis. Data (c, d, gi) were presented as mean ± SD. Two-sided Student’s t-test was used to calculate the statistical difference between two groups. N.S. represented non-significance, and *p < 0.05, ***p < 0.001. Source data are provided as a Source data file.
Fig. 9
Fig. 9. Inhibition of primary tumors and metastasis in 4T1 breast tumors.
a Schematic illustration of tumor therapeutic profile. b Survival curves of 4T1 breast tumor-bearing mice. c Primary tumor growth curves of 4T1 breast tumor-bearing mice treated with Saline, Saline + RT, αCTLA-4 + RT, H@Gd-NCPs + RT and H@Gd-NCPs + RT + αCTLA-4, (n = 10 biologically independent animals, *p = 0.0465, **p = 0.0070, ***p = 0.0003). [Gd3+] = 30 mg kg−1, [Hemin] = 12.5 mg kg−1 and [αCTLA-4] = 25 μg mouse−1. Treatments were performed on days 0 and 6. X-ray radiation therapy was performed 6 h after nanomedicines intravenous injection. RT 6 Gy × 2 with fractions delivered 6 days apart (black arrow). Anti-CTLA-4 antibody was treated via intravenous injection 6 h after radiation therapy (red arrow). Data were presented as mean ± SEM. d Primary excised 4T1 breast tumors weight (n = 10 biologically independent animals, **p = 0.0055, ***p = 0.0007, *p = 0.0366). e Dynamic body weights of 4T1 breast tumor-bearing mice (n = 10 biologically independent animals). f Body weight changes of individual 4T1 breast tumor-bearing mice. g Images of lung and liver fixed by Bouin’s solution. h, i Quantification of metastatic lesions of the h lungs (***p = 0.0001, *p = 0.04) and i livers (***p = 0.0009, *p = 0.0222) (n = 10 biologically independent animals). j H&E sections of lungs (scale bar = 1 mm) and livers (scale bar = 200 μm). Data (d, e, h, i) were presented as mean ± SD. Two-sided Student’s t-test was used to calculate the statistical difference between two groups. N.S. represented non-significance, and *p < 0.05, **p < 0.01, ***p < 0.001. Source data are provided as a Source data file.

References

    1. Kroemer G, Galluzzi L, Kepp O, Zitvogel L. Immunogenic cell death in cancer therapy. Annu. Rev. Immunol. 2013;31:51–72. doi: 10.1146/annurev-immunol-032712-100008. - DOI - PubMed
    1. Galluzzi L, Buqué A, Kepp O, Zitvogel L, Kroemer G. Immunogenic cell death in cancer and infectious disease. Nat. Rev. Immunol. 2017;17:97–111. doi: 10.1038/nri.2016.107. - DOI - PubMed
    1. Kepp O, et al. Molecular determinants of immunogenic cell death elicited by anticancer chemotherapy. Cancer Metastasis Rev. 2011;30:61–69. doi: 10.1007/s10555-011-9273-4. - DOI - PubMed
    1. Golden EB, Apetoh L. Radiotherapy and immunogenic cell death. Semin. Radiat. Oncol. 2015;25:11–17. doi: 10.1016/j.semradonc.2014.07.005. - DOI - PubMed
    1. Garg AD, Agostinis P. ER stress, autophagy and immunogenic cell death in photodynamic therapy-induced anti-cancer immune responses. Photochem. Photobiol. Sci. 2014;13:474–487. doi: 10.1039/C3PP50333J. - DOI - PubMed

Publication types

MeSH terms