Observational Study
. 2021 Jan 8;12(1):160.
doi: 10.1038/s41467-020-20246-5.

Disease risk scores for skin cancers

Collaborators, Affiliations
Observational Study

Disease risk scores for skin cancers

Pierre Fontanillas et al. Nat Commun. .

Abstract

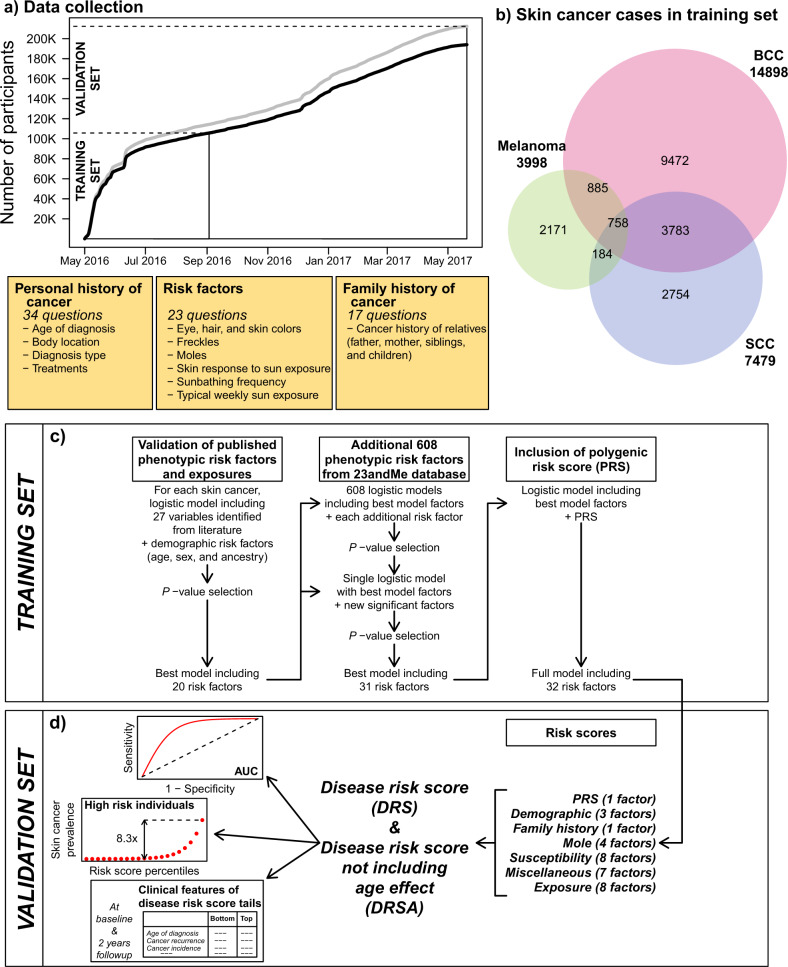
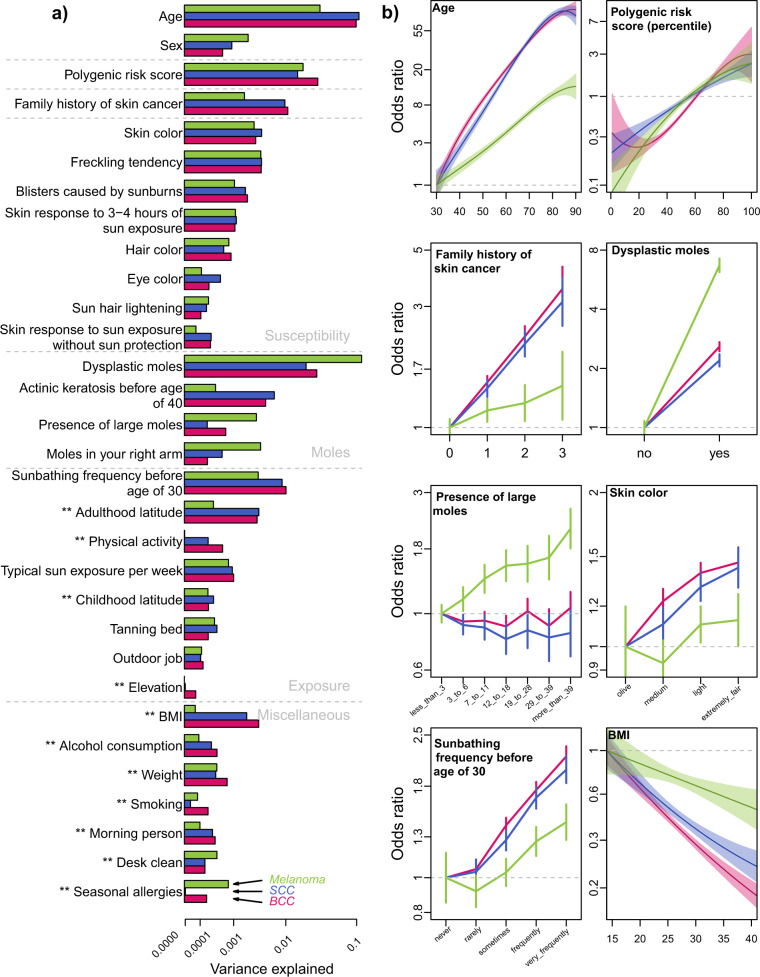
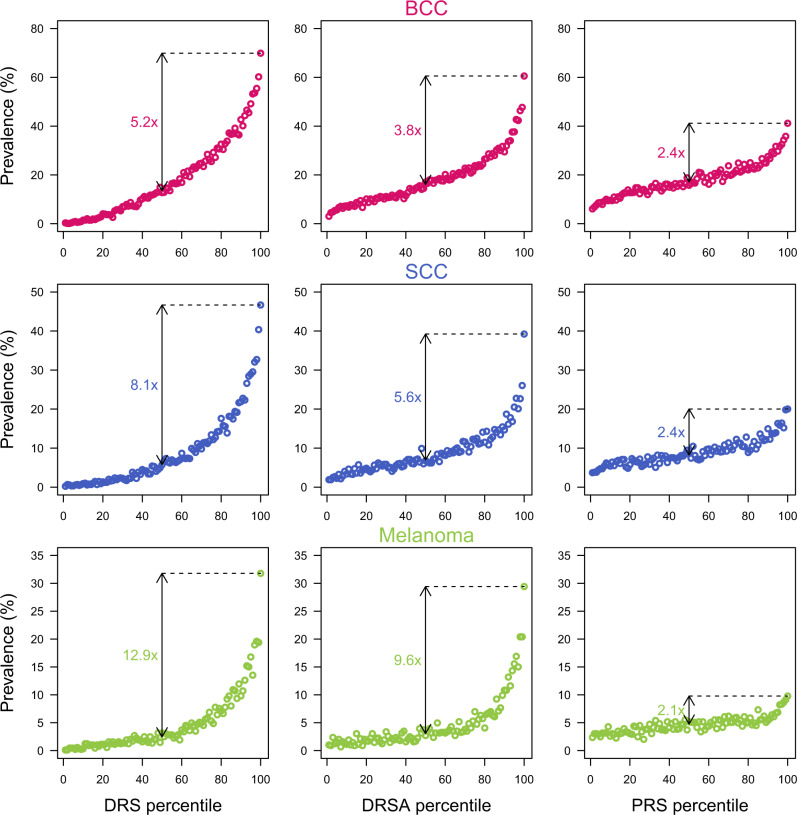
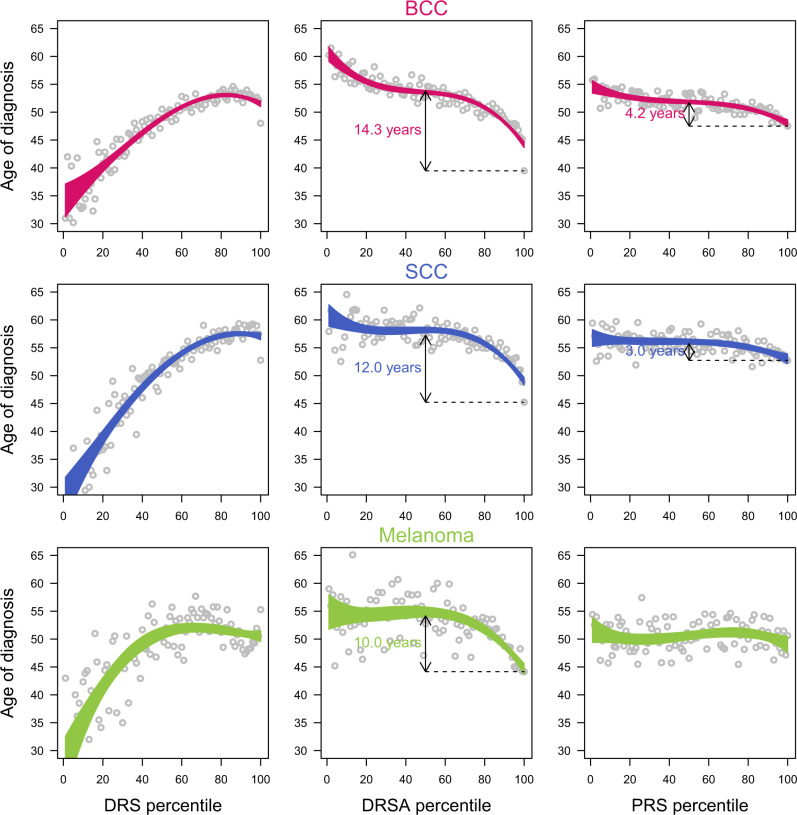
We trained and validated risk prediction models for the three major types of skin cancer- basal cell carcinoma (BCC), squamous cell carcinoma (SCC), and melanoma-on a cross-sectional and longitudinal dataset of 210,000 consented research participants who responded to an online survey covering personal and family history of skin cancer, skin susceptibility, and UV exposure. We developed a primary disease risk score (DRS) that combined all 32 identified genetic and non-genetic risk factors. Top percentile DRS was associated with an up to 13-fold increase (odds ratio per standard deviation increase >2.5) in the risk of developing skin cancer relative to the middle DRS percentile. To derive lifetime risk trajectories for the three skin cancers, we developed a second and age independent disease score, called DRSA. Using incident cases, we demonstrated that DRSA could be used in early detection programs for identifying high risk asymptotic individuals, and predicting when they are likely to develop skin cancer. High DRSA scores were not only associated with earlier disease diagnosis (by up to 14 years), but also with more severe and recurrent forms of skin cancer.


Conflict of interest statement

All authors are current or former employees of 23andMe, Inc., and hold stock or stock options in 23andMe.

Figures

Fig. 1
Fig. 1. Data collection for the training and validation sets, description of the cancer survey, overview of the predictive model construction, and disease risk scores.
a Cumulative data collection from May 2016 to September 2016. Participants recruited between May and September 2016 were included in the training set. The gray line is the total number of participants from European ancestry. BCC, SCC, and melanoma prediction models were trained on participants 30–90 years old (black line). b Number of skin cancer cases in the training set. c Overview of prediction model construction in the training set. d Disease risk scores and predictive performances evaluated in the validation set.
Fig. 2
Fig. 2. Variance explained and risk factor effects in the final 32-factor models.
The training set included 103,008 participants (14,898 BCC, 7479 SCC, and 3998 melanoma cases). a Risk factors are organized and presented by risk scores. The 5 ancestry PCs are not shown. The variance explained is the deviance of the model, a standard measure of goodness of fit of the model that approximates the variance explained. Deviances were recalculated in the full models, after ranking the risk factors in each skin cancer, based on the deviance explained by each individual risk factor, from the larger to the smaller deviances. ** Indicates risk factors that were not included in the cancer survey, and were identified from the wider 23andMe database. b A sample of risk factor effects (estimated effects and 95% CI). Continuous risk factors, age, and BMI, were modeled as polynomial variables.
Fig. 3
Fig. 3. Prevalence of skin cancer cases across the binned DRS, DRSA, and PRS distributions in the validation set.
Risk score distributions are binned into percentiles. Each bin contains 890 participants. The prevalence is the percentage of participants reporting skin cancer in each bin.
Fig. 4
Fig. 4. Mean age of skin cancer diagnosis across the DRS, DRSA, and PRS distributions in the validation set.
Risk score distributions are binned into percentiles. Each bin contains 890 participants. The dots are the mean age of diagnosis in each bin, and the area represents the 95% confidence interval of the mean age of diagnosis.
Fig. 5
Fig. 5. Lifetime skin cancer risk stratified by DRSA percentiles.
The expected ages of diagnosis (mean and SD) were computed using yearly incidence rates derived from the lifetime risk curves, and assuming CDC survival estimated rates, in White American, for the year 2017 (see “Methods” for details). The observed ages of diagnosis (mean and SD) were calculated in the validation set (88,924 participants, see Supplementary Table 1).

Similar articles

Cited by

References

    1. World Health Organization. Guide to cancer early diagnosis. World Health Organization; https://apps.who.int/iris/handle/10665/254500 (2017).
    1. Emmons KM, Colditz GA. Realizing the potential of cancer prevention: the role of implementation science. N. Engl. J. Med. 2017;376:986–990. doi: 10.1056/NEJMsb1609101. - DOI - PMC - PubMed
    1. Rebbeck TR, et al. Precision prevention and early detection of cancer: fundamental principles. Cancer Discov. 2018;8:803–811. doi: 10.1158/2159-8290.CD-17-1415. - DOI - PubMed
    1. Rogers HW, et al. Incidence estimate of nonmelanoma skin cancer (keratinocyte carcinomas) in the US population. JAMA Dermatol. 2015;151:1081–1086. doi: 10.1001/jamadermatol.2015.1187. - DOI - PubMed
    1. American Cancer Society. Cancer facts & figures 2019 (American Cancer Society, Atlanta, 2019).

Publication types

MeSH terms