. 2021 Jan 8;12(1):159.
doi: 10.1038/s41467-020-20413-8.

Spread spectrum SERS allows label-free detection of attomolar neurotransmitters

Affiliations

Spread spectrum SERS allows label-free detection of attomolar neurotransmitters

Wonkyoung Lee et al. Nat Commun. .

Abstract

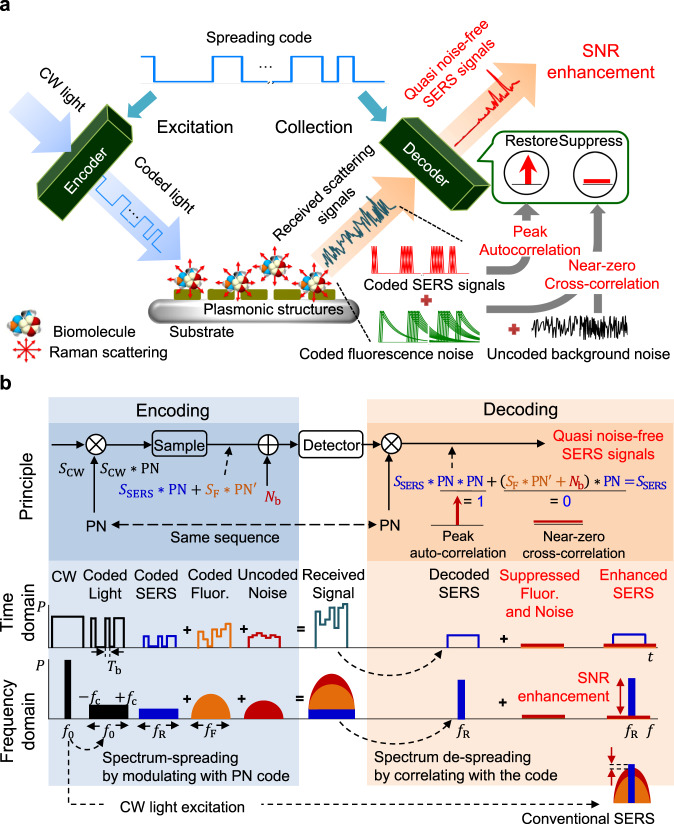
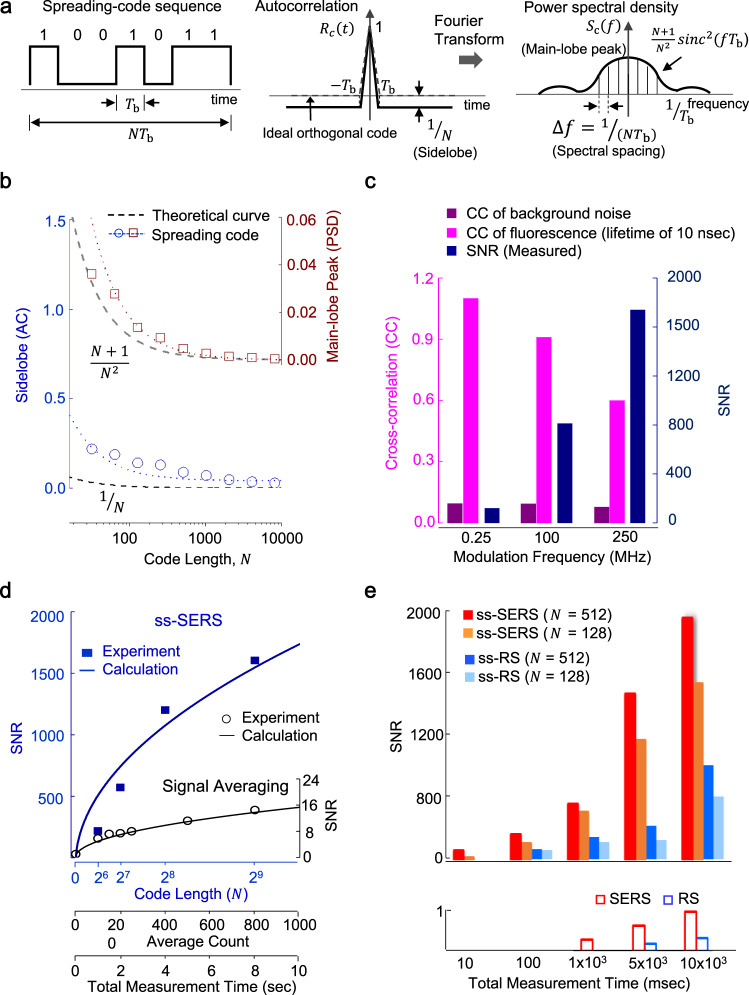
The quantitative label-free detection of neurotransmitters provides critical clues in understanding neurological functions or disorders. However, the identification of neurotransmitters remains challenging for surface-enhanced Raman spectroscopy (SERS) due to the presence of noise. Here, we report spread spectrum SERS (ss-SERS) detection for the rapid quantification of neurotransmitters at the attomolar level by encoding excited light and decoding SERS signals with peak autocorrelation and near-zero cross-correlation. Compared to conventional SERS measurements, the experimental result of ss-SERS shows an exceptional improvement in the signal-to-noise ratio of more than three orders of magnitude, thus achieving a high temporal resolution of over one hundred times. The ss-SERS measurement further allows the attomolar SERS detection of dopamine, serotonin, acetylcholine, γ-aminobutyric acid, and glutamate without Raman reporters. This approach opens up opportunities not only for investigating the early diagnostics of neurological disorders or highly sensitive biomedical SERS applications but also for developing low-cost spectroscopic biosensing applications.


Conflict of interest statement

The authors declare no competing interests.

Figures

Fig. 1
Fig. 1. Conceptual description of spread spectrum SERS (ss-SERS) detection with spreading coded light excitation.
a Schematic illustration of ss-SERS detection with coded light excitation. A laser beam is encoded by using a spreading code of pseudorandom noise (PN) and is injected on a SERS substrate with Raman active molecules, where the SERS signals are simultaneously encoded with the coded excitation of light. Noise-suppressed SERS signals are reconstructed at the decoder by using peak autocorrelation between the spreading code and the coded SERS signals, whereas all noise, including fluorescence and background noise, is effectively eliminated due to a near-zero cross-correlation between the spreading code and the noise. b Encoding and decoding principles for the removal of background noise and the restoration of noise-suppressed SERS signals. SCW, SSERS, SF, and Nb represent the CW light excitation, original SERS signals, original fluorescence signals, and background noise signals, respectively. PN is the PN code used in the encoding process and PN′ is a distorted pattern from PN. The bit duration (Tb) and the modulation frequency (fc) are inversely proportional. P, t, and f represent the signal power, time, and frequency, respectively. In the time domain, the coded light and the coded SERS signals exhibit pulse sequences of the same pattern as the PN code of the encoding process, whereas the fluorescence signals are encoded in a distorted pattern from the PN code due to the lifetime of the fluorescence signals being longer than the bit duration. Consequently, the coded fluorescence and background noise are completely filtered out by correlating with the PN code of the encoding process due to the spectrum-spreading property of the spreading code, resulting in an exceptional SNR enhancement.
Fig. 2
Fig. 2. More than a two order of magnitude increased SNR of the spread spectrum SERS (ss-SERS).
a Experimental setup for the SERS measurement of ss-SERS consisting of an excitation light encoder for laser modulation, a signal decoder for deconvolution and a conventional SERS system for light excitation and SERS detection of target molecules. In the excitation light encoder, coded light is generated by modulating a laser beam with a PN code using an intensity modulator. A fiber bundle-based Raman probe launches the coded sequences into the target molecules on the SERS substrates and then receives the mixed signals with the coded SERS signals, coded Rayleigh scattering signals, coded fluorescence signals, and various system noise. The signal decoder restores quasi-noise-free SERS signals by correlating the detected signals with the identical PN code. b Raman or SERS spectra for Rhodamine 6G (R6G) at a 5 mM concentration measured by Raman spectroscopic equipment (RS), conventional SERS, ss-RS, and ss-SERS. The upper side shows the color maps of the measured Raman or SERS intensities. The ss-SERS peak intensity of R6G at 1331 cm−1 is increased over 800 times that of SERS, and the ss-RS peak intensity at 1402 cm−1 is increased over 1000 times that of RS. (The output power of the laser: 25 mW, the power at the sample: 1 mW, accumulation time: 10 s.) δ bending, ν stretching. c Comparison of the SERS spectra for ss-SERS and signal averaging. The ss-SERS peak intensity of R6G at 1331 cm−1 is increased by over 150 times compared to the averaged SERS signals for the same measurement time. The SNR of the ss-SERS signals (5 mM rhodamine 6G, code length: 512 bits, measurement time: 10 s) is increased over two orders-of-magnitude compared to that of averaged SERS signals for the same measurement time.
Fig. 3
Fig. 3. The signal-to-noise ratio of ss-SERS depends on the code length of a PN code and the modulation frequency.
a Conceptual description of the autocorrelation and power spectral density of the spreading codes as high orthogonal codes based on primitive polynomials. Tb, N, Rc(τ), and Sc(τ) represent a bit duration, code length, autocorrelation function, and power spectral density function, respectively. b The autocorrelation (AC) sidelobe and the main-lobe peak dependence on the PN code length. The autocorrelation sidelobe and the main-lobe peak for the high orthogonal code decrease to the theoretical level as the code length increases, resulting in significant noise suppression. c The cross-correlation (CC) and the measured SNRs of ss-SERS for R6G molecules at 1331 cm−1 dependence on the modulation frequency. The cross-correlation of the fluorescence generated by excitation light decreases with increasing modulation frequency, however, the cross-correlation for the background noise independent of the excitation light remains near-zero. d Comparison of the measured SNRs between the ss-SERS and the signal averaging for R6G molecules at 1331 cm−1. The total measurement time corresponds to the code length multiplied by a constant sequence repetition and bit duration as well as the average count multiplied by a constant sweep time. The ss-SERS measurement shows an exceptional improvement in the SNR by over two orders of magnitude compared to the signal averaging of the SERS signals. e Comparison of the temporal resolution between ss-SERS/ss-RS and conventional SERS/RS. The ss-SERS exhibits a substantial reduction in the measurement time over 100th compared to conventional SERS and RS.
Fig. 4
Fig. 4. LODs and ss-SERS spectra of primary neurotransmitters for different concentrations ranging from 1 mM (10-3 M) to 1 aM (10−18 M).
a The characteristic Raman peak intensities of ss-SERS for acetylcholine of the learning neurotransmitter associated with Alzheimer’s dementia depending on neurotransmitter concentrations. The ss-SERS spectra exhibit a major SERS peak at 1150 cm−1 assigned to CH3 rocking and CH2 wagging. δ bending, τ twisting, ω wagging, ν stretching, ρ rocking. (The output power of the laser: 25 mW, the power at the sample: 1 mW, accumulation time: 10 s.) b Limit of detection for primary neurotransmitters down to attomolar concentrations. The nonlinear fit curves based on the experimental data for the neurotransmitters agree well with the Freundlich isotherm-like behavior logqe=logKF+1nlogCe, where qe, KF, n, and Ce represent the ss-SERS peak intensity, Freundlich isotherm constant, Freundlich isotherm exponent, and concentration, respectively.

Similar articles

Cited by

References

    1. Lian TH, et al. An investigation on the clinical features and neurochemical changes in Parkinson’s disease with depression. Front. Psychiatry. 2018;9:723. doi: 10.3389/fpsyt.2018.00723. - DOI - PMC - PubMed
    1. Hacohen Y, et al. Fetal acetylcholine receptor inactivation syndrome: a myopathy due to maternal antibodies. Neurol. Neuroimmunol. Neuroinflamm. 2015;2:e57. doi: 10.1212/NXI.0000000000000057. - DOI - PMC - PubMed
    1. Kessler H, et al. Cerebrospinal fluid diagnostic markers correlate with lower plasma copper and ceruloplasmin in patients with Alzheimer’s disease. J. Neural Transm. 2006;113:1763–1769. doi: 10.1007/s00702-006-0485-7. - DOI - PubMed
    1. Madeira C, et al. Elevated glutamate and glutamine levels in the cerebrospinal fluid of patients with probable Alzheimer’s disease and depression. Front. Psychiatry. 2018;9:561. doi: 10.3389/fpsyt.2018.00561. - DOI - PMC - PubMed
    1. Goran Šimic MBL, et al. Monoaminergic neuropathology in Alzheimer’s disease. Prog. Neurobiol. 2017;151:101–138. doi: 10.1016/j.pneurobio.2016.04.001. - DOI - PMC - PubMed

Publication types

MeSH terms

LinkOut - more resources