. 2021 Jan 8;12(1):183.
doi: 10.1038/s41467-020-20454-z.

An autophagy enhancer ameliorates diabetes of human IAPP-transgenic mice through clearance of amyloidogenic oligomer

Affiliations

An autophagy enhancer ameliorates diabetes of human IAPP-transgenic mice through clearance of amyloidogenic oligomer

Jinyoung Kim et al. Nat Commun. .

Abstract

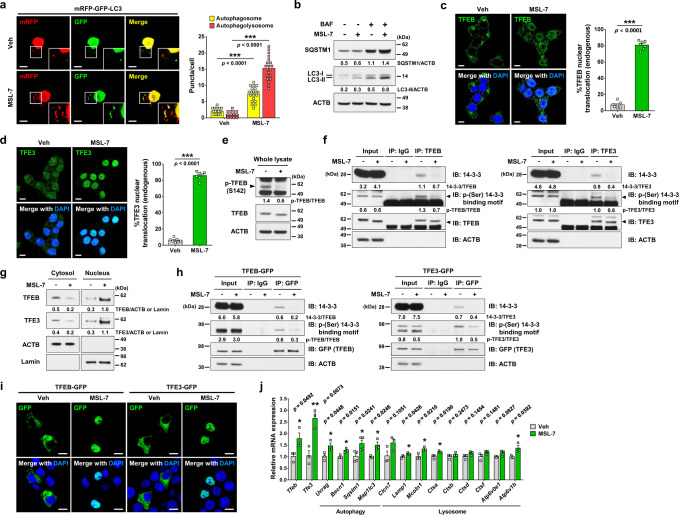
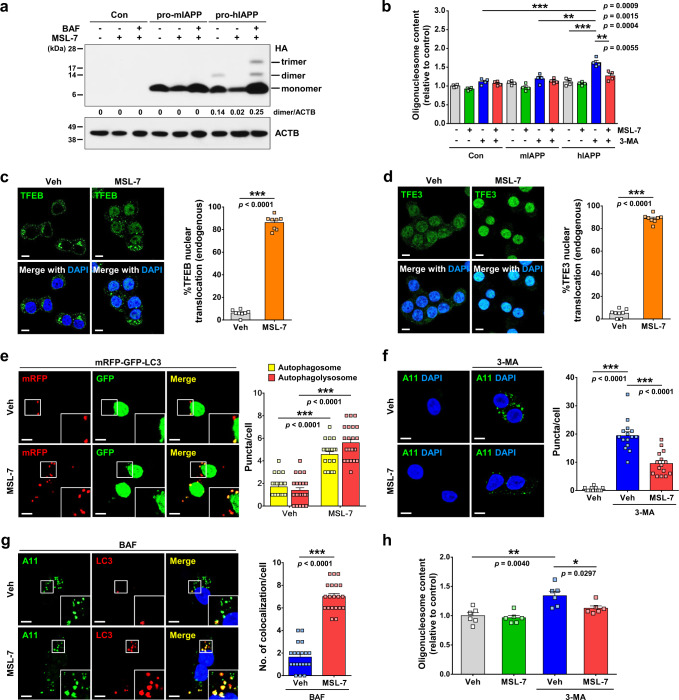
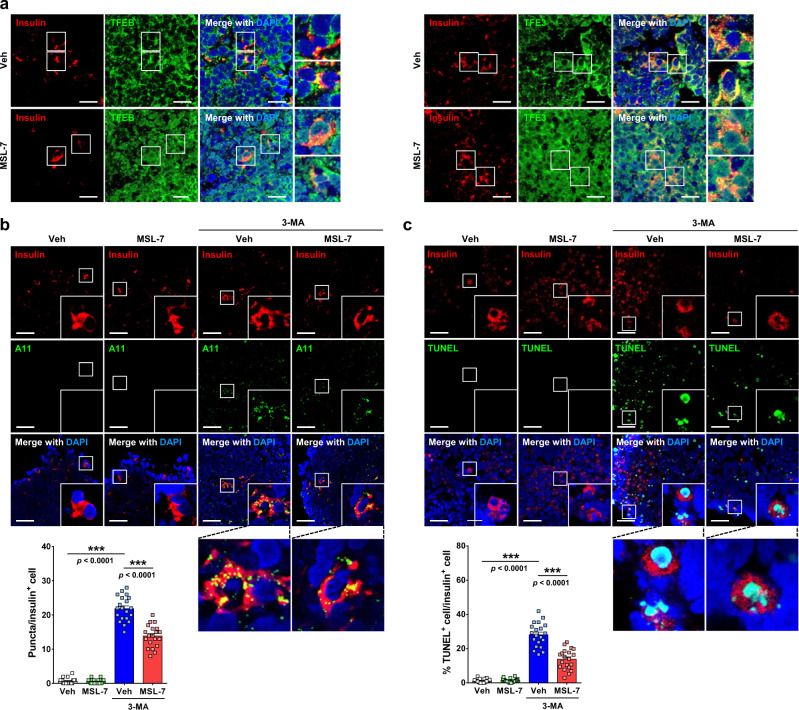
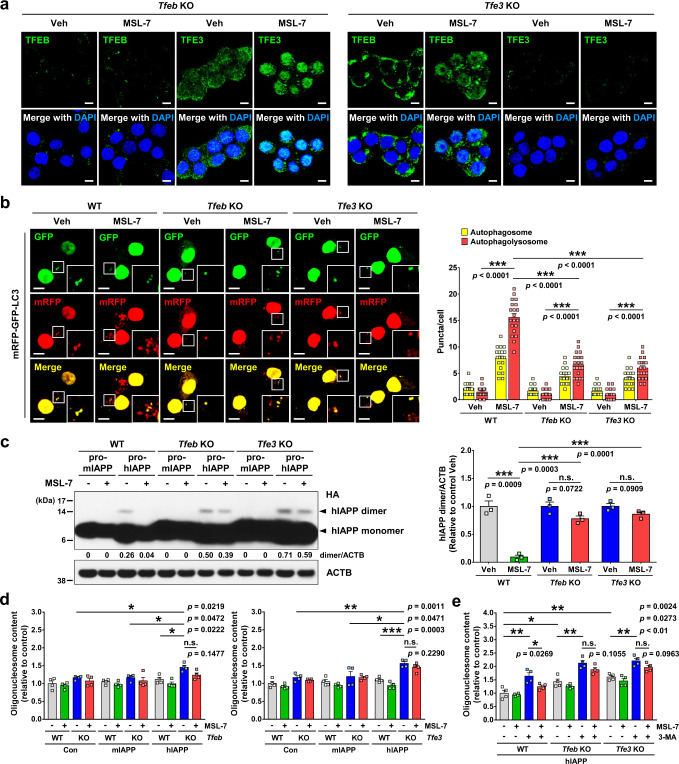
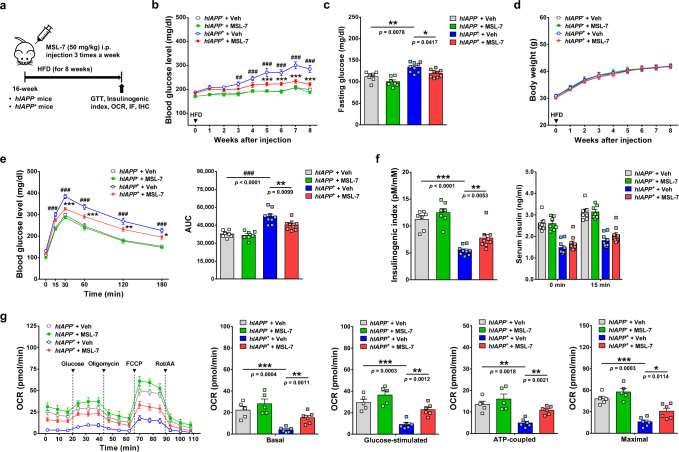
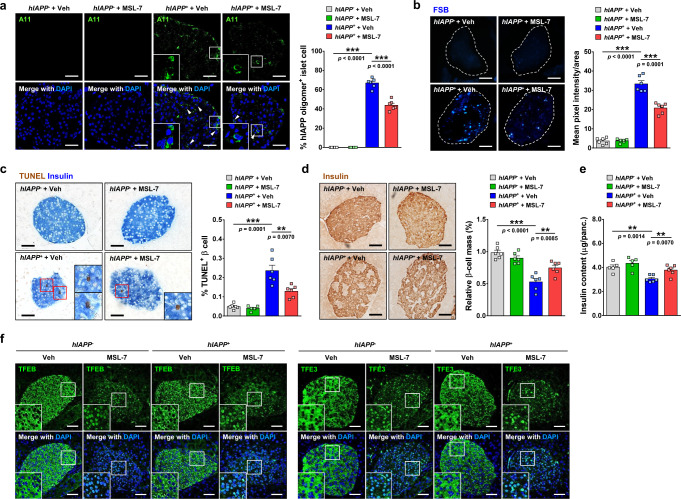
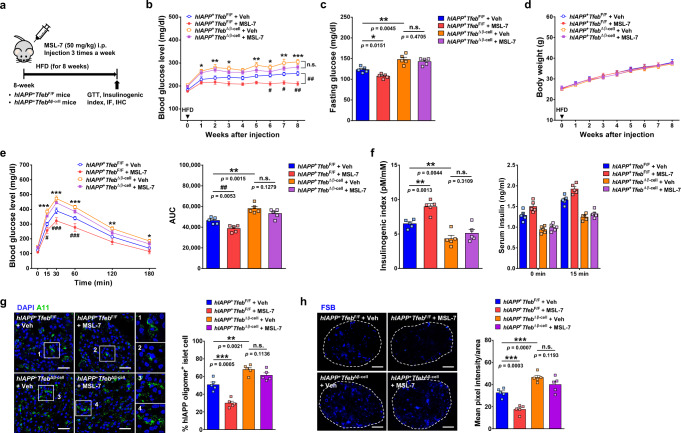
We have reported that autophagy is crucial for clearance of amyloidogenic human IAPP (hIAPP) oligomer, suggesting that an autophagy enhancer could be a therapeutic modality against human diabetes with amyloid accumulation. Here, we show that a recently identified autophagy enhancer (MSL-7) reduces hIAPP oligomer accumulation in human induced pluripotent stem cell-derived β-cells (hiPSC-β-cells) and diminishes oligomer-mediated apoptosis of β-cells. Protective effects of MSL-7 against hIAPP oligomer accumulation and hIAPP oligomer-mediated β-cell death are significantly reduced in cells with knockout of MiTF/TFE family members such as Tfeb or Tfe3. MSL-7 improves glucose tolerance and β-cell function of hIAPP+ mice on high-fat diet, accompanied by reduced hIAPP oligomer/amyloid accumulation and β-cell apoptosis. Protective effects of MSL-7 against hIAPP oligomer-mediated β-cell death and the development of diabetes are also significantly reduced by β-cell-specific knockout of Tfeb. These results suggest that an autophagy enhancer could have therapeutic potential against human diabetes characterized by islet amyloid accumulation.


Conflict of interest statement

The authors declare no competing interests.

Figures

Fig. 1
Fig. 1. Activation of TFEB/TFE3 by MSL-7.
a INS-1 cells were transfected with mRFP-GFP-LC3. The numbers of yellow (autophagosomes) and red puncta (autophagolysosomes) were counted (t = 9.8, df = 38 for autophagosome; t = 17.2, df = 38 for autophagolysosome) (right). Representative pictures are presented (left). Inset images were magnified. b INS-1 cells were treated with MSL-7 in the presence or absence of bafilomycin A1 (BAF). Immunoblotting using the indicated antibodies (ACTB, β-actin) were conducted. Numbers indicate fold changes normalized to ACTB bands. cd Nuclear translocation of TFEB (c) and TFE3 (d) by MSL-7 was counted (t = 29.9, df = 12 in c; t = 38.7, df = 12 in d) (right of c, d). Representative pictures are shown (left of c, d). e INS-1 cells were treated with MSL-7, and immunoblotting using the indicated antibodies were conducted. Numbers indicate fold changes normalized to total TFEB bands. f After lysis of INS-1 cells treated with MSL-7 for 4 h, immunoprecipitation (IP) was conducted using anti-TFEB (left) or anti-TFE3 antibody (right). Supernatant was subjected to immunoblot analysis (IB) using the indicated antibodies. Numbers indicate fold changes normalized to total TFEB or TFE3 bands. g Nuclear and cytosolic fractions of lysates from INS-1 cells treated with MSL-7 were subjected to immunoblot analysis using the indicated antibodies. Numbers indicate fold changes normalized to ACTB bands (cytosol) or Lamin bands (nuclear). h After lysis of Tfeb-GFP-transfected (left) or Tfe3-GFP-transfected cells (right) treated with MSL-7, IP using anti-GFP antibody was conducted. i After treatment of Tfeb-GFP-transfected or Tfe3-GFP-transfected cells with MSL-7, confocal microscopy was conducted. Numbers indicate fold changes normalized to GFP bands. j Real-time RT-PCR was performed using mRNA from INS-1 cells treated with MSL-7 for 6 h and specific primers. All data in this figure are the means ± SEM from more than 3 independent experiments performed in triplicate. (scale bar, 5 μm) *P < 0.05; **P < 0.01; ***P < 0.001 by two-tailed Student’s t-test (a, c, d, j). Source data are provided as a Source Data file.
Fig. 2
Fig. 2. hIAPP/sIAPP oligomer clearance by MSL-7.
a Prepro-mIAPP-HA-transfected or Prepro-hIAPP-HA-transfected INS-1 cells were treated with MSL-7 in the presence or absence of bafilomycin A1 (BAF). Lysate was subjected to immunoblotting using anti-HA or anti-β-actin antibody (ACTB). Numbers indicate fold changes of hIAPP dimer normalized to ACTB bands. (Con, control-transfected). b Prepro-mIAPP-HA-transfected or Prepro-hIAPP-HA-transfected cells were treated with MSL-7 in the presence or absence of 3-MA. Oligonucleosome content was determined (F = 19.5, df treatment = 11, df residual = 36). c–d MSL-7-induced nuclear translocation of TFEB (c) and TFE3 (d) in monkey islet cells was counted (t = 33.2, df = 14 in c; t = 45.7, df = 14 in d) (right of c, d). Representative pictures are presented (left of c, d). e mRFP-GFP-LC3-transfected monkey islet cells were treated with MSL-7. The numbers of autophagosome (t = 9.5, df = 44) and autophagolysosome (t = 10.9, df = 44) were counted (right). Representative pictures are presented (left). Inset images were magnified to show red (autophagolysosomes) and yellow (autophagosomes) puncta. f Monkey islet cells treated with MSL-7 in the presence or absence of 3-MA were subjected to immunostaining using A11 antibody. The number of A11+ puncta was counted (F = 86.3, df treatment = 2, df residual = 42) (right). Representative pictures are presented (left). g Monkey islet cells treated with MSL-7 in the presence of BAF, cells were immunostained using A11 and anti-LC3 antibodies. The number of LC3 puncta colocalized with A11+ oligomer was counted (t = 13.9, df = 38) (right). Representative pictures are shown (left). Inset images were magnified to shows LC3 puncta colocalized with A11+ oligomer. h Apoptosis was determined in MSL-7-treated monkey islet cells in the presence or absence of 3-MA (F = 10.1, df treatment = 3, df residual = 20). All data in this figure are the means ± SEM from more than 3 independent experiments performed in triplicate. (scale bar, 5 μm) *P < 0.05; **P < 0.01; ***P < 0.001 by one-way ANOVA with Tukey’s test (b, f, h) and two-tailed Student’s t-test (c, d, e, g). Source data are provided as a Source Data file.
Fig. 3
Fig. 3. Effect of MSL-7 on the clearance of endogenous hIAPP oligomer in human β-cells differentiated from hiPSCs.
a Expression of insulin and nuclear translocation of TFEB (left) or TFE3 (right) in human β-cells differentiated from human induced pluripotent stem cells (hiPSCs). Inset images were magnified to show cyan nuclei due to colocalization of TFEB with nuclear DAPI or yellow cytoplasm due to colocalization of TFEB with insulin+ cytoplasm. b Islet-like clusters differentiated from hiPSCs were treated with MSL-7 in the presence or absence of 3-MA for 16 h. After double immunofluorescence using A11 and anti-insulin antibodies as the primary antibodies, confocal microscopy was conducted and the number of A11+ puncta in insulin-producing β-cells was counted (F = 357.2, df treatment = 3, df residual = 76) (lower). Representative pictures are presented (upper). Inset images were magnified. c After treatment of islet-like clusters differentiated from hiPSCs cells with MSL-7 in the presence or absence of 3-MA for 16 h, combined TUNEL staining and insulin immunofluorescence were conducted, and the percentage of TUNEL+ apoptotic cells among insulin-producing β-cells was counted (F = 150.3, df treatment = 3, df residual = 76) (lower). Representative pictures are presented (upper). Inset images were magnified to show cyan nuclei due to colocalization of TUNEL staining with nuclear DAPI. All data in this figure are the means ± SEM from more than 3 independent experiments. (n = 20 islet-like clusters in a, b, c) (scale bar, 50 μm for a and 100 μm for b, c) ***P < 0.001 by one-way ANOVA with Tukey’s test.
Fig. 4
Fig. 4. Reduced MSL-7 effects in Tfeb-KO or Tfe3-KO cells in vitro.
a Tfeb-KO or Tfe3-KO INS-1 cells were treated with MSL-7 for 4 h, and immunostained using anti-TFEB (left) or anti-TFE3 antibody (right). After DAPI staining, cells were subjected to confocal microscopy. b Tfeb-KO or Tfe3-KO INS-1 cells transfected with mRFP-GFP-LC3 tandem construct were treated with MSL-7 for 16 h, and the numbers of autophagosome and autophagolysosome were counted (F = 178.7, df treatment = 5, df residual = 114) (right). Representative pictures are presented (left). Inset images were magnified to show red (autophagolysosomes), green, and yellow (autophagosomes) puncta. c Tfeb-KO or Tfe3-KO INS-1 cells transfected with prepro-mIAPP-HA or prepro-hIAPP-HA were treated with MSL-7 for 16 h. Immunoblot analysis was conducted (F = 32.9, df treatment = 5, df residual = 12) (left). Densitometric value of HA bands normalized to the respective vehicle-treated cells (−) are presented (right). d Tfeb-KO (left) or Tfe3-KO (right) INS-1 cells transfected with prepro-mIAPP-HA or prepro-hIAPP-HA were treated with MSL-7 for 16 h without 3-MA, and apoptosis was measured (F = 5.8, df treatment = 11, df residual = 36 in left panel; F = 11.3, df treatment = 11, df residual = 36 in right panel). e Tfeb-KO or Tfe3-KO INS-1 cells transfected with prepro-mIAPP-HA or prepro-hIAPP-HA were treated with MSL-7 for 16 h in the presence of 3-MA, and apoptosis was measured (F = 24.1, df treatment = 11, df residual = 36). All data in this figure are the means ± SEM from more than 3 independent experiments performed in triplicate. (scale bar, 5 μm) *P < 0.05; **P < 0.01; ***P < 0.001 by one-way ANOVA with Tukey’s test. (n.s. not significant) Source data are provided as a Source Data file.
Fig. 5
Fig. 5. Metabolic effect of MSL-7 on hIAPP+ mice.
a Scheme of MSL-7 treatment. b MSL-7 was administered intraperitoneally (i.p.) to HFD-fed male hIAPP+ mice. Nonfasting blood glucose was monitored (F = 35.0, df = 3). c Fasting blood glucose was determined in HFD-fed hIAPP+ mice treated with MSL-7 for 8 weeks (F = 14.3, df treatment = 3, df residual = 28). d Body weight of HFD-fed hIAPP+ mice was monitored during MSL-7 administration. e GTT was performed after MSL-7 administration to HFD-fed hIAPP+ mice (F = 24.4, df = 3) (left). AUC was calculated (F = 22.3, df treatment = 3, df residual = 28) (right). f Insulinogenic index was calculated after MSL-7 administration to HFD-fed hIAPP+ mice (F = 29.2, df treatment = 3, df residual = 28) (left). Serum insulin levels before and 15 min after glucose injection are shown (right). g Islets were isolated from HFD-fed hIAPP+ and hIAPP mice treated with vehicle (Veh) or MSL-7, and were subjected to respirometry using Seahorse XF analyzer (left). Basal (F = 13.7, df treatment = 3, df residual = 18), glucose-stimulated (F = 19.1, df treatment = 3, df residual = 18), ATP-coupled (F = 12.4, df treatment = 3, df residual = 18) and maximal O2 consumption (F = 23.7, df treatment = 3, df residual = 18) were calculated. All data in this figure are the means ± SEM from more than 3 independent experiments. (n = 7 for Veh-treated hIAPP mice, n = 7 for MSL-7-treated hIAPP mice, n = 9 for Veh-treated hIAPP+ mice and n = 9 for MSL-7-treated hIAPP+ mice in b–f; n = 5 for Veh-treated hIAPP mice, n = 5 for MSL-7-treated hIAPP mice treated, n = 6 for Veh-treated hIAPP+ mice and n = 6 for MSL-7-treated hIAPP+ mice in g) *P < 0.05; ##P or **P < 0.01; ###P or ***P < 0.001 by two-way ANOVA with Bonferroni’s test (b, e) and one-way ANOVA with Tukey’s test (c, e, f, g). (#, comparison between Veh-treated hIAPP+ and Veh-treated hIAPP mice; *, comparison between MSL-7-treated hIAPP+ and Veh-treated hIAPP+ mice in b, e).
Fig. 6
Fig. 6. Pancreatic islets of hIAPP+ mice treated with MSL-7.
a Percentage of A11 puncta+ cells among total DAPI+ islet cells in pancreatic sections from HFD-fed hIAPP+ mice treated with MSL-7 for 8 weeks was determined by confocal microscopy (F = 498.6, df treatment = 3, df residual = 20) (right). Representative pictures are shown (left). Inset images were magnified. Arrow heads indicate islet cells with pyknotic nuclei (n = 6 each, 132–148 islets per group). b Mean fluorescence intensity of FSB staining per islet area was determined using ImageJ (F = 178.3, df treatment = 3, df residual = 20) (right). Representative pictures are shown (left). (n = 6 each, 151–156 islets per group). c Percentage of TUNEL+ β-cells among total β-cells in sections of HFD-fed hIAPP+ mice treated with MSL-7 was calculated (F = 31.5, df treatment = 3, df residual = 20) (right). Representative TUNEL staining is shown (left). Insets (TUNEL+ β-cells) were magnified. (n = 6 each, 180–182 islets per group). d Relative β-cell mass in HFD-fed hIAPP+ mice treated with MSL-7 was determined by insulin immunohistochemistry and point counting (F = 22.2, df treatment = 3, df residual = 20) (right). Representative insulin immunochemistry is shown (left). (n = 6 each, 180–182 islets per group). e Insulin content of pancreatic islets from HFD-fed hIAPP+ and hIAPP mice treated with MSL-7 was measured by ELISA, which was normalized to the total pancreas weight (F = 9.5, df treatment = 3, df residual = 18). (n = 5 for Veh-treated hIAPP mice, n = 5 for MSL-7-treated hIAPP mice, n = 6 for Veh-treated hIAPP+ mice and n = 6 for MSL-7-treated hIAPP+ mice). f Immunfluorescence of pancreatic sections from HFD-fed hIAPP+ and hIAPP mice treated with MSL-7 using anti-TFEB (left) and anti-TFE3 antibodies (right). Insets were magnified to show colocalization of TFEB/TFE3 with nuclear DAPI. (n = 6 each) All data in this figure are the means ± SEM from more than 3 independent experiments. (scale bar, 100 μm) **P < 0.01; ***P < 0.001 by one-way ANOVA with Tukey’s test.
Fig. 7
Fig. 7. Role of pancreatic β-cell Tfeb in MSL-7-induced metabolic improvement.
a Scheme of MSL-7 administration to hIAPP+TfebΔβ-cell mice. b Nonfasting blood glucose was monitored weekly during MSL-7 treatment (F = 28.0, df = 3). (n = 5 each). c Fasting blood glucose in HFD-fed hIAPP+TfebΔβ-cell and hIAPP+TfebF/F mice treated with MSL-7 (F = 23.2, df treatment = 3, df residual = 16). (n = 5 each). d Body weight before and during MSL-7 treatment of HFD-fed hIAPP+TfebΔβ-cell and hIAPP+TfebF/F mice. (n = 5 each). e GTT in HFD-fed hIAPP+TfebΔβ-cell or hIAPP+TfebF/F mice treated with MSL-7 (F = 26.9, df = 3) (left). AUC was calculated (F = 23.4, df treatment = 3, df residual = 16) (right). (n = 5 each). f Insulinogenic index in HFD-fed hIAPP+TfebΔβ-cell or hIAPP+TfebF/F mice treated with MSL-7 (F = 21.0, df treatment = 3, df residual = 16) (left). Serum insulin before and 15 min after glucose injection (right). (n = 5 each). g Percentage of A11+ cells among total islet cells in sections of HFD-fed hIAPP+TfebΔβ-cell or hIAPP+TfebF/F mice treated with MSL-7 (F = 40.9, df treatment = 3, df residual = 16) (right). Representative pictures were presented (left). Inset images were magnified. (n = 5 each, 36–45 islets). h Mean pixel intensity of FSB per islet area in sections from HFD-fed hIAPP+TfebΔβ-cell or hIAPP+TfebF/F mice treated with MSL-7 (F = 32.0, df treatment = 3, df residual = 16) (right). Representative pictures were presented (left). (n = 5 each, 40–51 islets). All data in this figure are the means ± SEM from more than 3 independent experiments. (scale bar, 100 μm) #P or *P < 0.05; ##P or **P < 0.01; ###P or ***P < 0.001 by two-way ANOVA with Bonferroni’s test (b, e) and one-way ANOVA with Tukey’s test (c, e, f, g, h). (#, comparison between MSL-7-treated hIAPP+TfebF/F and Veh-treated hIAPP+TfebF/F mice; *, comparison between Veh-treated hIAPP+TfebΔβ-cell and Veh-treated hIAPP+TfebF/F mice in b, e). (n.s. not significant).

Similar articles

Cited by

References

    1. Dolenšek J, Rupnik MS, Stožer A. Structural similarities and differences between the human and the mouse pancreas. Islets. 2015;7:e1024405. doi: 10.1080/19382014.2015.1024405. - DOI - PMC - PubMed
    1. Westermark P, Andersson A, Westernark GT. Islet amyloid polypeptide, islet amyloid, and diabetes mellitus. Physiol. Rev. 2011;91:795–826. doi: 10.1152/physrev.00042.2009. - DOI - PubMed
    1. Kim J, et al. Amyloidogenic peptide oligomer accumulation in autophagy-deficient b-cells leads to diabetes. J. Clin. Invest. 2014;125:3311–3324. doi: 10.1172/JCI69625. - DOI - PMC - PubMed
    1. Rivera JF, Costes S, Gurlo T, Glabe C, Butler PC. Autophagy defends pancreatic b-cells from human islet amyloid polypeptide-induced toxicity. J. Clin. Invest. 2014;124:3489–3500. doi: 10.1172/JCI71981. - DOI - PMC - PubMed
    1. Shigihara N, et al. Human IAPP-induced pancreatic beta-cell toxicity and its regulation by autophagy. J. Clin. Invest. 2014;124:3634–3644. doi: 10.1172/JCI69866. - DOI - PMC - PubMed

Publication types

MeSH terms

Substances