. 2021 Jan 8;12(1):185.
doi: 10.1038/s41467-020-20497-2.

Properties and dynamics of meron topological spin textures in the two-dimensional magnet CrCl3

Affiliations

Properties and dynamics of meron topological spin textures in the two-dimensional magnet CrCl3

Mathias Augustin et al. Nat Commun. .

Abstract

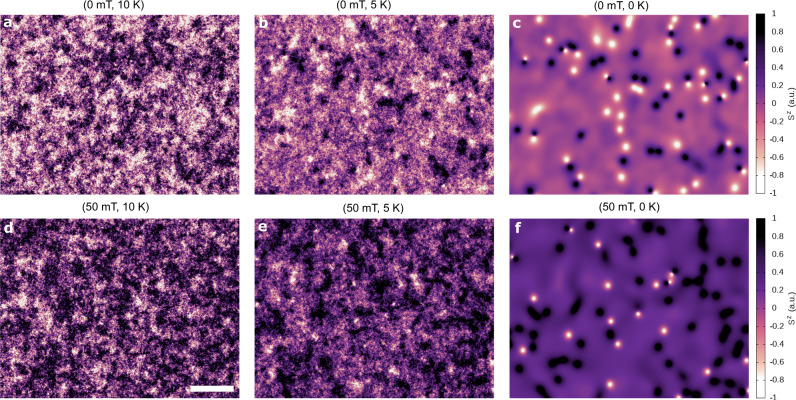
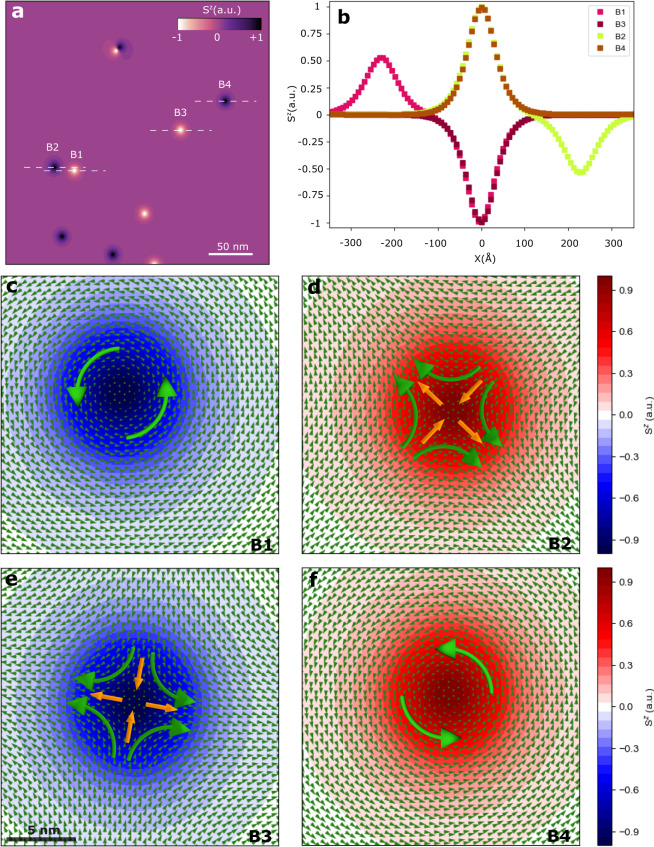
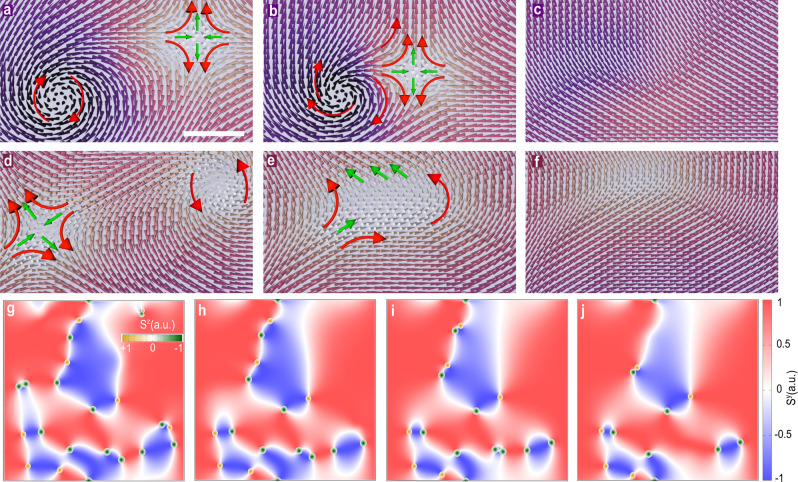
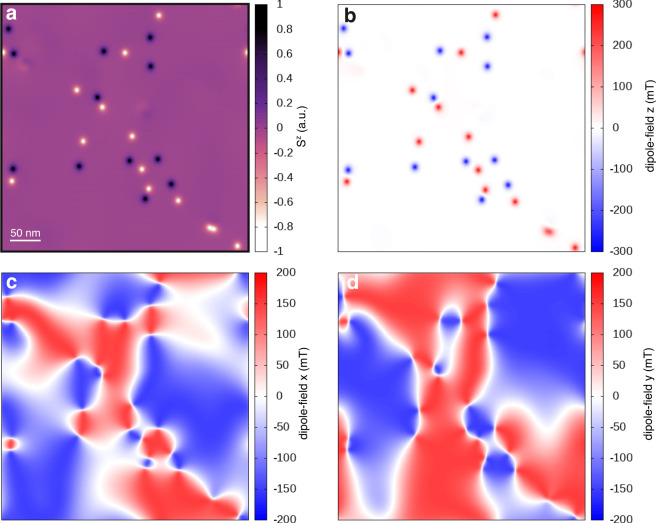
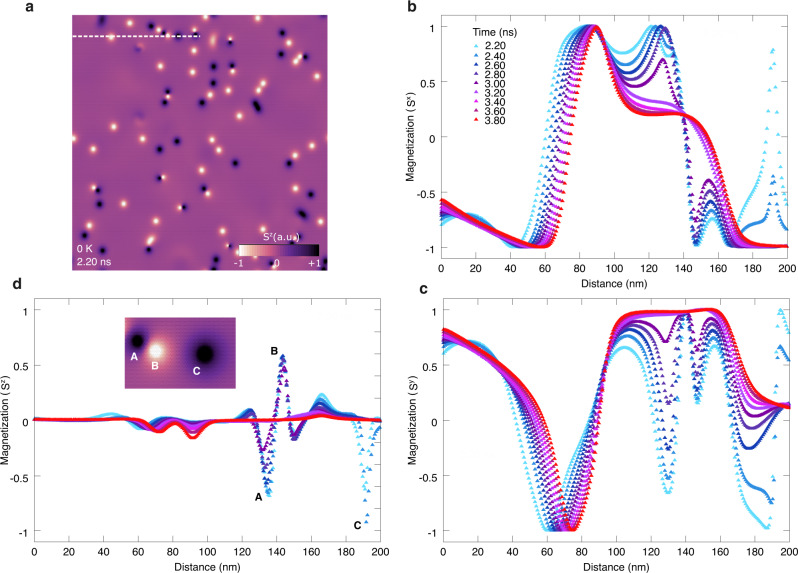
Merons are nontrivial topological spin textures highly relevant for many phenomena in solid state physics. Despite their importance, direct observation of such vortex quasiparticles is scarce and has been limited to a few complex materials. Here, we show the emergence of merons and antimerons in recently discovered two-dimensional (2D) CrCl3 at zero magnetic field. We show their entire evolution from pair creation, their diffusion over metastable domain walls, and collision leading to large magnetic monodomains. Both quasiparticles are stabilized spontaneously during cooling at regions where in-plane magnetic frustration takes place. Their dynamics is determined by the interplay between the strong in-plane dipolar interactions and the weak out-of-plane magnetic anisotropy stabilising a vortex core within a radius of 8-10 nm. Our results push the boundary to what is currently known about non-trivial spin structures in 2D magnets and open exciting opportunities to control magnetic domains via topological quasiparticles.


Conflict of interest statement

The authors declare no competing interests.

Figures

Fig. 1
Fig. 1. Nucleation of merons and antimerons during the cooling process.
ac Dynamical spin configurations obtained at different temperatures (T) showing the evolution of the domain structure and the formation of merons and antimerons during field cooling in an external field of 0.0 mT. The Sz component is used to follow the evolution of the different spin textures across the crystal surface (color map). Strong spin fluctuations are observed at temperatures below the critical temperature (Tc = 19.07 K, see Supplementary Fig S1), which incidentally vanished as the system cools down. Localized small areas within 0 K ≤ T ≤ 5 K correspond to spins pointed perpendicular to the easy-plane of CrCl3 in different spin polarizations (e.g.,  +1 or −1). At 0 K, most of the magnitudes of Sz are zero throughout the crystal except at well defined small spots with either Sz = +1 or Sz = −1 in their cores. The formation of merons and antimerons occur simultaneously during the time evolution without a clear preference over the nucleation site. That is, boundaries, defects or edges are not considered. df Similar to ac but at an external field of 50 mT. The applied field polarizes the spin configurations resulting in less fluctuations along of Sz even though with alike domain dynamics. At T ≤ 5 K, the merons and antimerons are still formed but with a more preferential spin polarization, e.g., darker spots. If larger magnetic fields beyond 50 mT are applied (e.g., 100 mT), a full polarization of the topological spin textures is observed with a totality of just one kind of spin polarization. For fields above 150 mT, there is no additional nucleation of merons and antimerons throughout the crystal as the spin textures outside the vortex core follows the field direction. See Supplementary Figs. S2, S3 and Supplementary Movies S1–S3 for details. Scale bar is 50 nm.
Fig. 2
Fig. 2. Characterizing the spin features of merons and antimerons.
a Snapshot of a spin configuration projected along the Sz component (color map) at a selected time with the formation of merons and antimerons at zero magnetic field and 0 K. Some of the topological spin textures are marked as B1–B4 to highlight their features. b Profile of Sz along the dashed lines in a over the distinct spin quasiparticles (B1, B2, B3, B4) showing their widths in Å’s. B1 and B2 are close enough to feel the opposite spin polarization from each other. The largest peak at 0 Å is centered at the center of the meron or antimeron. B2 and B4 have both positive spin polarization with similar peak magnitude at 0 Å (Sz = +1), which is the opposite of B1 and B3. cf Spin textures of the different quasiparticles stabilized in monolayer CrCl3. Merons (c, d) and antimerons (e, f) can be determined by the topological number N (Eq. (4)), which involves the vorticity (±1) and the core polarization. B1 and B4 have the same vorticity of +1 even though they are meron (N = −1/2) and antimeron (N = +1/2), respectively. Similar argument applies to B2 and B3, that is, both have vorticity of −1 but are meron and antimeron, respectively. Small arrows (green) indicate the direction and magnitude of the in-plane magnetization relative to the core (zero value). The underneath color gradient shows the variation of Sz around the spin textures. It reaches its maximum magnitude at the core of the merons and antimerons. Large arrows (orange and green) give the average behavior observed around the vortex core by the in-plane magnetization.
Fig. 3
Fig. 3. Meron and antimeron collision.
ac, df Snapshots of the vortex and antivortex dynamics with antiparallel and parallel core polarization, respectively, before (a, d), during (b, e), and after (c, f) the collisions at zero field and 0 K. The dark and bright backgrounds indicate a more out-of-plane magnetization at the core of the vortex and antivortex. The big arrows in a, b, d, and e indicate the average behavior of the in-plane spin components in the perimeter. In all considered topological spin textures, similar collision scenarios are observed, which take roughly between 0.57 ns (ac) and 0.17 ns (df) to occur. Scale bar is 4 nm. gj Macroscale magnetic domains (blue and red) at different times showing the evolution of the merons and antimerons (small circles in green and orange) at the boundary between magnetic domains. The Sy component (color map) of the magnetization is utilized to show the magnetic domain structure whereas Sz for the vortex and antivortex textures. The white boundary near where the merons and antimerons are localized have Sy = 0 and Sx = 0 (Supplementary Fig. S6). Sz reaches its maximum magnitude at the center of the spin textures (inset color map in g). The dynamics of the domains is directly coupled to the motion of the merons and antimerons, and vice-versa. At sufficient longer times, the entire system results in a mono-domain throughout the surface.
Fig. 4
Fig. 4. Dipolar interactions driven the formation of merons and antimerons.
a Snapshot of one of the spin dynamics at 0 K and zero magnetic field showing the out-of-plane spin component Sz (color map) throughout the surface of monolayer CrCl3. bd Projection of the dipole–dipole interactions along of z, x, and y directions, respectively, on the snapshot in a. The dipole fields are quantified in mT with positive (red) and negative (blue) magnitudes in the color scale. The scale bar of 50 nm is common to all panels.
Fig. 5
Fig. 5. Spin fluctuations-driven magnetic domain metastability.
a Snapshot of a spin dynamics of monolayer CrCl3 obtained through zero-field cooling after 2 ns and reaching 0 K. The magnetization perpendicular to the surface (Sz) is displayed showing the formation of merons and antimerons (small dots). Bright (dark) areas correspond to Sz = ±1, respectively, in the color scale. A path (dashed line) of 200 nm is drawn to show the spatial variation of the magnetization at different times (t ≥ 2.20 ns). bd Variations of the in-plane components of the magnetization (Sx, Sy) and Sz, respectively, along of the path shown in a within 2.20–3.80 ns after 0 K is reached. The inset in d shows a small area from a along the path with the formation of the merons and antimerons. The corresponding variation of Sz at different times at A, B, and C is also showed.

References

    1. Huang B, et al. Layer-dependent ferromagnetism in a van der waals crystal down to the monolayer limit. Nature. 2017;546:270–273. doi: 10.1038/nature22391. - DOI - PubMed
    1. Gong C, et al. Discovery of intrinsic ferromagnetism in two-dimensional van der waals crystals. Nature. 2017;546:265–269. doi: 10.1038/nature22060. - DOI - PubMed
    1. Guguchia, Z. et al. Magnetism in semiconducting molybdenum dichalcogenides. Sci. Adv.4. https://advances.sciencemag.org/content/4/12/eaat3672 (2018). - PMC - PubMed
    1. Klein DR, et al. Probing magnetism in 2d van der waals crystalline insulators via electron tunneling. Science. 2018;360:1218–1222. doi: 10.1126/science.aar3617. - DOI - PubMed
    1. Chen W, et al. Direct observation of van der waals stacking–dependent interlayer magnetism. Science. 2019;366:983–987. doi: 10.1126/science.aav1937. - DOI - PubMed