Integrated analysis of telomerase enzymatic activity unravels an association with cancer stemness and proliferation
- PMID: 33420056
- PMCID: PMC7794223
- DOI: 10.1038/s41467-020-20474-9
Integrated analysis of telomerase enzymatic activity unravels an association with cancer stemness and proliferation
Abstract
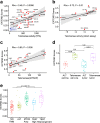
Active telomerase is essential for stem cells and most cancers to maintain telomeres. The enzymatic activity of telomerase is related but not equivalent to the expression of TERT, the catalytic subunit of the complex. Here we show that telomerase enzymatic activity can be robustly estimated from the expression of a 13-gene signature. We demonstrate the validity of the expression-based approach, named EXTEND, using cell lines, cancer samples, and non-neoplastic samples. When applied to over 9,000 tumors and single cells, we find a strong correlation between telomerase activity and cancer stemness. This correlation is largely driven by a small population of proliferating cancer cells that exhibits both high telomerase activity and cancer stemness. This study establishes a computational framework for quantifying telomerase enzymatic activity and provides new insights into the relationships among telomerase, cancer proliferation, and stemness.
Conflict of interest statement
The authors declare no competing interests.
Figures


Similar articles
-
Essential roles of telomerase reverse transcriptase hTERT in cancer stemness and metastasis.FEBS Lett. 2018 Jun;592(12):2023-2031. doi: 10.1002/1873-3468.13084. Epub 2018 May 18. FEBS Lett. 2018. PMID: 29749098 Review.
-
Mechanisms underlying the activation of TERT transcription and telomerase activity in human cancer: old actors and new players.Oncogene. 2019 Aug;38(34):6172-6183. doi: 10.1038/s41388-019-0872-9. Epub 2019 Jul 8. Oncogene. 2019. PMID: 31285550 Free PMC article. Review.
-
Telomerase reverse transcriptase promotes epithelial-mesenchymal transition and stem cell-like traits in cancer cells.Oncogene. 2013 Sep 5;32(36):4203-13. doi: 10.1038/onc.2012.441. Epub 2012 Oct 8. Oncogene. 2013. PMID: 23045275
-
Telomerase activity-independent function of TERT allows glioma cells to attain cancer stem cell characteristics by inducing EGFR expression.Mol Cells. 2011 Jan;31(1):9-15. doi: 10.1007/s10059-011-0008-8. Epub 2010 Dec 24. Mol Cells. 2011. PMID: 21193962 Free PMC article.
-
Telomerase Biology Associations Offer Keys to Cancer and Aging Therapeutics.Curr Aging Sci. 2020;13(1):11-21. doi: 10.2174/1874609812666190620124324. Curr Aging Sci. 2020. PMID: 31544708 Free PMC article. Review.
Cited by
-
Signature-scoring methods developed for bulk samples are not adequate for cancer single-cell RNA sequencing data.Elife. 2022 Feb 25;11:e71994. doi: 10.7554/eLife.71994. Elife. 2022. PMID: 35212622 Free PMC article.
-
T-Cell Factors as Transcriptional Inhibitors: Activities and Regulations in Vertebrate Head Development.Front Cell Dev Biol. 2021 Nov 24;9:784998. doi: 10.3389/fcell.2021.784998. eCollection 2021. Front Cell Dev Biol. 2021. PMID: 34901027 Free PMC article. Review.
-
Genetic regulation of TERT splicing affects cancer risk by altering cellular longevity and replicative potential.Nat Commun. 2025 Feb 16;16(1):1676. doi: 10.1038/s41467-025-56947-y. Nat Commun. 2025. PMID: 39956830 Free PMC article.
-
The 5th Kidney Cancer Research Summit: Research Accelerating Cures for Renal Cell Carcinoma in 2023.Oncologist. 2024 Feb 2;29(2):91-98. doi: 10.1093/oncolo/oyad322. Oncologist. 2024. PMID: 38048064 Free PMC article.
-
Pan-Cancer Analyses Identify the CTC1-STN1-TEN1 Complex as a Protective Factor and Predictive Biomarker for Immune Checkpoint Blockade in Cancer.Front Genet. 2022 Mar 16;13:859617. doi: 10.3389/fgene.2022.859617. eCollection 2022. Front Genet. 2022. PMID: 35368664 Free PMC article.
References
Publication types
MeSH terms
Substances
Grants and funding
LinkOut - more resources
Full Text Sources
Other Literature Sources
Medical

