

A map of copy number variations in the Tunisian population: a valuable tool for medical genomics in North Africa
- PMID: 33420067
- PMCID: PMC7794582
- DOI: 10.1038/s41525-020-00166-5
A map of copy number variations in the Tunisian population: a valuable tool for medical genomics in North Africa
Abstract
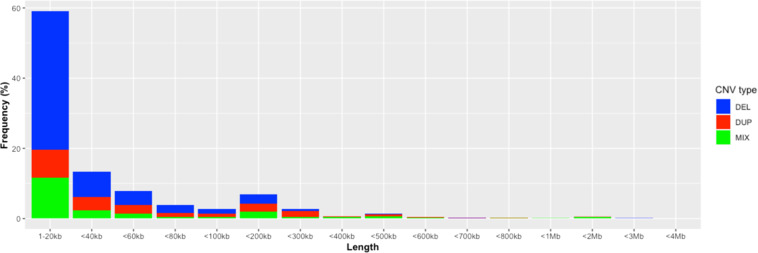
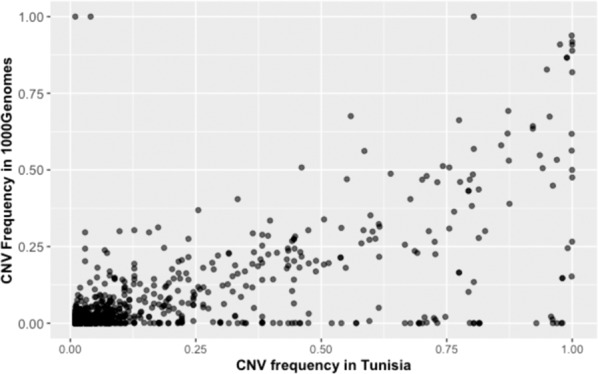
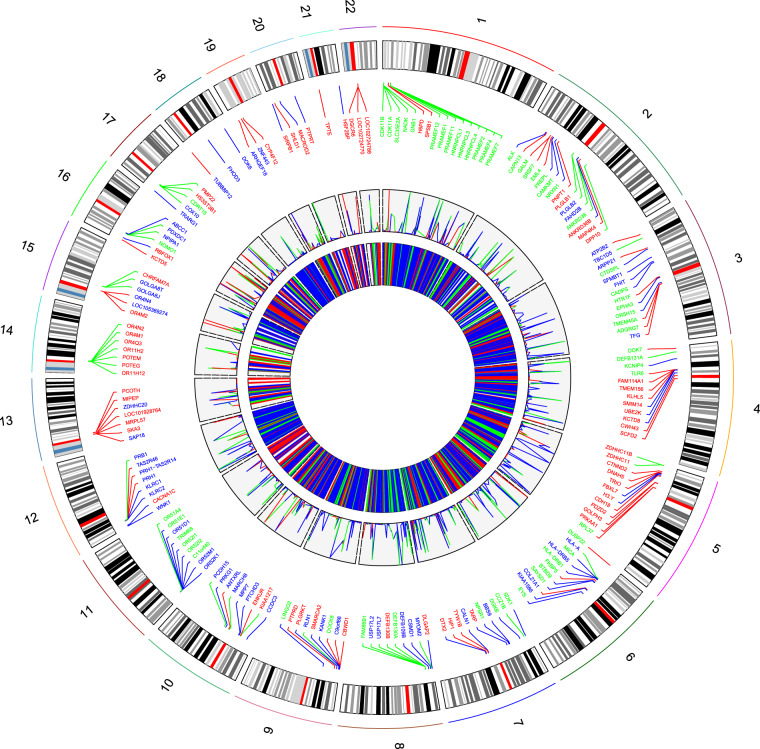
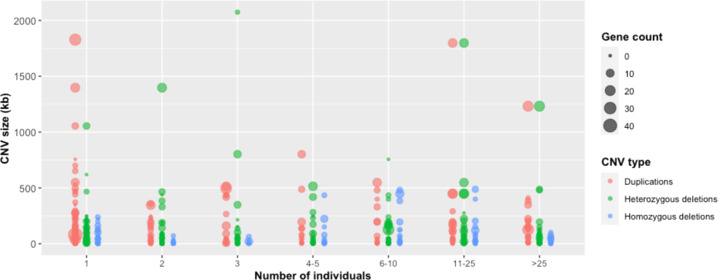
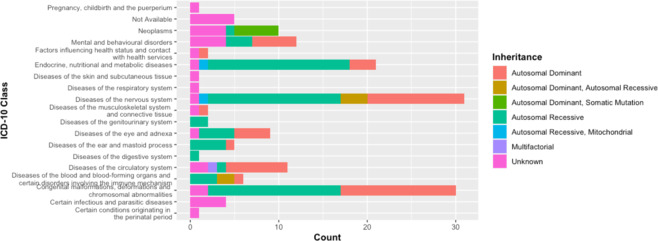
Copy number variation (CNV) is considered as the most frequent type of structural variation in the human genome. Some CNVs can act on human phenotype diversity, encompassing rare Mendelian diseases and genomic disorders. The North African populations remain underrepresented in public genetic databases in terms of single-nucleotide variants as well as for larger genomic mutations. In this study, we present the first CNV map for a North African population using the Affymetrix Genome-Wide SNP (single-nucleotide polymorphism) array 6.0 array genotyping intensity data to call CNVs in 102 Tunisian healthy individuals. Two softwares, PennCNV and Birdsuite, were used to call CNVs in order to provide reliable data. Subsequent bioinformatic analyses were performed to explore their features and patterns. The CNV map of the Tunisian population includes 1083 CNVs spanning 61.443 Mb of the genome. The CNV length ranged from 1.017 kb to 2.074 Mb with an average of 56.734 kb. Deletions represent 57.43% of the identified CNVs, while duplications and the mixed loci are less represented. One hundred and three genes disrupted by CNVs are reported to cause 155 Mendelian diseases/phenotypes. Drug response genes were also reported to be affected by CNVs. Data on genes overlapped by deletions and duplications segments and the sequence properties in and around them also provided insights into the functional and health impacts of CNVs. These findings represent valuable clues to genetic diversity and personalized medicine in the Tunisian population as well as in the ethnically similar populations from North Africa.
Conflict of interest statement
The authors declare no competing interests.
Figures
Similar articles
-
Copy number variations in the genome of the Qatari population.BMC Genomics. 2015 Oct 22;16:834. doi: 10.1186/s12864-015-1991-5. BMC Genomics. 2015. PMID: 26490036 Free PMC article.
-
Evaluation of copy number variation detection for a SNP array platform.BMC Bioinformatics. 2014 Feb 21;15:50. doi: 10.1186/1471-2105-15-50. BMC Bioinformatics. 2014. PMID: 24555668 Free PMC article.
-
Inter- and intra-breed genome-wide copy number diversity in a large cohort of European equine breeds.BMC Genomics. 2019 Oct 22;20(1):759. doi: 10.1186/s12864-019-6141-z. BMC Genomics. 2019. PMID: 31640551 Free PMC article.
-
[Copy number variations in the human genome: their mutational mechanisms and roles in diseases].Yi Chuan. 2011 Aug;33(8):857-69. doi: 10.3724/sp.j.1005.2011.00857. Yi Chuan. 2011. PMID: 21831802 Review. Chinese.
-
The current excitement about copy-number variation: how it relates to gene duplications and protein families.Curr Opin Struct Biol. 2008 Jun;18(3):366-74. doi: 10.1016/j.sbi.2008.02.005. Epub 2008 May 27. Curr Opin Struct Biol. 2008. PMID: 18511261 Free PMC article. Review.
Cited by
-
Decoding the genetic relationship between Alzheimer's disease and type 2 diabetes: potential risk variants and future direction for North Africa.Front Aging Neurosci. 2023 Jun 5;15:1114810. doi: 10.3389/fnagi.2023.1114810. eCollection 2023. Front Aging Neurosci. 2023. PMID: 37342358 Free PMC article.
-
Individualized Medicine in Africa: Bringing the Practice Into the Realms of Population Heterogeneity.Front Genet. 2022 Apr 14;13:853969. doi: 10.3389/fgene.2022.853969. eCollection 2022. Front Genet. 2022. PMID: 35495155 Free PMC article.
-
Genomics of rare diseases in the Greater Middle East.Nat Genet. 2025 Mar;57(3):505-514. doi: 10.1038/s41588-025-02075-8. Epub 2025 Feb 3. Nat Genet. 2025. PMID: 39901015 Review.
-
Ethnic and functional differentiation of copy number polymorphisms in Tunisian and HapMap population unveils insights on genome organizational plasticity.Sci Rep. 2024 Feb 26;14(1):4654. doi: 10.1038/s41598-024-54749-8. Sci Rep. 2024. PMID: 38409353 Free PMC article.
-
Population history modulates the fitness effects of Copy Number Variation in the Roma.Hum Genet. 2023 Sep;142(9):1327-1343. doi: 10.1007/s00439-023-02579-5. Epub 2023 Jun 14. Hum Genet. 2023. PMID: 37311904 Free PMC article.
References
Grants and funding
LinkOut - more resources
Full Text Sources
Other Literature Sources
Miscellaneous
