. 2021 Jan 8;12(1):155.
doi: 10.1038/s41467-020-20466-9.

Structures of human dual oxidase 1 complex in low-calcium and high-calcium states

Affiliations

Structures of human dual oxidase 1 complex in low-calcium and high-calcium states

Jing-Xiang Wu et al. Nat Commun. .

Abstract

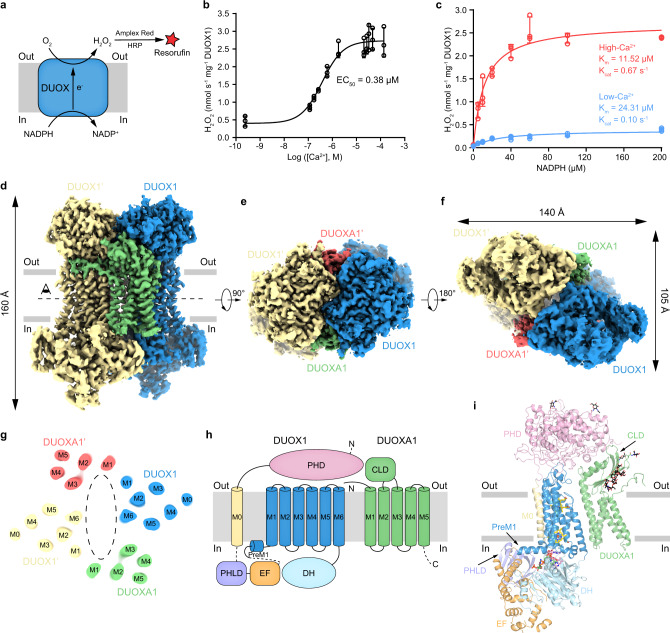
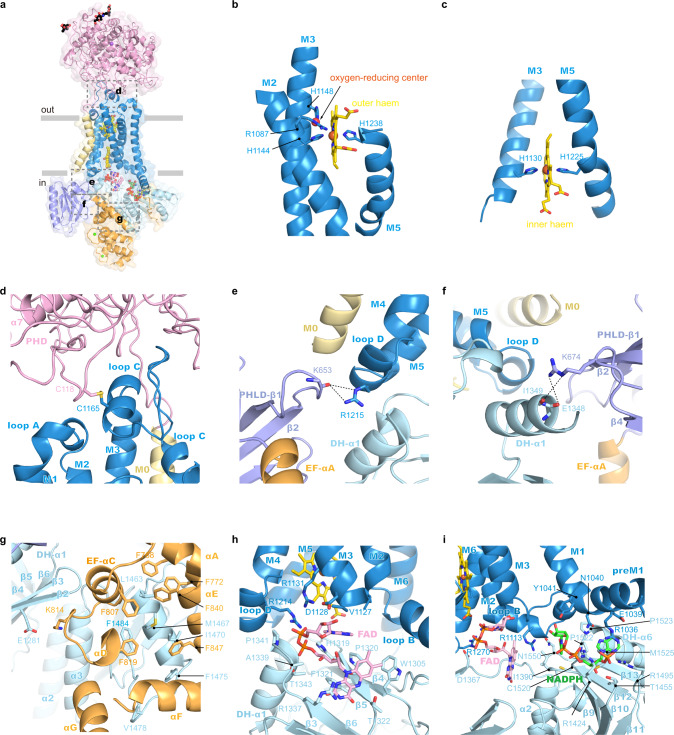
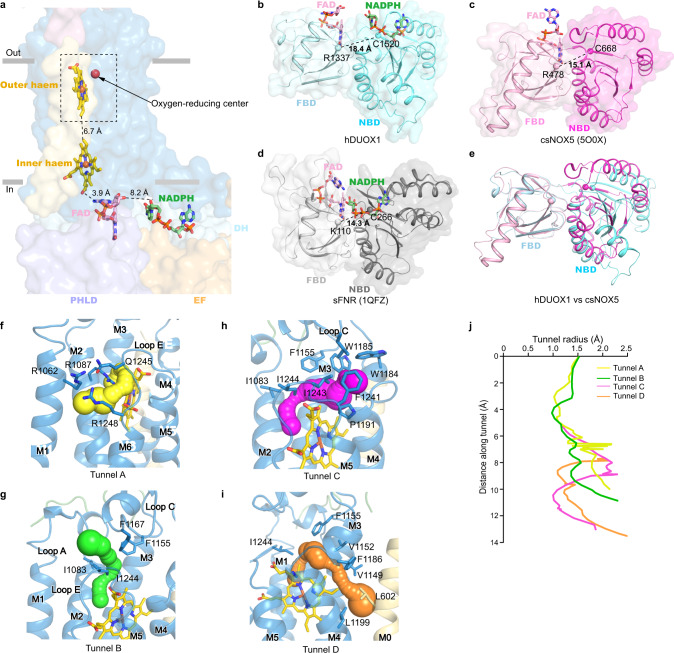
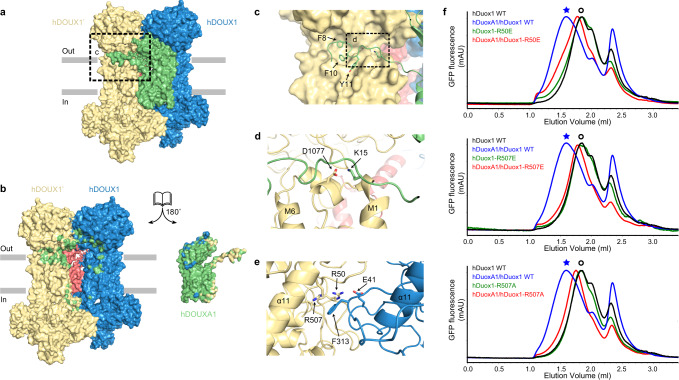
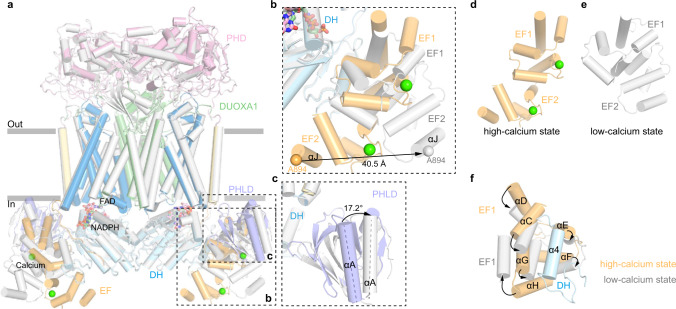
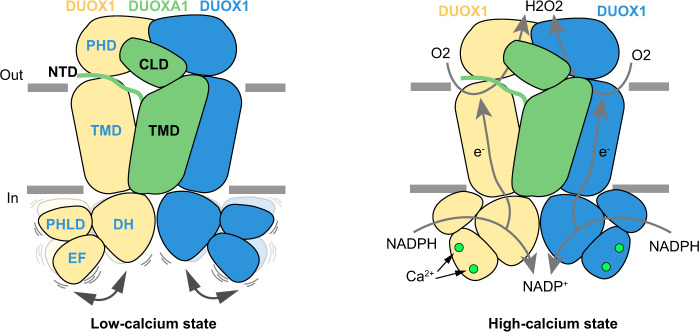
Dual oxidases (DUOXs) produce hydrogen peroxide by transferring electrons from intracellular NADPH to extracellular oxygen. They are involved in many crucial biological processes and human diseases, especially in thyroid diseases. DUOXs are protein complexes co-assembled from the catalytic DUOX subunits and the auxiliary DUOXA subunits and their activities are regulated by intracellular calcium concentrations. Here, we report the cryo-EM structures of human DUOX1-DUOXA1 complex in both high-calcium and low-calcium states. These structures reveal the DUOX1 complex is a symmetric 2:2 hetero-tetramer stabilized by extensive inter-subunit interactions. Substrate NADPH and cofactor FAD are sandwiched between transmembrane domain and the cytosolic dehydrogenase domain of DUOX. In the presence of calcium ions, intracellular EF-hand modules might enhance the catalytic activity of DUOX by stabilizing the dehydrogenase domain in a conformation that allows electron transfer.


Conflict of interest statement

The authors declare no competing interests.

Figures

Fig. 1
Fig. 1. Structure of human DUOX1–DUOXA1 complex in the high-calcium state.
a Schematic of the DUOX enzymatic assay. In the presence of H2O2 (produced by DUOX), horseradish peroxidase (HRP) converts nonfluorescent Amplex Red to fluorescent resorufin, which is measurable and proportional to H2O2. b Calcium-dependent activation of hDUOX1–hDUOXA1 complex. Data are shown as means ± standard deviations, n = 3 biologically independent samples. Source data are provided as a Source data file. c Steady state enzyme activity of hDUOX1–hDUOXA1 complex as the function of NADPH concentration in the presence or absence of calcium. Data were fit to the Michaelis–Menten equation to obtain the Km and Kcat value. Data are shown as means ± standard deviations, n = 3 biologically independent samples. Source data are provided as a Source data file. d Side view of the cryo-EM map of hDUOX1–hDUOXA1 complex in the high-calcium state. The approximate boundaries of phospholipid bilayer are indicated as gray thick lines. One protomer of hDUOX1 and hDUOXA1 complex is colored as blue and green, the other one is colored as yellow and red, respectively. e A 90° rotated top view compared to d. f A 180° rotated bottom view compared to e. g Top view of the cross-section of the transmembrane layer at the position indicated as a dashed line in d. The large cavity in the transmembrane layer is indicated by dashed oval. For clarity, the cryo-EM map was low-pass filtered to 6 Å. h Topology of hDUOX1 and hDUOXA1 subunits. Transmembrane helices are shown as cylinders, unmodeled disordered regions are shown as dashed lines. The phospholipid bilayer is shown as gray layers. PHD peroxidase homology domain of hDUOX1, PHLD pleckstrin homology-like domain of hDUOX1, EF EF-hand calcium-binding module of hDUOX1, DH dehydrogenase domain of hDUOX1, CLD claudin-like domain of hDUOXA1. i Structure of one protomer of hDUOX1 and hDUOXA1 complex in cartoon representation. The colors of each individual domain are the same as in g. The approximate boundaries of phospholipid bilayer are indicated as gray thick lines. Sugar moieties, hemes, FAD, and NADPH are shown as black, yellow, pink, and green sticks, respectively.
Fig. 2
Fig. 2. Structure of hDUOX1 subunit.
a Side view of hDUOX1 subunit in the high-calcium state, highlighting the key interfaces (boxed by dashed lines). Each domain is colored as in Fig. 1h. The surface of hDUOX1 is shown in transparency. b The binding site of outer heme in the TMD. Heme is shown as sticks and colored in yellow. Unrelated helices in TMD are omitted for clarity. The putative oxygen-reducing center is indicated by arrow. c The binding site of inner heme in the TMD. d The interface between PHD and TMD boxed in a. Disulfide bond between C118–C1165 is shown as golden sticks. e The interface between PHLD and TMD boxed in a, the hydrogen bonds are indicated with dashed lines. f The interface between PHLD and DH domain. g The interface between EF module and DH domain. h The FAD-binding site located at the interface between TMD and DH domain. Ligands and interacting residues are shown as sticks. i The NADPH-binding site located at the interface between TMD and DH domain.
Fig. 3
Fig. 3. Electron transfer pathway in hDUOX1 subunit in the high-calcium state.
a The edge-to-edge distances between NADPH and FAD, FAD and inner heme, and two hemes are shown beside dashes. The ligands are shown as sticks, each domain of hDUOX1 are shown in surface, and colored the same as Fig. 1h. Only one hDUOX subunit is shown for clarity. The putative oxygen-reducing center is boxed by dashed lines. be The DH domain of hDUOX1 in a relaxed conformation (b), DH domain of csNOX5 (c), and sFNR (d) in a tense conformation. The ligands are shown as sticks, two subdomains (FAD-binding domain, FBD, and NADPH-binding domain, NBD) of DH are shown as cartoon with surface. Distances between Cα atoms of the Arg (Lys in sFNR) of FBD and the Cys of NBD (shown as spheres) are labeled. e Structural comparison of the hDUOX1 DH domain (cyan) and csNOX5 (purple). FBD is used for structural alignment. fi The close-up view of the putative oxygen-reducing center. Four predicted tunnels for oxygen substrate entrance and product exit are shown as surface in yellow, green, magenta, and orange, respectively. Residues surrounding the tunnels are shown as sticks. j Calculated radii of tunnels shown in fi. The putative oxygen-reducing center is used as the starting point for calculation.
Fig. 4
Fig. 4. Mechanism of hDUOX1–hDUOXA1 tetramer assembly.
a The side view of hDUOX1–hDUOXA1 protein complex shown in surface representation and colored the same as in Fig. 1d. b The open-book view of the inter-subunit interfaces. Residues of hDUOX1 subunits that interact with hDUOXA1 subunit are colored in green. Residues of hDUOXA1 subunit that interact with hDUOX1 subunits are colored in yellow and blue. c The close-up view of the interactions between NTP of hDUOXA1 and hDUOX1 boxed in a. d The close-up view of additional interactions between NTP of hDUOXA1 and hDUOX1 boxed in c. e The top view of interactions between PHD of two opposing hDUOX1 subunits. f Representative FSEC traces of hDOUX1 R50E, R507E, and R507A mutants are compared to that of wild-type (WT) hDOUX1. The peak position of the hDOUX1 peak is denoted by the hollow circles. Asterisks denote the peak position of hDUOX1–hDUOXA1 protein complex.
Fig. 5
Fig. 5. Conformational change of hDUOX1 complex during calcium activation.
a Structural comparison of hDUOX–hDUOXA1 complex between the high-calcium state (colored) and the low-calcium states (gray). Protein is shown as cartoon. Regions with large conformational changes are boxed by dashed lines. b Close-up view of the conformational changes of EF-hand module. Cα atom of A894 on αJ helix is used as marker to measure the movement of EF2. c Close-up view of the conformational change of PHLD. The angle between αA helices in the high-calcium and low-calcium states was measured. d, e Conformational differences of EF-hand module between the high-calcium state and the low-calcium state. f Reconfiguration of the interface between EF-hand module and α4 helix of DH domain. Arrows denote movements from high-calcium state into the low-calcium state.
Fig. 6
Fig. 6. Activation mechanism of DUOX1 complex by calcium.
Two DUOX1 and one DUOXA1 subunit are shown as cartoon, and colored the same as Fig. 1d. Calcium ions are presented as green spheres. Electron transfer pathways are indicted with gray arrows.

References

    1. Sies H, Jones DP. Reactive oxygen species (ROS) as pleiotropic physiological signalling agents. Nat. Rev. Mol. Cell Biol. 2020;21:363–383. doi: 10.1038/s41580-020-0230-3. - DOI - PubMed
    1. Lambeth JD, Neish AS. Nox enzymes and new thinking on reactive oxygen: a double-edged sword revisited. Annu. Rev. Pathol. 2014;9:119–145. doi: 10.1146/annurev-pathol-012513-104651. - DOI - PubMed
    1. Winterbourn CC, Kettle AJ, Hampton MB. Reactive oxygen species and neutrophil function. Annu. Rev. Biochem. 2016;85:765–792. doi: 10.1146/annurev-biochem-060815-014442. - DOI - PubMed
    1. Ohye H, Sugawara M. Dual oxidase, hydrogen peroxide and thyroid diseases. Exp. Biol. Med. 2010;235:424–433. doi: 10.1258/ebm.2009.009241. - DOI - PubMed
    1. Grasberger H, Refetoff S. Identification of the maturation factor for dual oxidase. Evolution of an eukaryotic operon equivalent. J. Biol. Chem. 2006;281:18269–18272. doi: 10.1074/jbc.C600095200. - DOI - PubMed

Publication types