. 2021 Jan 8;12(1):184.
doi: 10.1038/s41467-020-20493-6.

Plasma ctDNA is a tumor tissue surrogate and enables clinical-genomic stratification of metastatic bladder cancer

Affiliations

Plasma ctDNA is a tumor tissue surrogate and enables clinical-genomic stratification of metastatic bladder cancer

Gillian Vandekerkhove et al. Nat Commun. .

Abstract

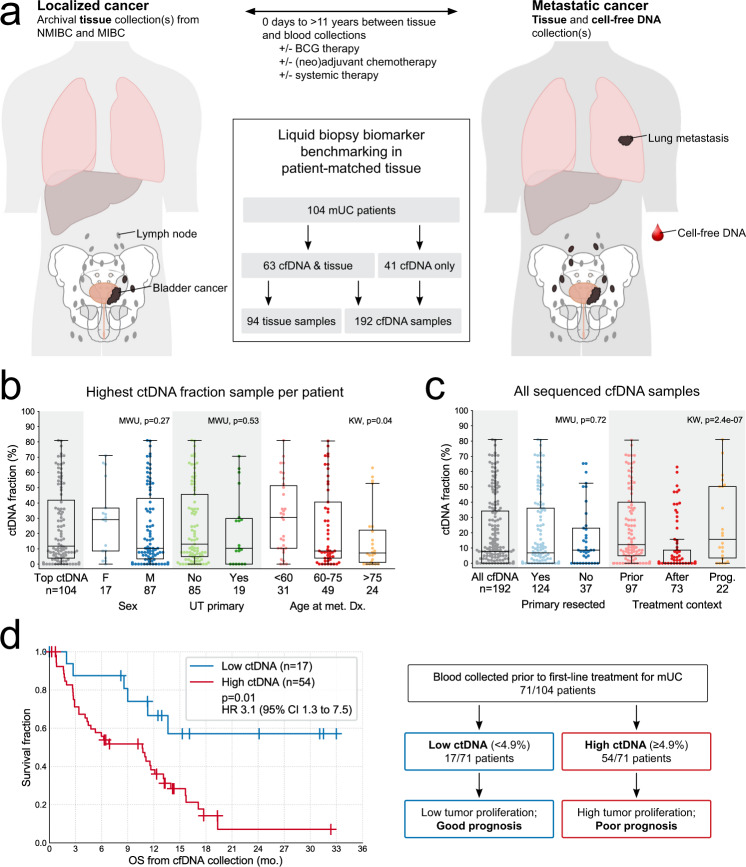
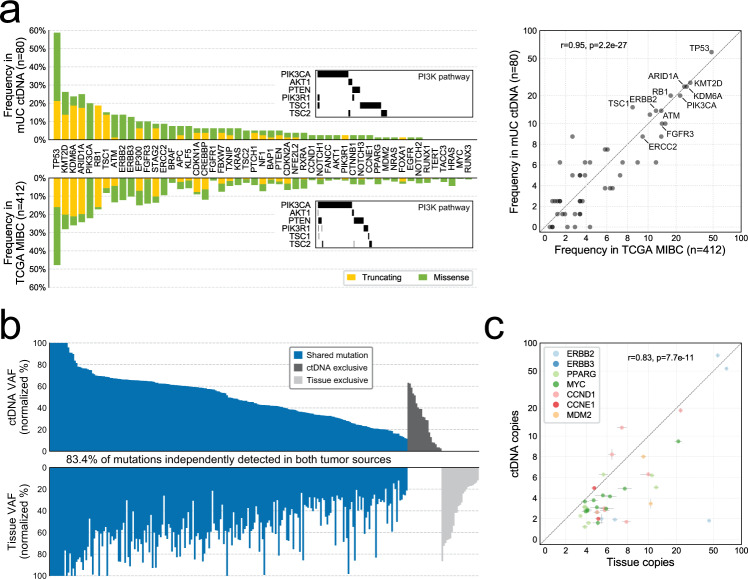
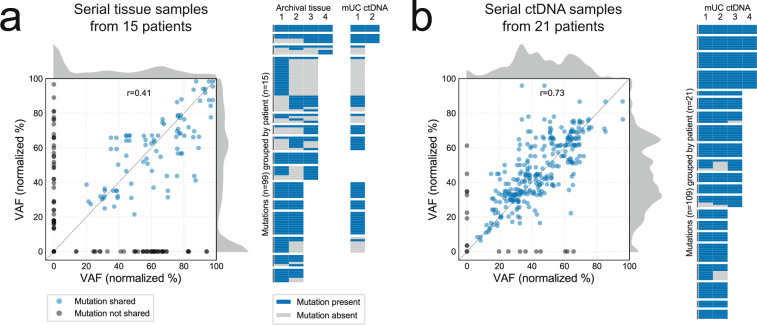
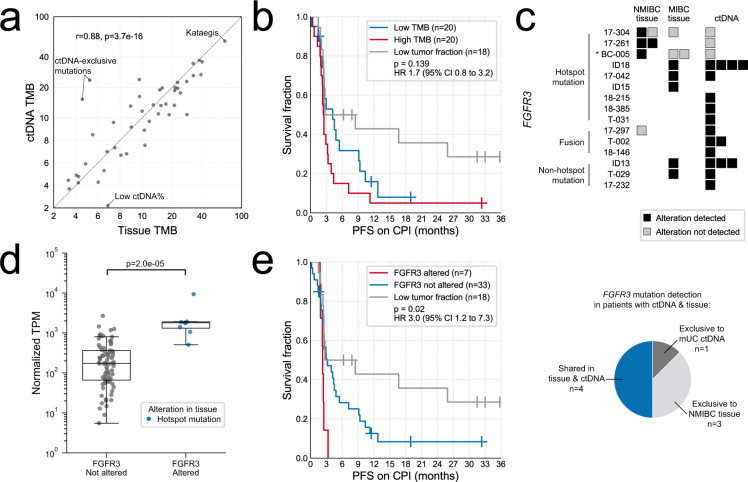
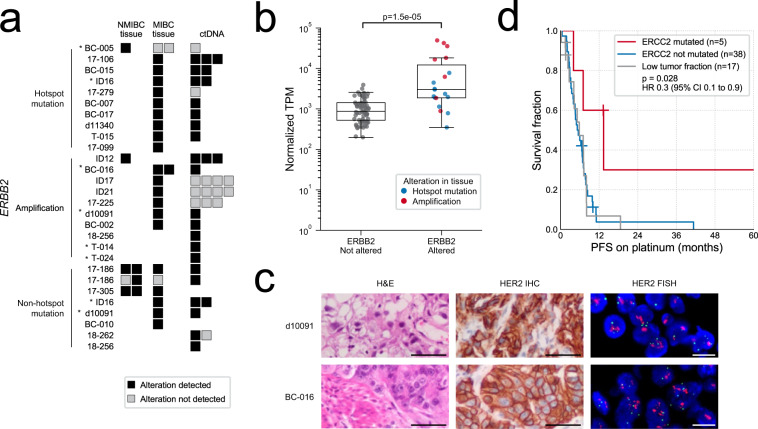
Molecular stratification can improve the management of advanced cancers, but requires relevant tumor samples. Metastatic urothelial carcinoma (mUC) is poised to benefit given a recent expansion of treatment options and its high genomic heterogeneity. We profile minimally-invasive plasma circulating tumor DNA (ctDNA) samples from 104 mUC patients, and compare to same-patient tumor tissue obtained during invasive surgery. Patient ctDNA abundance is independently prognostic for overall survival in patients initiating first-line systemic therapy. Importantly, ctDNA analysis reproduces the somatic driver genome as described from tissue-based cohorts. Furthermore, mutation concordance between ctDNA and matched tumor tissue is 83.4%, enabling benchmarking of proposed clinical biomarkers. While 90% of mutations are identified across serial ctDNA samples, concordance for serial tumor tissue is significantly lower. Overall, our exploratory analysis demonstrates that genomic profiling of ctDNA in mUC is reliable and practical, and mitigates against disease undersampling inherent to studying archival primary tumor foci. We urge the incorporation of cell-free DNA profiling into molecularly-guided clinical trials for mUC.


Conflict of interest statement

J.-M.L. reports honoraria from Pfizer, Astellas, and Ipsen. N.S. reports travel grants from Bayer, MSD, Bristol-Myers Squibb, and Astellas. T.T. reports speaker/consultant roles with Astellas, AstraZeneca, Bayer, BMS, Ipsen, Janssen, MSD, Roche, and Sanofi. E.A.G. is an employee of Decipher Biosciences, Inc. K.N.C. reports receiving commercial research grants and honorarium from Astellas, AstraZeneca, Constellation Pharmaceuticals, Daiichi Sankyo, Janssen, Merck, Novartis, Pfizer, Point Biopharma, Roche, and Sanofi. A.W.W. reports receiving a commercial research grant from Janssen, and honorarium from AstraZeneca, Astellas, Janssen, and Merck. The remaining authors declare no competing interests.

Figures

Fig. 1
Fig. 1. Cohort summary and abundance of circulating tumor DNA (ctDNA).
a Cell-free DNA (cfDNA) and tissue samples were collected from 104 metastatic urothelial carcinoma (mUC) patients. Anatomy diagram obtained from Cancer Research UK/Wikimedia Commons, available under a Creative Commons Attribution-Share Alike 4.0 International license: https://commons.wikimedia.org/wiki/File:Diagram_showing_advanced_bladder_cancer_CRUK_441.svg. b Abundance of ctDNA in relation to patient characteristics. Only the highest ctDNA fraction sample from each patient is shown. c Impact of treatment status (at the time of cfDNA collection) on ctDNA abundance. Prior cfDNA collected pre-treatment initiation, after cfDNA collected post-treatment initiation, and Prog. cfDNA collected near the time of documented disease progression (see “Methods” section). d Kaplan–Meier survival analysis in 71 mUC patients with cfDNA collected prior to first-line systemic therapy. The highest ctDNA fraction sample from each patient is represented if multiple pre-treatment samples were available. Stratification is based on the 25th percentile across the represented samples (4.9%). Statistical significance was measured using Cox proportional hazards regression analysis. All boxplots in (b) and (c) are centered at the median, with the box spanning the first to third quartile, and minima and maxima extending to 1.5× IQR. MWU two-sided Mann–Whitney U test, KW Kruskal–Wallis test, and UT upper tract. Source data for (b) and (c) are provided as a Source Data file.
Fig. 2
Fig. 2. Comparison of circulating tumor DNA (ctDNA) to tumor tissue.
a Gene mutation frequency and mutation type in metastatic urothelial carcinoma (mUC) ctDNA versus The Cancer Genome Atlas (TCGA) localized muscle-invasive bladder cancer (MIBC) cohort, across 50 driver genes on our targeted panel. TCGA information was obtained via cBioPortal. b Detection of protein-altering somatic mutations in ctDNA and patient-matched tumor tissue from 46 patients. Variant allele fractions (VAFs) for 265 mutations detected via targeted DNA-sequencing are normalized to tumor fraction estimates. c Correlation of gene copy number between ctDNA and tissue for seven commonly amplified oncogenes. Linear regression p value calculated for 38 amplification events across 27 patients (remaining 19/46 patients lacked amplifications in selected oncogenes). Data are presented as the exact gene copy number estimate (dot), +/− the 95% confidence interval (error bar) as calculated per gene from the coverage log ratio in samples with no evidence of cancer (tumor fraction = 0). Source data for (a) and (c) are provided as a Source Data file.
Fig. 3
Fig. 3. Temporal heterogeneity in tumor tissue and circulating tumor DNA (ctDNA).
a Mutation detection across same-patient serial tissue samples. Correlation of somatic mutation variant allele fractions (VAFs) in paired tissue samples, with mutations not detected in one member of the pair (VAF = 0) shown in gray (left). Kernel density estimates show a peak in mutations detected exclusively in one sample. Each unique mutation detected in serial tissue is plotted as a row in the heatmap (right), along with their re-detection in ctDNA-positive samples (if available). b Mutation detection across same-patient serial ctDNA samples. Somatic mutation VAFs are strongly correlated (left), with few mutations not consistently detected (right). In both (a) and (b), VAFs are normalized to tumor purity, and those >100 (e.g., on amplified genes) are not shown. Source data are provided as a Source Data file.
Fig. 4
Fig. 4. Tumor mutational burden (TMB) and FGFR3 status evaluation in circulating tumor DNA (ctDNA) and tumor tissue.
a TMB estimates from the highest ctDNA fraction sample and most recent tissue sample for 46 metastatic urothelial carcinoma (mUC) patients. P value calculated using linear regression. b Kaplan–Meier survival analyses for progression-free survival (PFS) in the subset of patients treated with immune checkpoint inhibitors (CPI), stratified by median TMB (12.4 mutations/Mb). Statistical significance was measured using Cox proportional hazards regression analysis; non-evaluable patients (those with insufficient ctDNA to detect protein-altering somatic mutations) were excluded from the survival regression. c Detection of alterations in FGFR3. Asterisks indicate TMB > 30 mutations/Mb. Samples with a tumor fraction of zero are not shown. NMIBC non-muscle-invasive bladder cancer, MIBC muscle-invasive bladder cancer. d FGFR3 expression levels in eight tissue samples with activating alterations, compared to 78 tissue samples without FGFR3-activating alterations detected via targeted DNA-sequencing. No FGFR3 rearrangements were detected in the tissue. P value calculated with two-sided Mann–Whitney U test. Boxplots are centered at the median, with the boxes spanning the first to third quartile, and minima and maxima extending to 1.5× IQR. TPM transcripts per million. e Kaplan–Meier survival analyses for PFS in the subset of patients treated with CPI, stratified by FGFR3 alteration status. Statistical significance was measured using Cox proportional hazards regression analysis; patients with low tumor fractions (insufficient to detect protein-altering somatic mutations) were excluded from the survival regression. Source data for (a) and (d) are provided as a Source Data file.
Fig. 5
Fig. 5. Evaluation of ERBB2 and ERCC2 status in circulating tumor DNA (ctDNA) and tumor tissue.
a Detection of alterations in ERBB2. Asterisks indicate TMB > 30 mutations/Mb. Samples with a tumor fraction of zero are not shown. NMIBC non-muscle-invasive bladder cancer, MIBC muscle-invasive bladder cancer. b ERBB2 expression levels in 19 tissue samples with activating alterations, compared to 67 tissue samples without ERBB2-activating alterations detected via targeted DNA-sequencing. P value calculated with two-sided Mann–Whitney U test. Boxplots are centered at the median, with the boxes spanning the first to third quartile, and minima and maxima extending to 1.5× IQR. TPM transcripts per million. c Tissue staining for ERBB2 (HER2) amplifications detected in ctDNA: hematoxylin and eosin (H&E), and positive immunohistochemistry (IHC) and fluorescence in situ hybridization (FISH). IHC and FISH were performed once per patient specimen using a clinically validated test. Scale bars correspond to 50 µm (H&E and IHC) and 10 µm (FISH). d Kaplan–Meier survival analysis for progression-free survival (PFS) in the subset of patients treated with platinum chemotherapy, stratified by ERCC2 mutation status. All but one mutation fell within a helicase domain. Statistical significance was measured using Cox proportional hazards regression analysis; patients with low tumor fractions (insufficient to detect protein-altering somatic mutations) were excluded from the survival regression. Source data for (b) are provided as a Source Data file.

Comment in

References

    1. Bray F, et al. Global cancer statistics 2018: GLOBOCAN estimates of incidence and mortality worldwide for 36 cancers in 185 countries. CA Cancer J. Clin. 2018;68:394–424. doi: 10.3322/caac.21492. - DOI - PubMed
    1. Kamat AM, et al. Bladder cancer. Lancet. 2016;388:2796–2810. doi: 10.1016/S0140-6736(16)30512-8. - DOI - PubMed
    1. Loriot Y, et al. Erdafitinib in locally advanced or metastatic urothelial carcinoma. N. Engl. J. Med. 2019;381:338–348. doi: 10.1056/NEJMoa1817323. - DOI - PubMed
    1. Alifrangis C, McGovern U, Freeman A, Powles T, Linch M. Molecular and histopathology directed therapy for advanced bladder cancer. Nat. Rev. Urol. 2019;16:465–483. doi: 10.1038/s41585-019-0208-0. - DOI - PubMed
    1. Rosenberg JE, et al. Pivotal trial of enfortumab vedotin in urothelial carcinoma after platinum and anti-programmed death 1/programmed death ligand 1 therapy. J. Clin. Oncol. 2019;37:2592–2600. doi: 10.1200/JCO.19.01140. - DOI - PMC - PubMed

Publication types

MeSH terms

Grants and funding