. 2021 Jan 8;12(1):187.
doi: 10.1038/s41467-020-20422-7.

Gut microbiota impact on the peripheral immune response in non-alcoholic fatty liver disease related hepatocellular carcinoma

Affiliations

Gut microbiota impact on the peripheral immune response in non-alcoholic fatty liver disease related hepatocellular carcinoma

Jason Behary et al. Nat Commun. .

Abstract

The gut microbiota is reported to modulate the immune response in hepatocellular carcinoma (HCC). Here, we employ metagenomic and metabolomic studies to characterise gut microbiota in patients with non-alcoholic fatty liver disease (NAFLD) related cirrhosis, with or without HCC, and evaluate its effect on the peripheral immune response in an ex vivo model. We find that dysbiosis characterises the microbiota of patients with NAFLD-cirrhosis, with compositional and functional shifts occurring with HCC development. Gene function of the microbiota in NAFLD-HCC supports short chain fatty acid production, and this is confirmed by metabolomic studies. Ex vivo studies show that bacterial extracts from the NAFLD-HCC microbiota, but not from the control groups, elicit a T cell immunosuppressive phenotype, characterised by expansion of regulatory T cells and attenuation of CD8 + T cells. Our study suggest that the gut microbiota in NAFLD-HCC is characterised by a distinctive microbiome/metabolomic profile, and can modulate the peripheral immune response.


Conflict of interest statement

The authors declare no competing interests.

Figures

Fig. 1
Fig. 1. Subjects with NAFLD-HCC have a peripheral immunosuppressive profile at baseline compared to NAFLD-cirrhosis and non-NAFLD controls.
Quantification of regulatory T cells (Tregs; CD3+ CD4+ CD25+ Foxp3+) and CD8+ T cells (CD3+ CD8+) in peripheral blood mononuclear cells (PBMCs) from non-NAFLD control, NAFLD-cirrhosis, and NAFLD-HCC subjects at baseline. Sample size is n = 30 non-NAFLD control, n = 28 NAFLD-cirrhosis, n = 32 NAFLD-HCC as biologically independent samples. Data represented as % of CD3+ lymphocytes. Box plots indicate median (middle line), 25th, 75th percentile (box) and 5th and 95th percentile (whiskers) as well as outliers (single points). P values are calculated by one-way ANOVA for 3 group comparison and Tukey’s test for 2 group comparison. Detailed data is shown in Supplementary Table 1. Source data are provided as a Source Data file.
Fig. 2
Fig. 2. Distinct faecal microbiota profiles of subjects with NAFLD-HCC, NAFLD-cirrhosis, and non-NAFLD controls.
a Alpha-diversity based on observed number of species in non-NAFLD control, NAFLD-cirrhosis and NAFLD-HCC faecal samples. Box plots indicate median (middle line), 25th, 75th percentile (box) and 5th and 95th percentile (whiskers) as well as outliers (single points). b Beta-diversity using constraint analysis of principle (CAP) (controlled for age and gender) demonstrating separation of non-NAFLD control, NAFLD-cirrhosis, and NAFLD-HCC microbial communities in faecal samples at species level using ‘capscale’ function in R package Vegan2 (P = 0.004, Permutation = 999). Ellipses are added with function ‘stat_ellipse’ with a confidence level of 0.95. c Microbiome composition at phylum level in non-NAFLD control, NAFLD-cirrhosis, and NAFLD-HCC faecal samples. d Microbiome composition at family level showing top 25 most abundant families in non-NAFLD control, NAFLD-cirrhosis, and NAFLD-HCC faecal samples. Data in c and d are presented as mean relative abundance, with differences between groups shown as #P < 0.05 for NAFLD-HCC compared to non-NAFLD control, P < 0.05 for NAFLD-HCC compared to NAFLD-cirrhosis and P < 0.05 for NAFLD-cirrhosis compared to non-NAFLD control with exact P values shown in Supplementary Table 2. e Microbiome composition at species level illustrating most enriched species in NAFLD-cirrhosis and NAFLD-HCC compared to non-NAFLD control faecal samples. Box plots indicate median (middle line), 25th, 75th percentile (box) and 5th and 95th percentile (whiskers) as well as outliers (single points). *P < 0.05, **P < 0.01, ****P < 0.0001 with exact P values shown in Supplementary Table 2. For panels ae sample size is n = 30 non-NAFLD control, n = 28 NAFLD-cirrhosis, n = 32 NAFLD-HCC as biologically independent samples. For panels a, c, d, and e P calculated are calculated by Kruskal–Wallis for 3 group comparison and Dunn’s test for 2 group comparison. Detailed data is shown in Supplementary Table 2. Source data are provided as a Source Data file.
Fig. 3
Fig. 3. NAFLD-HCC microbiome is characterised by increased abundance of genes that mediate short chain fatty acid (SCFA) synthesis from dietary fibre.
a Pathways of bacteria-mediated SCFA synthesis. Only genes where difference in abundance was observed between groups are shown. Solid arrow represents single step pathway, whilst dashed arrow represents multistep pathway. b Relative abundance of SCFA synthesis genes (reads per kilobase per million reads; RPKM) in the microbiome of NAFLD-HCC compared to NAFLD-cirrhosis and non-NAFLD control. Sample size is n = 30 non-NAFLD control, n = 28 NAFLD-cirrhosis, n = 32 NAFLD-HCC as biologically independent samples. Box plots indicate median (middle line), 25th, 75th percentile (box) and 5th and 95th percentile (whiskers) as well as outliers (single points). P calculated are calculated by Kruskal–Wallis for 3 group comparison and Dunn’s test for 2 group comparison. Detailed data is shown in Supplementary Table 3. Source data are provided as a Source Data file. pycA pyruvate carboxylase, pta phosphate acetyltransferase, ptb phosphate butyryltransferase, frd fumarate reductase, sucC succinate-CoA synthetase, KO KEGG Orthology.
Fig. 4
Fig. 4. Faeces and serum from subjects with NAFLD-HCC are characterised by increased levels of some short chain fatty acids (SCFA) and SCFA-intermediates compared to NAFLD-cirrhosis and non-NAFLD controls.
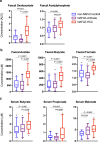
a Relative quantification of SCFAs intermediates in faecal samples from non-NAFLD control, NAFLD-cirrhosis, and NAFLD-HCC subjects. Data represented as area under the curve (AUC) relative to pooled sample. b Absolute concentration of SCFAs in faecal samples from non-NAFLD control, NAFLD-cirrhosis, and NAFLD-HCC subjects. c Absolute quantification of SCFAs in serum samples from non-NAFLD control, NAFLD-cirrhosis, and NAFLD-HCC subjects. For panels ac sample size is n = 30 non-NAFLD control, n = 28 NAFLD-cirrhosis, n = 32 NAFLD-HCC as biologically independent samples. Box plots indicate median (middle line), 25th, 75th percentile (box) and 5th and 95th percentile (whiskers) as well as outliers (single points). P values are calculated by one-way ANOVA for 3 group comparison and Tukey’s test for 2 group comparison. Detailed data is shown in Supplementary Table 4. Source data are provided as a Source Data file.
Fig. 5
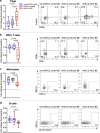
Fig. 5. Bacterial extract (BE) from subjects with NAFLD-HCC elicit an immunosuppressive phenotype in PBMCs from non-NAFLD subjects.
Fold change from baseline and representative flow cytometry plots of a Tregs (CD3+CD4+CD25+Foxp3+) in response to non-NAFLD control, NAFLD-cirrhosis, and NAFLD-HCC BE. b CD8+ T cells (CD3+CD8+) in response to non-NAFLD control, NAFLD-cirrhosis, and NAFLD-HCC BE. c Monocyte antigen-presenting cells (monocytes; CD3−CD14+) in response to non-NAFLD control, NAFLD-cirrhosis, and NAFLD-HCC BE and d B cells (CD19+CD20+) in response to non-NAFLD control, NAFLD-cirrhosis, and NAFLD-HCC BE. Data is represented as % of viable CD3+ lymphocytes for Tregs and CD8+ T cells, and % of viable singlets for monocytes and B cells, normalised to baseline measurements; baseline immune response is represented as dashed line. For panels ad sample size is n = 10 non-NAFLD control, n = 10 NAFLD-cirrhosis, n = 10 NAFLD-HCC as biologically independent samples. Box plots indicate median (middle line), 25th, 75th percentile (box) and 5th and 95th percentile (whiskers) as well as outliers (single points). P values are calculated by one-way ANOVA for 3 group comparison and Tukey’s test for 2 group comparison. Source data are provided as a Source Data file.
Fig. 6
Fig. 6. Bacterial extract (BE) from subjects with NAFLD-HCC alter pro-/anti-inflammatory cytokine milieu.
Quantification of cytokines in PBMC culture media following addition of non-NAFLD control, NAFLD-cirrhosis, and NAFLD-HCC bacterial extract (BE). Sample size is n = 10 non-NAFLD control, n = 10 NAFLD-cirrhosis, n = 10 NAFLD-HCC as biologically independent samples. Box plots indicate median (middle line), 25th, 75th percentile (box) and 5th and 95th percentile (whiskers) as well as outliers (single points). P values are calculated by one-way ANOVA for 3 group comparison and Tukey’s test for 2 group comparison. Detailed data is shown in Supplementary Table 5. Source data are provided as a Source Data file.
Fig. 7
Fig. 7. Enriched species in the microbiome of subjects with NAFLD-HCC and the metabolite butyrate, correlate with the elicited immune response ex vivo.
Heatmap of Spearman’s rank correlation of (a) enriched species in microbiome of subjects with NAFLD-HCC and T cell immune responses measured ex vivo (b) enriched metabolites in faeces of subjects with NAFLD-HCC and T cell immune responses measured ex vivo. Colour legend represents correlation coefficient (R). “+” denotes significant correlation (P < 0.05) are shown after Benjamini–Hochberg correction. All data is shown in Supplementary Fig. 6. Source data are provided as a Source Data file.
Fig. 8
Fig. 8. The microbiome and metabolome of subjects with NAFLD-HCC elicit an immunosuppressive phenotype ex vivo.
Schema summarising key findings. Dysbiosis in NAFLD-HCC is characterised by increased abundance of distinct bacterial species, increased functional capacity for the production of SCFAs and increased faecal SCFA concentrations. ‘Leaky gut’ is well described in cirrhosis with and without HCC. The microbiome and metabolome of subjects with NAFLD-HCC elicits an immunosuppressive phenotype ex vivo (characterised by increased Tregs, reduced CD8+ T cells, and reduced APCs) that has been associated with poor clinical outcomes and immunotherapy resistance in patients with HCC. Created with Biorender.com.

References

    1. Akinyemiju T, et al. The burden of primary liver cancer and underlying etiologies from 1990 to 2015 at the global, regional, and national level: results from the global burden of disease study 2015. JAMA Oncol. 2017;3:1683–1691. doi: 10.1001/jamaoncol.2017.3055. - DOI - PMC - PubMed
    1. George J, Anstee Q, Ratziu V, Sanyal A. NAFLD: The evolving landscape. J. Hepatol. 2018;68:227–229. doi: 10.1016/j.jhep.2017.11.016. - DOI - PubMed
    1. Younossi ZM, et al. Association of nonalcoholic fatty liver disease (NAFLD) with hepatocellular carcinoma (HCC) in the United States from 2004 to 2009. Hepatology. 2015;62:1723–1730. doi: 10.1002/hep.28123. - DOI - PubMed
    1. Caussy C, et al. A gut microbiome signature for cirrhosis due to nonalcoholic fatty liver disease. Nat. Commun. 2019;10:1406. doi: 10.1038/s41467-019-09455-9. - DOI - PMC - PubMed
    1. Loomba R, et al. Gut microbiome-based metagenomic signature for non-invasive detection of advanced fibrosis in human nonalcoholic fatty liver disease. Cell Metab. 2017;25:1054–1062.e1055. doi: 10.1016/j.cmet.2017.04.001. - DOI - PMC - PubMed

MeSH terms