. 2021 Jan 8;12(1):162.
doi: 10.1038/s41467-020-20414-7.

Visualising G-quadruplex DNA dynamics in live cells by fluorescence lifetime imaging microscopy

Affiliations

Visualising G-quadruplex DNA dynamics in live cells by fluorescence lifetime imaging microscopy

Peter A Summers et al. Nat Commun. .

Abstract

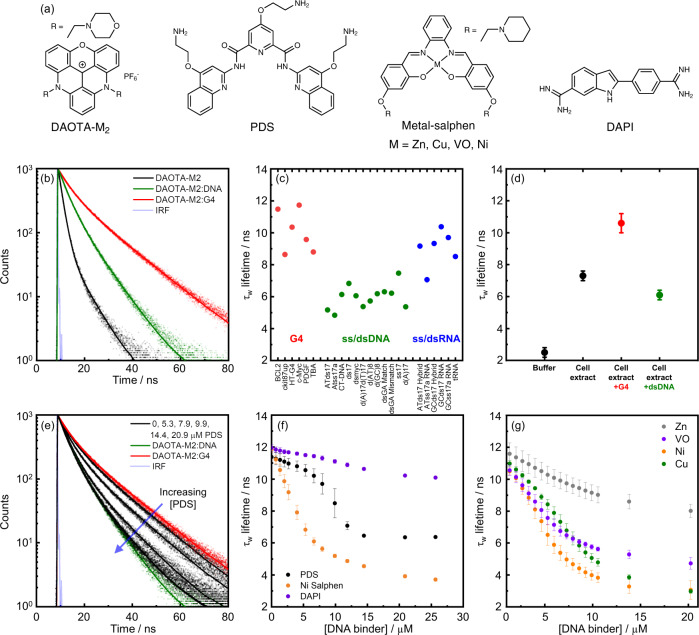
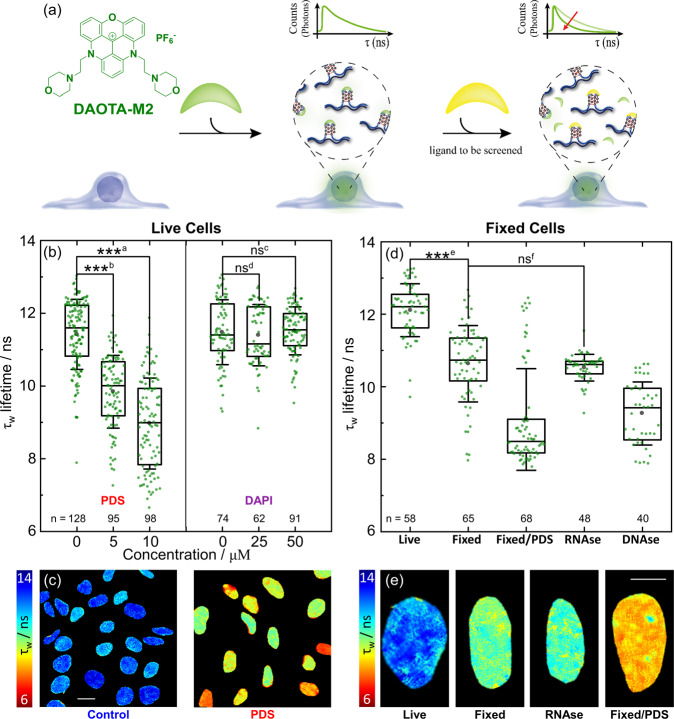
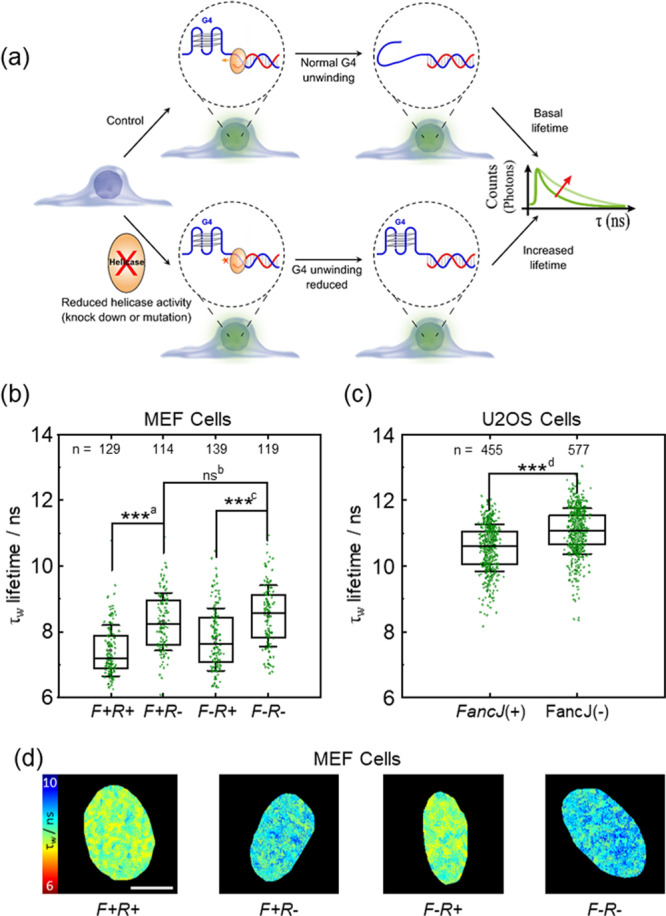
Guanine rich regions of oligonucleotides fold into quadruple-stranded structures called G-quadruplexes (G4s). Increasing evidence suggests that these G4 structures form in vivo and play a crucial role in cellular processes. However, their direct observation in live cells remains a challenge. Here we demonstrate that a fluorescent probe (DAOTA-M2) in conjunction with fluorescence lifetime imaging microscopy (FLIM) can identify G4s within nuclei of live and fixed cells. We present a FLIM-based cellular assay to study the interaction of non-fluorescent small molecules with G4s and apply it to a wide range of drug candidates. We also demonstrate that DAOTA-M2 can be used to study G4 stability in live cells. Reduction of FancJ and RTEL1 expression in mammalian cells increases the DAOTA-M2 lifetime and therefore suggests an increased number of G4s in these cells, implying that FancJ and RTEL1 play a role in resolving G4 structures in cellulo.


Conflict of interest statement

The authors declare no competing interests.

Figures

Fig. 1
Fig. 1. In vitro fluorescence-lifetime of DAOTA-M2 bound to different DNA topologies.
a Chemical structures of the DNA binders under study in this work. b Time-resolved fluorescence decays of DAOTA-M2 (2 µM, black trace) and following the subsequent additions of dsDNA (CT-DNA, 20 µM, green trace) and then G4 (c-Myc, 4 µM, red trace). Instrument response function (IRF) is shown in grey. Recorded data is shown as dots and fitted biexponential function as a solid line. c Variation of the average lifetime (τw) of DAOTA-M2 in the presence of different G4s (red dots), ss/dsDNA (green dots) and ss/dsRNA (blue dots), adapted from reference. d Fluorescence-lifetimes of DAOTA-M2 (2 µM) in aqueous buffer (black dot), buffered Xenopus egg extract (33 µL egg extract + 12 µL aqueous buffer, black dot), and in buffered cell extract supplemented with G4 (4 µM c-Myc, red dot) and dsDNA (44 µM ds26, green dot). Both measurements remained constant over 0.5 hr incubation at 21 °C. Mean value from 3 independent measurements, error bars represent standard deviation. e In a mixture of DAOTA-M2 (2 µM), dsDNA (CT-DNA, 20 µM), and G4 (c-Myc, 4 µM), increasing amounts of PDS (5.3. 7.9. 9.9, and 14.4 µM, black traces) displaces DAOTA-M2 from a G4 to dsDNA environment. Recorded data is shown as dots and fitted biexponential function as a solid line. f Variation of τw in a mixture of DAOTA-M2 (2 µM), dsDNA (CT-DNA, 20 µM), and G4 (c-Myc, 4 µM), with increasing concentrations of G4 binders PDS (black dots) and Ni-salphen (orange dots), and a non-G4 binder DAPI (purple dots). See Figure S2 for example decays. Mean value from 3 independent measurements, error bars represent standard deviation. g Variation of τw in a mixture of DAOTA-M2 (2 µM) and G4 (c-Myc, 4 µM), with increasing concentrations of Zn (grey dots), VO (purple dots), Ni (orange dots), and Cu (green dots)-salphens. Mean value from 3 independent measurements, error bars represent standard deviation. Unless stated otherwise, all experiments in 10 mM lithium cacodylate buffer (pH 7.3) with 100 mM KCl. Source Data are available as a Source Data file for Fig. 1b–g.
Fig. 2
Fig. 2. FLIM analysis of nuclear DNA in live U2OS cells stained with DAOTA-M2 (20 µM, 24 h).
a Fluorescence intensity image recorded at 512 × 512 resolution (λex = 477 nm, λem = 550–700 nm), red lines represent the nuclear segmentation used for the FLIM analysis. b FLIM map from a, displayed between average lifetime (τw) 9 (red) and 13 (blue) ns. c 2D correlation of the average nuclear intensity against the average nuclear lifetimes (blue dots). d Zoomed-in FLIM map of a single nucleus – colours represent lifetimes as defined by the colour gradient bar between 9 (red) and 13 (blue) ns. e Histogram of fluorescence lifetime distribution from image shown in b with the same colour coding. f Fluorescence decay trace (open black dots), fit (red line), and normalised residual (solid black dots) of a representative pixel (including binning) from image shown in b; IRF = Instrumental Response Function plotted as a blue line. Data shown is representative of 13 cells imaged similarly. Scale bars: 20 µm. Source Data are available as a Source Data file for Fig. 2e, f.
Fig. 3
Fig. 3. FLIM analysis of live and fixed U2OS cells using DAOTA-M2.
a Schematic representation of the fluorescence lifetime displacement assay. Upon binding of competitors, DAOTA-M2 is displaced from G4 to a dsDNA environment, causing a reduction in its fluorescence lifetime. b Box plot of mean nuclear lifetimes (τw) and conditions of co-incubation of DAOTA-M2 (20 µM, 24-30 h) with PDS (24 h) and DAPI (1 h) in live cells. Results from n cells as stated next to each box, over two independent experiments. c Representative FLIM maps from DAOTA-M2 displayed between 6 (red) and 14 (blue) ns following co-incubation with no additive (Control), and PDS (10 µM, 24 h) recorded at 256 × 256 resolution to speed-up data acquisition without affecting the average lifetime of each nucleus. See Figure S7 for lifetime histograms. Scale bar: 20 µm. d Box plot of mean nuclear lifetimes (τw) after fixation with PFA (4% in PBS) and treatment with PDS (10 µM, 1 hr), RNAse (1 mg ml−1, 10 min, 21 °C) and DNAse. (200 Units well−1, 1 h, 37 °C). Results from n cells as stated next to each box, over two independent experiments. e Representative FLIM maps displayed between 6 (red) and 14 (blue) ns of cells from image shown in (d) recorded at 512 × 512 resolution. Scale bar: 10 µm. Significance: ns p > 0.05, *p < 0.05, **p < 0.01, ***p < 0.001. ap = 1.8 × 10−36, t = 16.1, DF = 177: bp = 8.7 × 10−25, t = 11.8, DF = 198: cp = 7.6 × 10⁻¹, t = −0.31, DF = 131: dp = 5.9 × 10⁻¹, t = 0.54, DF = 132: ep = 3.2 × 10−15, t = 9.1, DF = 114: fp = 4.4 × 10−1, t = 0.77, DF = 74. Source Data are available as a Source Data file for Fig. 3b, d.
Fig. 4
Fig. 4. FLIM analysis of FancJ and RTEL1 expression in mutant MEF and U2OS cells using DAOTA-M2.
F + R + = FancJ(+)/RTEL1(+), F + R− = FancJ(+)/RTEL1(−), F−R + = FancJ(−)/RTEL1(+), and F−R− = FancJ(−)/RTEL1(−). a Schematic showing how reduced FancJ or RTEL1 helicase expression results in longer DAOTA-M2 lifetimes (τw). b Box plot of mean nuclear lifetimes (τw) for F + R+, F + R−, F−R+ and F−R− MEF cells. Cells were incubated with a null adenovirus (R+), or incubated with CRE adenovirus (R−) to delete RTEL1. Results from n cells as stated next to each box, over two independent experiments. c Box plot of mean nuclear lifetimes (τw) for U2OS cells transfected with siLucif [FancJ(+)], or FancJ siRNA [FancJ(−)] to knock-down FancJ. Results from n cells as stated next to each box, over two independent experiments. d FLIM maps of cells from b displayed between 6 (red) and 10 (blue) ns and recorded at 512 × 512 resolution, representative of the cells from two independent experiments shown in b. Scale bars: 10 µm. Significance: ns p > 0.05, *p < 0.05, **p < 0.01, ***p < 0.001. ap = 1.1 × 10−14, t = −8.3, DF = 228. bp = 1.4 × 10−1, t = −1.5, DF = 231. cp = 4.5 × 10−9, t = −6.1, DF = 252. dp = 2.7 × 10−26, t = −11.6, DF = 959. Source Data are available as a Source Data file for Fig. 4b, c.
Fig. 5
Fig. 5. FLIDA with the addition of different G4 binding compounds.
a Mean nuclear DAOTA-M2 lifetime (τw) of U2OS cells during incubation with G4 binders, error bars are ± standard error of mean. Sample size is n cells over two independent experiments. For the time zero data point, n = 623. For control (blue), n = 196, 219, 208. For Zn Salphen (grey), n = 60, 61, 59. For VO Salphen (purple), n = 71, 67, 63. For Cu Salphen (green), n = 71, 81, 61. For Ni Salphen (orange), n = 63, 63, 78. For PDS (black), n = 61, 20, 56. In all conditions values for n are stated from earliest time point to latest. b Representative FLIM maps (displayed between 6 (red) and 14 (blue) ns) of the DAOTA-M2 emission (recorded at 256 × 256 resolution to speed-up data acquisition without affecting the average lifetime of each nucleus), following co-incubation with DMSO (Control), Zn-salphen, Ni-salphen, and PDS. Images are representative of cells in the experiments shown in a. See Supplementary Fig. 12 for representative image during VO-salphen, Cu-salphen and PDS incubation. Scale bar: 20 µm. Source Data are available as a Source Data file for Fig. 5a.

Similar articles

Cited by

References

    1. Bochman ML, Paeschke K, Zakian VA. DNA secondary structures: stability and function of G-quadruplex structures. Nat. Rev. Genet. 2012;13:770–780. doi: 10.1038/nrg3296. - DOI - PMC - PubMed
    1. Murat P, Balasubramanian S. Existence and consequences of G-quadruplex structures in DNA. Curr. Opin. Genet. Dev. 2014;25:22–29. doi: 10.1016/j.gde.2013.10.012. - DOI - PubMed
    1. Rhodes D, Lipps HJ. G-quadruplexes and their regulatory roles in biology. Nucleic Acids Res. 2015;43:8627–8637. doi: 10.1093/nar/gkv862. - DOI - PMC - PubMed
    1. Neidle S. Quadruplex nucleic acids as targets for anticancer therapeutics. Nat. Rev. Chem. 2017;1:10. doi: 10.1038/s41570-017-0041. - DOI
    1. Huppert JL, Balasubramanian S. Prevalence of quadruplexes in the human genome. Nucleic Acids Res. 2005;33:2908–2916. doi: 10.1093/nar/gki609. - DOI - PMC - PubMed

Publication types

MeSH terms