Review
. 2021 Jan 8;6(1):2.
doi: 10.1038/s41539-020-00079-z.

Nurture might be nature: cautionary tales and proposed solutions

Affiliations
Review

Nurture might be nature: cautionary tales and proposed solutions

Sara A Hart et al. NPJ Sci Learn. .

Abstract

Across a wide range of studies, researchers often conclude that the home environment and children's outcomes are causally linked. In contrast, behavioral genetic studies show that parents influence their children by providing them with both environment and genes, meaning the environment that parents provide should not be considered in the absence of genetic influences, because that can lead to erroneous conclusions on causation. This article seeks to provide behavioral scientists with a synopsis of numerous methods to estimate the direct effect of the environment, controlling for the potential of genetic confounding. Ideally, using genetically sensitive designs can fully disentangle this genetic confound, but these require specialized samples. In the near future, researchers will likely have access to measured DNA variants (summarized in a polygenic scores), which could serve as a partial genetic control, but that is currently not an option that is ideal or widely available. We also propose a work around for when genetically sensitive data are not readily available: the Familial Control Method. In this method, one measures the same trait in the parents as the child, and the parents' trait is then used as a covariate (e.g., a genetic proxy). When these options are all not possible, we plead with our colleagues to clearly mention genetic confound as a limitation, and to be cautious with any environmental causal statements which could lead to unnecessary parent blaming.


Conflict of interest statement

The authors declare no competing interests.

Figures

Fig. 1
Fig. 1. An example of a direct environmental transmission effect.
Number of books in the home is thought to be an environmental causal effect on children’s reading ability. Figure by ref. available at https://bit.ly/3gl8MVk under a CC BY 4.0 license.
Fig. 2
Fig. 2. An example of how genetic confounding works (note, only one parent drawn, for simplicity).
Parents share genes related to reading ability with their children, and also control the number of books in their home. This creates gene–environment interplay. It is important to note that the environmental effect may still have a causal role, even with gene–environment interplay. If genes play a role but are not modeled (as in Fig. 1), the correlation between the environmental measure and the child’s trait is genetically confounded. Here, the role of genes is modeled, allowing for an estimation of the genetic effect and the environmental effect. Figure by ref. available at https://bit.ly/31c52z9 under a CC BY 4.0 license.
Fig. 3
Fig. 3. The logic behind twin research.
The scatter plots depict how much the two types of (reared-together) twins resemble their co-twin on reading ability. Each dot represents the reading scores of both children within a pair. It can be seen that monozygotic twins are much more alike. From this, it can be concluded that differences between children are largely due to genetic differences. The data come from van Bergen et al. and represent word-reading fluency test scores in Grade 2 of twin pairs with complete data. The score is the number of words read correctly within 1 min. In this sample, the monozygotic and dizygotic twin correlations were 0.84 and 0.46, respectively, which yield estimates using the Falconer formulas of A = 0.76, C = 0.08, and E = 0.16 (see Fig. 4). Figure by ref. available at https://bit.ly/3k4w2Ji under a CC BY 4.0 license.
Fig. 4
Fig. 4. Simplified representation of the classical twin model.
In behavioral-genetic models, the three sources of influences on individual differences are commonly labeled by the letters A, C, and E, respectively, stemming from Additive genetic influences (also known as heritability, and sometimes represented by an h2 instead on an A), Common environmental influences (also known as shared environmental influences), and non-shared Environmental influences (and measurement Error). Note that the latter are by definition uncorrelated between twins. See for a detailed representation of the classical twin model, for example, Figure A.9 in ref. ; rMZ = monozygotic twin correlation; rDZ = dizygotic twin correlation. Figure by ref. available at https://bit.ly/2Xkr29P under a CC BY 4.0 license.
Fig. 5
Fig. 5. Simplified representation of the children-of-twins model.
In the given example, the (adult) twins are sisters. The genetic transmission (left hand side) is fixed at 0.50 because parents and children share 50% of their genome. The other set of genes that influence the child trait (bottom left) are genetic influences that explain variance in the child trait but not the parent trait. The crucial test for presence of environmental transmission is whether the p-path is significant. Note that ‘child’ can refer to child or adult offspring. See, for the full and detailed model, ref. . Figure by ref. available at https://bit.ly/2D0aNYJ under a CC BY 4.0 license.
Fig. 6
Fig. 6. A polygenic score (PGS) indexes an individual’s genetic predisposition for a cerain trait or disease (see also).
Left panel: A published genome-wide association study (GWAS) serves as an external database. In an extremely large sample, a GWAS estimates tiny associations (b^) between the trait of interest and millions of genetic variants. Specifically, the genetic variants studied are single-nucleotide polymorphisms (SNPs), located across the genome. Middle panel: Polygenic scoring can be done in a sample that was not part of the GWAS. For each individual in this sample, the SNP effects (b^) are multiplied by the number of trait-associated alleles (0, 1, or 2) the person carries. These values are summed across all SNPs to arrive at the individual’s PGS. Right panel: The resulting PGSs across individuals in that sample are normally distributed. If the trait of interest is a disorder, like ADHD, the individuals in the right tail have the highest genetic risk for developing ADHD. PGSs are not yet strong enough for predictions at the individual level, but see the main text for examples of how PGSs advance science at the group level. Figure adapted from ref. . Figure by ref. available at https://bit.ly/2BPcCXP under a CC BY 4.0 license.
Fig. 7
Fig. 7. Simplified representation of the genetic nurturing design.
In this design, one needs genotypes of parents and offspring, and a measured trait in the offspring generation only. The trait in the parents, for example educational attainment, is unobserved and indexed by a polygenic score of, in this example, educational attainment. The child receives half of the genotypes of father (top left) and mother (top right) and these transmitted alleles influence the child trait directly. The parental alleles that the child does not receive can still influence the child trait indirectly, via genetically influenced behaviors in the parents (denoted by the dotted genetic-nurturing paths). Genetic nurturing is present if the polygenic score of the untransmitted alleles explains a significant proportion of the variance in the child trait. The proportion of variance explained by the polygenic score of the transmitted alleles include both genetic nurturing and direct effects. Note that ‘child’ can refer to child or adult offspring. T = transmitted, NT = non-transmitted. Figure adapted from ref. . Figure by ref. available at https://bit.ly/2PjpkRu under a CC BY 4.0 license.
Fig. 8
Fig. 8. Visualization of the Familial Control Method, in which a child outcome is predicted in a step-wise regression, with in the first step the familial control measure (i.e., the trait in both parents) and in the second step the measure of the environment.
The findings that are depicted here come from van Bergen et al.. The key question is whether the environmental measure explains variance beyond the familial effect, as this indicates a genuine environmental effect. In the example given, this was 5% and significant. This was negligible and non-significant for the other environmental measures reported in ref. . Figure by ref. available at https://bit.ly/2Pfjelh under a CC BY 4.0 license.
Fig. 9
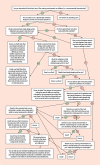
Fig. 9. Decision flowchart for determining how to control for genetic confounding when examining the rearing environment.
DK = don’t know. Figure by ref. available at https://bit.ly/3gkM6Et under a CC BY 4.0 license.

Similar articles

Cited by

References

    1. Sikora J, Evans M, Kelley J. Scholarly culture: how books in adolescence enhance adult literacy, numeracy and technology skills in 31 societies. Soc. Sci. Res. 2019;77:1–15. doi: 10.1016/j.ssresearch.2018.10.003. - DOI - PubMed
    1. Polderman TJ, et al. Meta-analysis of the heritability of human traits based on fifty years of twin studies. Nat. Genet. 2015;47:702. doi: 10.1038/ng.3285. - DOI - PubMed
    1. Turkheimer E. Three laws of behavior genetics and what they mean. Curr. Dir. Psychol. Sci. 2000;9:160–164. doi: 10.1111/1467-8721.00084. - DOI
    1. Kendler KS, Baker JH. Genetic influences on measures of the environment: a systematic review. Psychol. Med. 2007;37:615. doi: 10.1017/S0033291706009524. - DOI - PubMed
    1. Klahr AM, Burt SA. Elucidating the etiology of individual differences in parenting: a meta-analysis of behavioral genetic research. Psychol. Bull. 2014;140:544. doi: 10.1037/a0034205. - DOI - PubMed

LinkOut - more resources