. 2021 Jan 8;12(1):169.
doi: 10.1038/s41467-020-20470-z.

Around one third of current Arctic Ocean primary production sustained by rivers and coastal erosion

Affiliations

Around one third of current Arctic Ocean primary production sustained by rivers and coastal erosion

Jens Terhaar et al. Nat Commun. .

Abstract

Net primary production (NPP) is the foundation of the oceans' ecosystems and the fisheries they support. In the Arctic Ocean, NPP is controlled by a complex interplay of light and nutrients supplied by upwelling as well as lateral inflows from adjacent oceans and land. But so far, the role of the input from land by rivers and coastal erosion has not been given much attention. Here, by upscaling observations from the six largest rivers and using measured coastal erosion rates, we construct a pan-Arctic, spatio-temporally resolved estimate of the land input of carbon and nutrients to the Arctic Ocean. Using an ocean-biogeochemical model, we estimate that this input fuels 28-51% of the current annual Arctic Ocean NPP. This strong enhancement of NPP is a consequence of efficient recycling of the land-derived nutrients on the vast Arctic shelves. Our results thus suggest that nutrient input from the land is a key process that will affect the future evolution of Arctic Ocean NPP.


Conflict of interest statement

The authors declare no competing interests.

Figures
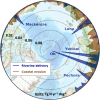
Fig. 1
Fig. 1. Map of annual input of terrigenous nitrogen via rivers and coastal erosion.
Input fluxes are aggregated per degree longitude.
Fig. 2
Fig. 2. Climatology of terrigenous nitrogen input, ocean net primary production and remineralisation in the Arctic Ocean over 2005–2010.
Climatologies of a basin-wide terrigenous nitrogen input from rivers (blue) and coastal erosion (brown) and of b total basin-wide integrated net primary production (NPP) (green) and pelagic and benthic remineralisation of organic matter (red). Total NPP and remineralisation are indicated as dashed lines (Baseline simulation) while NPP and remineralisation only driven by terrigenous inputs are shown as solid lines (computed as the difference between the Baseline and NoTerr simulations). The envelopes represent a uncertainties for the terrigenous nitrogen input (see methods) as well as b the simulated interannual standard deviation of NPP and remineralisation over 2005–2010.
Fig. 3
Fig. 3. Mean annual Arctic Ocean net primary production.
a simulated Arctic Ocean net primary production (NPP) with observation-based nutrient input from rivers and coastal erosion (Baseline), b simulated Arctic Ocean NPP without input of terrigenous nitrogen (NoTerr) c, remote-sensing-based NPP derived from satellite observations of chlorophyll-a and d difference between simulated Arctic Ocean NPP in a Baseline and b NoTerr simulations.
Fig. 4
Fig. 4. Net primary production dependence of terrigenous nitrogen input.
a simulated Arctic Ocean net primary production (NPP) and b part of NPP driven by terrigenous nitrogen input from rivers and coastal erosion. Simulated NPP in the Baseline, NoCoast, and NoTerr simulations are shown as black dots. The coloured shading is scaled proportional to the terrigenous nitrogen input. The grey shading indicates the possible range of terrigenous nutrient input available for NPP taking into account the remineralisation rate of terrigenous organic matter and the inclusion of missing sources of terrigenous nitrogen. Remote-sensing-based NPP derived from satellite observations of chlorophyll-a (black dashed line) with uncertainties (dotted black line) are shown in a (excluding Nordic Seas and CAA that are mainly out of the area that we defined as the Arctic Ocean).

References

    1. Bluhm BA, Gradinger R. Regional variability in food availability for Arctic marine mammals. Ecol. Appl. 2008;18:77–96. doi: 10.1890/06-0562.1. - DOI - PubMed
    1. Kattner G, Budéus G. Nutrient status of the northeast water polynya. J. Mar. syst. 1997;10:185–197. doi: 10.1016/S0924-7963(96)00070-X. - DOI
    1. Simpson, K. G., Tremblay, J ‐ É., Gratton, Y. & Price, N. M. An annual study of inorganic and organic nitrogen and phosphorus and silicic acid in the southeastern Beaufort Sea, J. Geophys. Res. 113, C07016 (2008).
    1. Tremblay JE, et al. Global and regional drivers of nutrient supply, primary production and CO2 drawdown in the changing Arctic Ocean. Prog. Oceanogr. 2015;139:171–196. doi: 10.1016/j.pocean.2015.08.009. - DOI
    1. Meredith, M. & Sommerkorn, M. IPCC Special Report on the Ocean and Cryosphere in a Changing Climate (SROCC), Chapter 3 (IPCC, Geneva, Switzerland, 2019).

Publication types