

Reconstructing hotspots of genetic diversity from glacial refugia and subsequent dispersal in Italian common toads (Bufo bufo)
- PMID: 33420098
- PMCID: PMC7794404
- DOI: 10.1038/s41598-020-79046-y
Reconstructing hotspots of genetic diversity from glacial refugia and subsequent dispersal in Italian common toads (Bufo bufo)
Erratum in
-
Publisher Correction: Reconstructing hotspots of genetic diversity from glacial refugia and subsequent dispersal in Italian common toads (Bufo bufo).Sci Rep. 2021 Jul 20;11(1):15165. doi: 10.1038/s41598-021-94521-w. Sci Rep. 2021. PMID: 34285317 Free PMC article. No abstract available.
Abstract
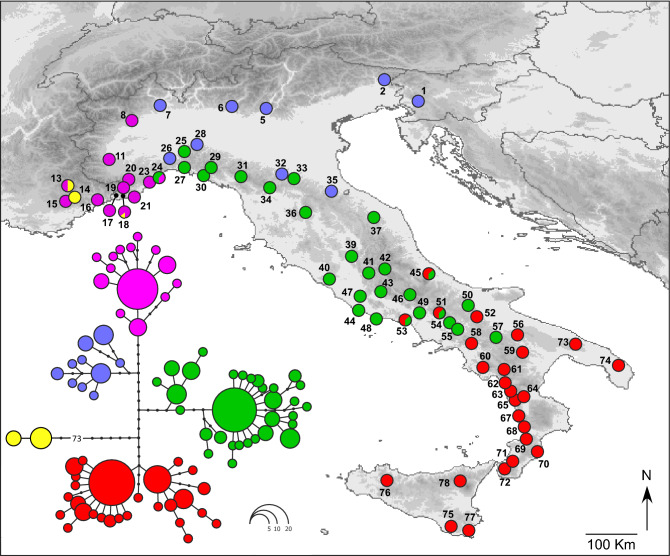
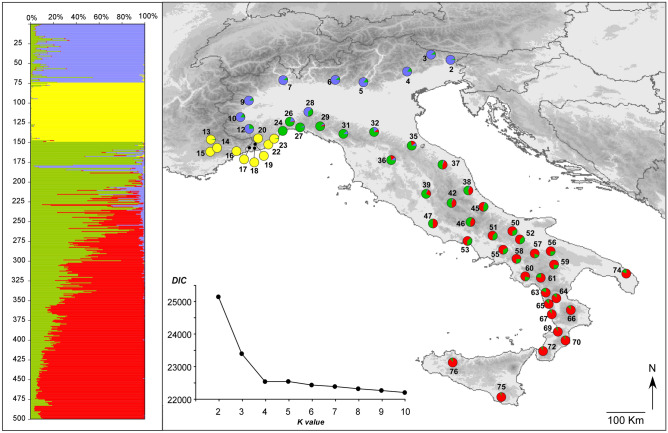
Genetic diversity feeds the evolutionary process and allows populations to adapt to environmental changes. However, we still lack a thorough understanding of why hotspots of genetic diversity are so 'hot'. Here, we analysed the relative contribution of bioclimatic stability and genetic admixture between divergent lineages in shaping spatial patterns of genetic diversity in the common toad Bufo bufo along the Italian peninsula. We combined population genetic, phylogeographic and species distribution modelling (SDM) approaches to map ancestral areas, glacial refugia, and secondary contact zones. We consistently identified three phylogeographic lineages, distributed in northern, central and southern Italy. These lineages expanded from their ancestral areas and established secondary contact zones, before the last interglacial. SDM identified widespread glacial refugia in peninsular Italy, sometimes located under the present-day sea-level. Generalized linear models indicated genetic admixture as the only significant predictor of the levels of population genetic diversity. Our results show that glacial refugia contributed to preserving both levels and patterns of genetic diversity across glacial-interglacial cycles, but not to their formation, and highlight a general principle emerging in Mediterranean species: higher levels of genetic diversity mark populations with substantial contributions from multiple genetic lineages, irrespective of the location of glacial refugia.
Conflict of interest statement
The authors declare no competing interests.
Figures


Similar articles
-
Unravelling the evolutionary history and future prospects of endemic species restricted to former glacial refugia.Mol Ecol. 2015 Oct;24(20):5267-83. doi: 10.1111/mec.13379. Epub 2015 Oct 12. Mol Ecol. 2015. PMID: 26346923
-
Multiple glacial refugia and contemporary dispersal shape the genetic structure of an endemic amphibian from the Pyrenees.Mol Ecol. 2020 Aug;29(15):2904-2921. doi: 10.1111/mec.15521. Epub 2020 Jul 18. Mol Ecol. 2020. PMID: 32563209
-
The effects of drift and selection on latitudinal genetic variation in Scandinavian common toads (Bufo bufo) following postglacial recolonisation.Heredity (Edinb). 2021 Apr;126(4):656-667. doi: 10.1038/s41437-020-00400-x. Epub 2021 Feb 9. Heredity (Edinb). 2021. PMID: 33564181 Free PMC article.
-
Evaluating signatures of glacial refugia for North Atlantic benthic marine taxa.Ecology. 2008 Nov;89(11 Suppl):S108-22. doi: 10.1890/08-0257.1. Ecology. 2008. PMID: 19097488 Review.
-
Back to the suture: the distribution of intraspecific genetic diversity in and around anatolia.Int J Mol Sci. 2011;12(6):4080-103. doi: 10.3390/ijms12064080. Epub 2011 Jun 20. Int J Mol Sci. 2011. PMID: 21747726 Free PMC article. Review.
Cited by
-
Verification of hotspots of genetic diversity in Korean population of Grateloupia asiatica and G. jejuensis (Rhodophyta) show low genetic diversity and similar geographic distribution.Genes Genomics. 2021 Dec;43(12):1463-1469. doi: 10.1007/s13258-021-01168-y. Epub 2021 Oct 25. Genes Genomics. 2021. PMID: 34697760
-
Genetic diversity and demography of Bufo japonicus and B. torrenticola (Amphibia: Anura: Bufonidae) influenced by the Quaternary climate.PeerJ. 2022 Jun 8;10:e13452. doi: 10.7717/peerj.13452. eCollection 2022. PeerJ. 2022. PMID: 35698618 Free PMC article.
-
The European Pine Marten Martes martes (Linnaeus, 1758) Is Autochthonous in Sicily and Constitutes a Well-Characterised Major Phylogroup within the Species (Carnivora, Mustelidae).Animals (Basel). 2022 Sep 23;12(19):2546. doi: 10.3390/ani12192546. Animals (Basel). 2022. PMID: 36230287 Free PMC article.
-
Testing assertions of widespread introgressive hybridization in a clade of neotropical toads with low mate selectivity (Rhinella granulosa species group).Heredity (Edinb). 2023 Jan;130(1):14-21. doi: 10.1038/s41437-022-00571-9. Epub 2022 Nov 5. Heredity (Edinb). 2023. PMID: 36333595 Free PMC article.
-
The Silk roads: phylogeography of Central Asian dice snakes (Serpentes: Natricidae) shaped by rivers in deserts and mountain valleys.Curr Zool. 2023 Mar 14;70(2):150-162. doi: 10.1093/cz/zoad008. eCollection 2024 Apr. Curr Zool. 2023. PMID: 38726254 Free PMC article.
References
-
- Hoffmann AA, Sgró CM. Climate change and evolutionary adaptation. Nature. 2011;470:479–485. - PubMed
Publication types
MeSH terms
Substances
LinkOut - more resources
Full Text Sources
Other Literature Sources
