. 2021 Jan 8;11(1):94.
doi: 10.1038/s41598-020-77398-z.

Extracellular vesicle-associated repetitive element DNAs as candidate osteosarcoma biomarkers

Affiliations

Extracellular vesicle-associated repetitive element DNAs as candidate osteosarcoma biomarkers

Linda Cambier et al. Sci Rep. .

Abstract

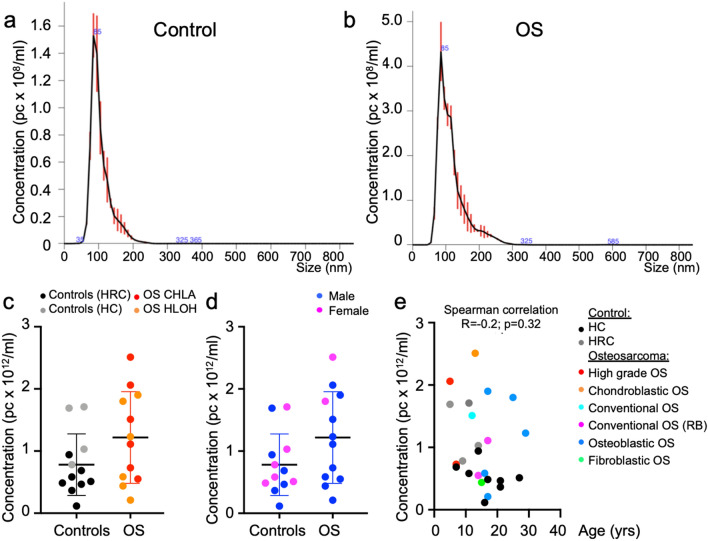
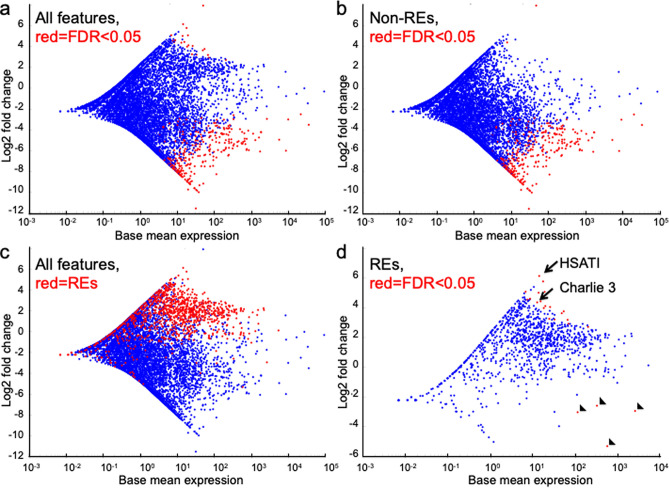
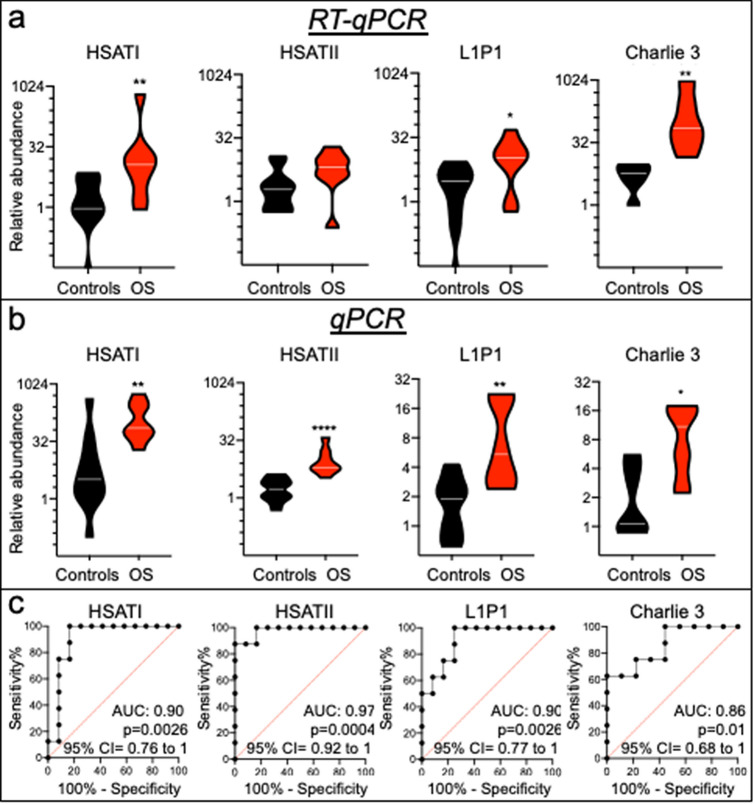
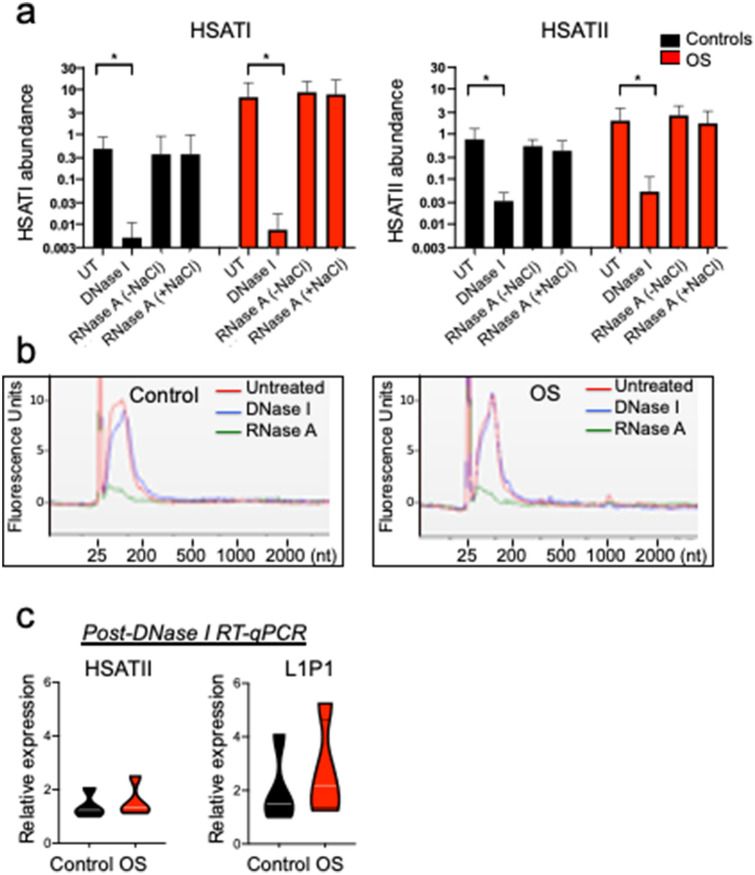
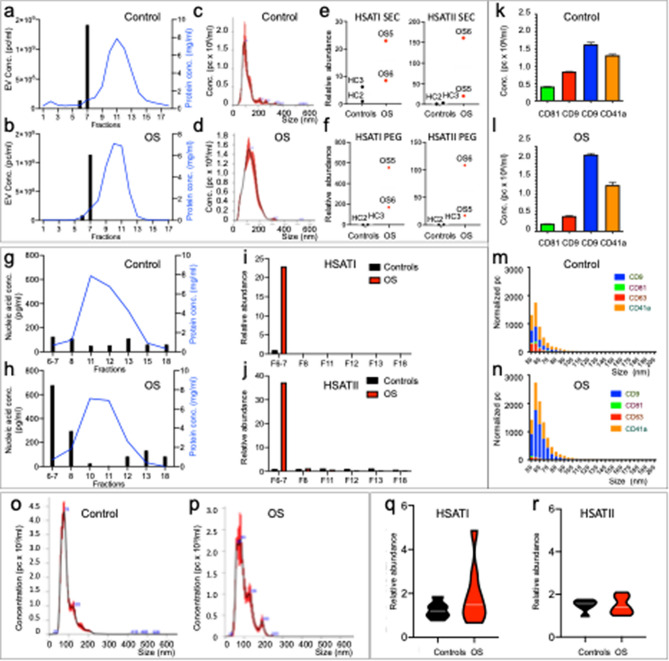
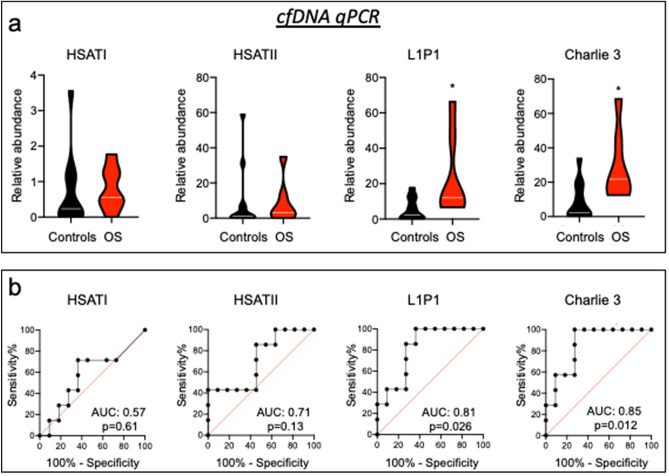
Osteosarcoma (OS) is the most common malignant bone tumor in children and young adults. Despite that high-risk factors have been identified, no test for early detection is available. This study aimed to identify circulating nucleic acid sequences associated with serum extracellular vesicle (EV) preparations at the time of OS diagnosis, as a step towards an OS early detection assay. Sequencing of small nucleic acids extracted from serum EV preparations revealed increased representation of diverse repetitive element sequences in OS patient versus control sera. Analysis of a validation cohort using qPCR of PEG-precipitated EV preparations revealed the over-representation of HSATI, HSATII, LINE1-P1, and Charlie 3 at the DNA but not RNA level, with receiver operating characteristic (ROC) area under the curve (AUC) ≥ 0.90. HSATI and HSATII DNAs co-purified with EVs prepared by precipitation and size exclusion chromatography but not by exosome immunocapture, indicative of packaging in a non-exosomal complex. The consistent over-representation of EV-associated repetitive element DNA sequences suggests their potential utility as biomarkers for OS and perhaps other cancers.


Conflict of interest statement

D.C. and L.C. are inventors on a U.S. provisional patent, Children’s Hospital Los Angeles as applicant, relating to REPETITIVE ELEMENT DNAS.

Figures

Figure 1
Figure 1
Patient EV preparation characteristics. (a,b) Representative control (a) and OS (b) particle size distributions in preparations used for nucleic acid extraction and sequencing, as defined by nanoparticle tracking (NanoSight). (c,d) Dot plots representing EV concentration of preparations from sera of OS patients (n = 12) and controls from hereditary retinoblastoma sibling (HRC, n = 4), and unrelated healthy (HC, n = 8) and color-coded by source (c) and sex (d). Lines represent mean and standard deviation. Groups were compared using twotailed, unpaired, Mann Whitney U test; *p < 0.05. (e) Dot plots of EV concentration versus donor age and color coded according to OS type. Spearman’s correlation (r) between EV concentration and donor age was not significant (p = 0.32).
Figure 2
Figure 2
Over-representation of repetitive elements in OS EV–associated sequences. MA plot for sequence features differentially represented in control and OS serum EV preparations as defined by TEtranscripts analysis 1. (a) Differentially represented single-copy genes and repetitive elements (REs), significantly differentially represented in red. (b) Differentially represented single-copy genes, significantly differentially represented in red. (c) Differentially represented single-copy genes in blue and REs in red. (d) Differentially represented REs, significantly differentially represented in red. Arrows, the significantly over-represented HSATI and Charlie 3. Arrowheads, significantly under-represented REs. Significantly differentially represented defined by FDR < 0.05, Wald test.
Figure 3
Figure 3
Over-representation of repetitive elements in OS compared to control EV preparations in a validation cohort. (a) Violin plots representing relative abundance of HSATI, HSATII, L1P1 and Charlie 3 by RT-qPCR of control (n = 6–11) and OS (n = 7–8) serum EV preparations. RT-qPCR was normalized against C. elegans external spike-in miR-39–3p RNA. White lines represent median. (b) Violin plots representing relative abundance of HSATI, HSATII, L1P1 and Charlie 3 DNA by qPCR, in the absence of reverse transcription, in control (n = 12) and OS (n = 8) serum EV preparations. qPCR was performed on equal proportions of nucleic acid extracted from 200 ul of OS and control serum. White lines represent median. (c) Diagnostic value of HSATI, HSATII, L1P1 and Charlie 3 DNA sequences in serum OS preparations. ROC curves were generated using data in (b). Groups were compared using twotailed, unpaired, Mann Whitney U test; *p < 0.05; **p < 0.01; ***p < 0.001.
Figure 4
Figure 4
Repetitive element sensitivity to DNase in EV preparations. (a) Abundance of HSATI and HSATII sequences determined by qPCR in control (n = 4) and OS (n = 4) serum EV preparations isolated with PEG and either untreated (UT) or pretreated with DNase I or RNase A with or without NaCl prior to nucleic acid extraction. Treated groups were compared to untreated groups using unpaired Kruskal–Wallis test with uncorrected Dunn’s test where each comparison stands alone; *, p < 0.05. Error bars represent standard deviation of biological replicates. (b) Bioanalyzer electropherograms of equal proportions of nucleic acids prepared from 200 ul of representative control and OS EV preparations that were untreated or treated with DNase I or RNase A prior to nucleic acid extraction. (c) Violin plots representing relative abundance of HSATII, L1P1 and Charlie 3 by RT-qPCR in control (n = 4) and OS (n = 4) serum EV preparations pre-treated with DNAse I. qPCR was normalized against C. elegans external spike-in miR-39–3p RNA. White lines represent median.
Figure 5
Figure 5
Co-purification of OS-associated repetitive element DNAs with EVs in size exclusion chromatography but not exosome immunoaffinity capture. (a,b) Representative protein concentration (blue line) and EV concentration (black bars) elution profiles from control (a) and OS (b) serum separated by size exclusion chromatography (SEC). (c,d) Representative size distribution of control (c) and OS (d) serum EV particles in pooled fractions 6 and 7 analyzed by nanoparticle-tracking. (e,f) Relative abundance of HSATI and HSATII DNA in two control and two OS SEC (e) and PEG (f) EV fractions as defined by qPCR. (g,h) Representative protein concentration (blue line) and nucleic acid concentration (black bars) of pooled EV fraction (F6-7) and selected non-EV fractions (F8, F11, F12, F13 and F18) from the same representative control (g) and OS (h) SEC separations as in (a) and (b). (i,j) Abundance of HSATI (i) and HSATII (j) in pooled EV fractions 6–7 and non-EV fractions on one control and one OS SEC analysis as evaluated by qPCR. (kn) SP-IRIS analyses by ExoView of EVs isolated by CD9-immunoaffinity capture. (k,l) Representative concentration of control (k) and OS (l) fluorescent EV particles immunocaptured on the CD9, CD81 and CD63 antibody spots. Results depict the mean of the measurement of triplicate spots ± SEM, subtracted for IgG spot values and adjusted by dilution factor. (m,n) Representative size distribution of control (m) and OS (n) label-free EV particles immunocaptured on the CD9, CD81 and CD63 antibody spots. Results depict the mean of the measurement of triplicate spots ± SEM, subtracted for IgG spot values. (o,p) Size distribution and particle number of control (o) and OS (p) EVs isolated by CD9 immunoaffinity capture and analyzed by nanoparticle-tracking. (q,r) Violin plots representing abundance of HSATI (m) and HSATII (n) of control (n = 6) and OS (n = 8) immunoaffinity capture of CD9-positive exosomes evaluated by qPCR. White lines represent median. Groups were compared using twotailed, unpaired, Mann Whitney U test; *p < 0.05. Similar CD81 immunoaffinity capture results in Supplementary Fig. 11.
Figure 6
Figure 6
Human satellite sequences not enriched in total cfDNA in OS patient sera. (a) Violin plots representing relative abundance of HSATI, HSATII, L1P1 and Charlie 3 by qPCR of control (n = 11) and OS (n = 7) whole serum. White lines represent median. (b) Diagnostic value of HSATI, HSATII, L1P1 and Charlie 3 in OS patient whole serum. ROC curves were generated using data in (a). Groups were compared using two-tailed, unpaired, Mann Whitney U test; *p < 0.05.

Similar articles

Cited by

References

    1. Damron TA, Ward WG, Stewart A. Osteosarcoma, chondrosarcoma, and Ewing's sarcoma: national cancer data base report. Clin. Orthop. Relat. Res. 2007;459:40–47. doi: 10.1097/BLO.0b013e318059b8c9. - DOI - PubMed
    1. Ottaviani G, Jaffe N. The epidemiology of osteosarcoma. Cancer Treat Res. 2009;152:3–13. doi: 10.1007/978-1-4419-0284-9_1. - DOI - PubMed
    1. Dorfman HD, Czerniak B. Bone cancers. Cancer. 1995;75:203–210. doi: 10.1002/1097-0142(19950101)75:1+<203::aid-cncr2820751308>3.0.co;2-v. - DOI - PubMed
    1. Misaghi A, Goldin A, Awad M, Kulidjian AA. Osteosarcoma: a comprehensive review. SICOT J. 2018;4:12. doi: 10.1051/sicotj/2017028. - DOI - PMC - PubMed
    1. Kleinerman RA, et al. Risk of new cancers after radiotherapy in long-term survivors of retinoblastoma: an extended follow-up. J. Clin. Oncol. 2005;23:2272–2279. doi: 10.1200/JCO.2005.05.054. - DOI - PubMed

Publication types