. 2021 Jan 8;11(1):258.
doi: 10.1038/s41598-020-79437-1.

An experimental pig model with outer retinal degeneration induced by temporary intravitreal loading of N-methyl-N-nitrosourea during vitrectomy

Affiliations

An experimental pig model with outer retinal degeneration induced by temporary intravitreal loading of N-methyl-N-nitrosourea during vitrectomy

Kwang-Eon Choi et al. Sci Rep. .

Abstract

We aimed to develop an outer retinal degeneration pig model induced by temporary intravitreal loading of N-methyl-N-nitrosourea (MNU) during vitrectomy. In a preliminary experiment involving 5 mini-pig cases to determine the appropriate concentration of MNU, the vitreous cavity of each eye was filled with 4, 8, 10, 12, or 16 mg/mL MNU for 10 min, which was then replaced with a balanced salt solution. Multimodal examinations including spectral-domain optical coherence tomography (OCT) images and full-field electroretinography (ffERG) were obtained at baseline and week 2, week 6, and week 12. The retinal degeneration was classified according to the amplitudes of a dark adaptive (DA) 10.0 a-wave amplitude. The degree of moderate retinal degeneration was defined as DA 10.0 a-wave amplitude ≥ 10% and < 60% of baseline amplitude. The degree of severe degeneration was defined as DA 10.0 a-wave amplitude < 10% of baseline amplitude, noise, or flat signal. Hematoxylin and eosin staining and immunohistochemistry were performed at week 12. The main experiments were conducted first with 10 cases of 5 mg/mL and later with 13 cases of 10 mg/mL. In the preliminary experiment, degree of outer retinal degeneration increased with MNU concentration. Use of 4, 8, 10, 12, and 16 mg/mL MNU showed no, moderate, severe, severe, and atrophic changes, respectively. In the main experiments, there were 9 cases of moderate retinal degeneration and 1 case of severe degeneration in 5 mg/mL MNU group. Two cases of moderate degeneration and 11 of severe degeneration were recorded in 10 mg/mL group. Mean thickness of total retina, inner nuclear layer, and outer nuclear layer decreased at week 2 in both groups. The mean amplitudes on ffERG decreased at week 2. The ffERG and OCT findings did not change from week 2 to week 6 or week 12. The results of staining supported those of ffERG and OCT. Temporal MNU loading in a vitrectomized pig-eye model induced customized outer retinal degeneration with changing the concentration of MNU.


Conflict of interest statement

The authors declare no competing interests.

Figures
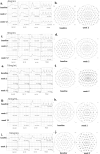
Figure 1
Figure 1
ffERG and mfERG findings of the retina in one case of each 4 mg/mL, 8 mg/mL, 10 mg/mL, 12 mg/mL, and 16 mg/mL MNU. (a) The DA 10.0 a-wave amplitude at baseline and week 2 was 25.4 µV and 26.1 µV, respectively, in the 4 mg/mL MNU case. (b) mfERG in the 4 mg/mL MNU showed no signal flattening or noise signals at week 2. (c) The DA 10.0 a-wave amplitude at baseline and week 2 was 89.3 µV and 10.1 µV, respectively, in the 8 mg/mL MNU case. The amplitudes in scotopic and photopic ffERG decreased at week 2, but no signal was flat or appeared as noise, especially in photopic ffERG. (d) mfERG in the 8 mg/mL MNU case showed focal noise signal and signal flattening at week 2. (e) The DA 10.0 a-wave amplitude at baseline and week 2 was 38.6 µV and 6.21 µV, respectively, in a 10 mg/mL MNU case. All signals of ffERG showed nearly flat down signals or noise signals at week 2. (f) The mfERG in a 10 mg/mL MNU case showed only noise signals at week 2. (g) The DA 10.0 a-wave amplitude at baseline and week 2 was 61.3 µV and 5.67 µV, respectively, in a 12 mg/mL MNU case. All signals of ffERG showed nearly flat down signals or noise signals at week 2. (h) The mfERG in a 12 mg/mL MNU case showed only noise signals at week 2. (i,j) Both ffERGs and mfERGs in a 16 mg/mL MNU case showed noise signals at week 2. ffERG full field electroretinogram, MNU N-methyl-N-nitrosourea, DA dark adaptive, mfERG multifocal electroretinogram.
Figure 2
Figure 2
SD-OCT findings of the retina in one case of each 4 mg/mL, 8 mg/mL, 10 mg/mL, 12 mg/mL, and 16 mg/mL MNU at baseline and week 2. (aj) Each magnified SD-OCT image of the case is on the right sided and shown with a dashed-line box. (a,b) OCT image of the 4 mg/mL MNU case showed intact GCL, INL, ONL, photoreceptor layer, and RPE at baseline and week 2. (c,d) OCT image of the 8 mg/mL MNU case at week 2 showed an intact ganglion cell layer and retinal pigment epithelium. The boundary of the INL and ONL became indistinct compared with the SD-OCT image at baseline (c). The EZ representing the photoreceptor layer became obscure. OCT images of the 8 mg/mL MNU case at weeks 6 and 12 weeks showed no change compared with that at week 2 (Supplementary Fig. 2). (e,f) On the OCT, unlike baseline, the EZ and ONL were indistinguishable at week 2 in the 10 mg/mL MNU case. However, there was no significant decrease in INL thickness. (g,h) On the OCT, unlike baseline, the EZ and ONL were indistinguishable at week 2 in the 12 mg/mL MNU case. In addition, there was a decrease in INL thickness. The total retinal thickness of the 12 mg/mL MNU case at week 6 was thinner than at week 2 (Supplementary Fig. 2). (i,j) After week 2, the retina melted and induced retinal detachment in SD-OCT images of the 16 mg/mL MNU case. SD-OCT spectral domain optical coherence tomography, MNU N-methyl-N-nitrosourea, GCL ganglion cell layer, IPL inner plexiform layer, INL inner nuclear layer, OPL outer plexiform layer, ONL outer nuclear layer, EZ ellipsoid zone, RPE retinal pigment epithelium.
Figure 3
Figure 3
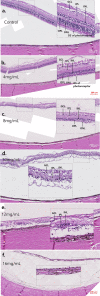
H&E staining image of the retina in cases of 4 mg/mL, 8 mg/mL, 10 mg/mL, 12 mg/mL, and 16 mg/mL MNU. (af) Each magnified H&E staining image of the case is on the right-side shown with a dashed-line box. (a) H&E staining of the control case. Each count number of ONL, INL, and GCL in dotted enlarged area was 586, 298, and 56, respectively. (b) In H&E staining of the 4 mg/mL MNU case, all layers including the INL, GCL, and NFL were nearly intact. However, the thickness of OPL and ONL decreased. ONL (4 nuclear layers) of the 4 mg/mL MNU case is thinner than ONL (7–8 nuclear layers) of control (a). Each count number of ONL, INL, and GCL in dotted enlarged area was 247, 285, and 50, respectively. (c) In H&E staining of the 8 mg/mL MNU case, the outermost photoreceptors remained to some degree but at severely reduced density. The density of ONL and INL also was reduced, but the GCL was relatively intact. Each count number of ONL, INL, and GCL in dotted enlarged area was 43, 216, and 40, respectively. (d) In H&E staining of the 10 mg/mL MNU case, ONL cells were rarely observed among INL or combined INL with ONL cells. Each count number of ONL, INL, and GCL in dotted enlarged area was 0, 87, and 16, respectively. (e) In H&E staining of the 12 mg/mL MNU case, ONL cells were rarely observed among INL or combined INL with ONL cells. Each count number of ONL, INL, and GCL in dotted enlarged area was 0, 74, and 15, respectively. (f) In H&E staining of the 16 mg/mL MNU case, proliferative vitreoretinopathy and retinal detachment were observed, and the entire layer was extremely thin. MNU N-methyl-N-nitrosourea, GCL ganglion cell layer, IPL inner plexiform layer, INL inner nuclear layer, OPL outer plexiform layer, ONL outer nuclear layer, OS outer segment.
Figure 4
Figure 4
The immunohistochemistry findings of the retina in cases of 4 mg/mL, 8 mg/mL, 10 mg/mL, 12 mg/mL, and 16 mg/mL MNU. (a) The normal immunohistochemistry of a control case. Rhodopsin staining and PNA staining showed well-stained rod and cone cells (each percentage of the stained layer = 12.86% and 13.51%). (b) Immunohistochemistry of the 4 mg/mL MNU case. NeuN stain showed intact ganglion cells and co-staining of photoreceptors. PKC-α staining showed intact bipolar cells, and GFAP staining showed nearly normal muller cells. Rhodopsin staining showed intact rod cells (the percentage of the stained layer = 10.03%), and PNA staining showed intact cone cells (the percentage of the stained layer = 12.44%). RPE65 staining showed intact RPE and co-staining of photoreceptors. c. Immunohistochemistry of the 8 mg/mL MNU case. NeuN staining showed intact GCL. PKC-α staining showed nearly intact bipolar cells but co-staining of few photoreceptors. GFAP staining showed mildly increased stained cells. Rhodopsin staining and PNA staining showed few stains of rod and cone cells, respectively (each percentage of the stained layer = 0.23% and 3.22%). RPE65 showed nearly intact RPE cells with co-staining of a few photoreceptors. (d) Immunohistochemistry of the 10 mg/mL MNU case. NeuN and PKC-α stainings showed ganglion cells and bipolar cells, respectively. There was no co-staining of photoreceptors with NeuN staining. GFAP stain showed increased staining. Rhodopsin and PNA staining showed rarely stained rod and cone cells (each percentage of the stained layer = 0.43% and 2.11%).with co-staining of RPE cells. RPE 65 showed intact RPE cells. (e) Immunohistochemistry of the 12 mg/mL MNU case. NeuN and PKC-α stainings showed ganglion cells and bipolar cells, respectively. There was no co-staining of photoreceptors with NeuN staining. GFAP stain showed increased staining. Rhodopsin and PNA staining showed no stained rod and cone cells (each percentage of the stained layer = 0% and 0%) with co-staining of RPE cells. RPE 65 showed intact RPE cells. (f) Immunohistochemistry of the 16 mg/mL MNU case. RPE staining showed nearly intact RPE cells, and GFAP staining showed a marked increase in stained lesions. MNU N-methyl-N-nitrosourea, GCL ganglion cell layer, IPL inner plexiform layer. Each percentage of the stained layers was evaluated by the stained area/all layer area using ImageJ software (1.53a version, National Institutes of Health, Bethesda, MD, USA).
Figure 5
Figure 5
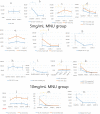
The ffERG results of the 5 mg/mL MNU group (n = 10) and the 10 mg/mL MNU group (n = 13). (ag) The ffERG of the 5 mg/mL MNU group. (a,b) The 5 mg/mL MNU group showed delayed implicit time of b-waves in dark adaptive (DA) 0.01 ERG at weeks 2 and and 6, but the change was not statistically significant. The 5 mg/mL MNU group showed significant decrease of b-wave in dark adaptive (DA) 0.01 ERG from baseline to week 2 (p = 0.028). (c,d) In DA 10.0 ERG, the 5 mg/mL MNU group showed delay of a- and b-waves at week 2 (p = 0.028, 0.018, respectively) and appeared to recover somewhat at week 6, but the amplitudes of both a- and b-waves decreased at week 2 (p = 0.005, 0.005, respectively) and remained unchanged from week 2 to week 6. (e,f) In light adaptive (LA) 3.0 ERG, the 5 mg/mL MNU group showed decrease in a- and b-wave amplitudes at week 2 (p = 0.018, 0.018, respectively) and remained unchanged at week 6, but the implicit time of both a- and b-waves did not change during follow-up periods. (g) The flicker amplitude in the 5 mg/mL MNU group showed a decrease in amplitude at week 2 (p = 0.028), but further decrease was not statistically significant. (h–n) The ffERG results of the 10 mg/mL MNU group. (h,i) The b implicit time in the DA 0.01 ERG did not show a significant change in the 10 mg/mL MNU group, but the amplitude was nearly flattened at week 2 (p = 0.008) and showed no recovery or variation after. (j,k) The b implicit time in the DA 10 ERG show a significant change in the 10 mg/mL MNU group (p = 0.008, 0.008, respectively), and the amplitude nearly flattened at week 2 (p = 0.008, 0.008, respectively) and showed no recovery or variation after that point. (l,m) In LA 3.0 ERG, the 10 mg/mL MNU group showed delay of a- and b-waves at week 2 (p = 0.008, 0.008, respectively), and showed decreased amplitudes of the a- and b wave at week 2 (p = 0.008, 0.021, respectively), and there was no significant change at week 6 or 12 compared with the results of week 2. (n) The flicker amplitude in the 10 mg/mL MNU group showed a decrease in amplitude at week 2 (p = 0.008) and then remained decreased. ffERG full field electroretinogram, MNU N-methyl-N-nitrosourea, DA dark adaptive, LA light adaptive.
Figure 6
Figure 6
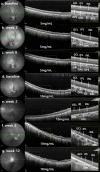
SD-OCT finding of each representative case of 5 mg/mL MNU and 10 mg/mL MNU. (a–g) Each magnified SD-OCT image of the case is from the right side and shown with a dashed-line box. (ac). OCT images of a representative case with moderate outer degeneration in the 5 mg/mL group. (a,b) OCT images at week 2 showed intact GCL and RPE. The EZ was indistinguishable at week 2. In addition, there was a decrease in OPL thickness. (c) OCT images remained stable at week 6 compared with the results of week 2. (d–g) OCT images of a representative case with severe outer degeneration in 10 mg/mL group. (d,e) On the OCT, unlike baseline, the ellipsoid zone was indistinguishable at week 2. In addition, there was a decrease in INL thickness and ONL. (f,g) OCT image at weeks 6 and 12 showed no significant change compared with the results of week 2. However, the signal intensity of OCT decreased at week 12 due to anterior capsular opacity. SD-OCT spectral domain optical coherence tomography, GCL ganglion cell layer, IPL inner plexiform layer, INL inner nuclear layer, OPL outer plexiform layer, ONL outer nuclear layer, EZ ellipsoid zone, RPE retinal pigment epithelium.
Figure 7
Figure 7
Sequential changes of total retinal thickness, inner nuclear layer thickness, and outer nuclear layer thickness. (a) In the 5 mg/mL MNU group, there was a significant decrease in INL, ONL, and total retinal thickness in week 2. After week 2, the subsequent changes were minimal and remained so until week 6. (b) In a 10 mg/mL MNU group, there was also a significant decrease of INL, ONL, and total retinal thickness at week 2. After week 2, the subsequent changes were minimal and remained decreased through week 12. TRL total retinal thickness, INL inner nuclear layer, ONL outer nuclear layer, MNU N-methyl-N-nitrosourea).
Figure 8
Figure 8
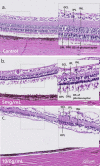
H&E staining of a representative case of the 5 mg/mL MNU and 10 mg/mL MNU groups. (a–c) Each magnified H&E staining image was from the right side and is shown with a dashed-line box. (a) H&E staining of a control case. Each count number of ONL, INL, and GCL in dotted enlarged area was 201, 307, and 49, respectively. (b) H&E staining of a representative case with moderate outer degeneration in the 5 mg/mL group. In H&E staining, all the INL, GCL and NFL were intact, but the density of INL and GCL decreased. Each count number of ONL, INL, and GCL in dotted enlarged area was 100, 91, and 16, respectively. (c) H&E staining of a representative case with severe outer degeneration in the 10 mg/mL group. ONL cells were rarely observed among INL or combined INL with ONL cells. Each count number of ONL, INL, and GCL in dotted enlarged area was 0, 112, and 29, respectively. H&E hematoxylin and eosin, GCL ganglion cell layer, IPL inner plexiform layer, INL inner nuclear layer, OPL outer plexiform layer, ONL outer nuclear layer, OS outer segment, RPE retinal pigment epithelium.
Figure 9
Figure 9
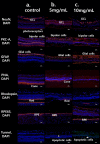
The immunohistochemistry findings of each representative case of 5 mg/mL MNU group and 10 mg/mL MNU group. (a) The normal immunohistochemistry of a control case. Rhodopsin staining and PNA staining showed well-stained rod and cone cells (each percentage of the stained layer = 15.22% and 14.86%). (b) The immunohistochemistry of a representative case with moderate outer degeneration in the 5 mg/mL group. NeuN staining showed intact ganglion cells and the co-staining of photoreceptors. PKC-α staining showed intact bipolar cells, and GFAP staining showed nearly normal muller cells. Rhodopsin staining showed severely decreased rod cells, and PNA staining showed focal intact cone cells (each percentage of the stained layer = 4.11% and 14.15%). RPE65 staining showed intact RPE and rare co-staining of photoreceptors. There was no apoptotic cell in Tunnel staining. (c) The immunohistochemistry of a representative case with severe outer degeneration in 10 mg/mL group. NeuN and PKC-α stainings showed intact ganglion cells and bipolar cells, respectively. There was no co-staining of photoreceptors in NeuN staining. GFAP staining showed increased staining, especially in the outer retina. Rhodopsin and PNA staining showed relatively rare stained lesions of rod and cone cells (each percentage of the stained layer = 0% and 0%) with co-staining of RPE cells. RPE 65 staining showed intact RPE cells and Tunnel staining showed no stained lesions. RPE retinal pigment epithelium, GCL ganglion cell layer, IPL inner plexiform layer. Each percentage of the stained layers was evaluated by the stained area/all layer area using ImageJ software (1.53a version, National Institutes of Health, Bethesda, MD, USA).
Figure 10
Figure 10
Measurement of total retinal thickness, inner nuclear layer thickness, and outer retinal thickness. Total retinal thickness, inner nuclear layer thickness, and outer retinal thickness were measured at 10 points with 1 mm intervals on the visual streak. Magnified SD-OCT images are shown with a white or yellow dashed-line box. Magnified SD-OCT images in yellow dashed-line boxes show estimated total retina thickness, inner nuclear thickness, and outer retinal thickness. Magnified SD-OCT images in white dashed-line boxes show NFL, GCL, IPL, INL, OPL, EZ, and PRE. NFL nerve fiber layer, GCL ganglion cell layer, IPL inner plexiform layer, INL inner nuclear layer, OPL outer plexiform layer, EZ ellipsoid zone, RPE retinal pigment epithelium.

Similar articles

Cited by

References

    1. Fariss RN, Li ZY, Milam AH. Abnormalities in rod photoreceptors, amacrine cells, and horizontal cells in human retinas with retinitis pigmentosa. Am. J. Ophthalmol. 2000;129:215–223. doi: 10.1016/s0002-9394(99)00401-8. - DOI - PubMed
    1. Milam AH, Li ZY, Fariss RN. Histopathology of the human retina in retinitis pigmentosa. Prog. Retin Eye Res. 1998;17:175–205. doi: 10.1016/S1350-9462(97)00012-8. - DOI - PubMed
    1. Brandli A, Luu CD, Guymer RH, Ayton LN. Progress in the clinical development and utilization of vision prostheses: An update. Eye Brain. 2016;8:15–25. doi: 10.2147/EB.S70822. - DOI - PMC - PubMed
    1. Rizzo JF., 3rd Update on retinal prosthetic research: The Boston Retinal Implant Project. J. Neuroophthalmol. 2011;31:160–168. doi: 10.1097/WNO.0b013e31821eb79e. - DOI - PubMed
    1. Chow AY, et al. The artificial silicon retina microchip for the treatment of vision loss from retinitis pigmentosa. Arch. Ophthalmol. 2004;122:460–469. doi: 10.1001/archopht.122.4.460. - DOI - PubMed

Publication types

Substances

LinkOut - more resources