

High planting density induces the expression of GA3-oxidase in leaves and GA mediated stem elongation in bioenergy sorghum
- PMID: 33420129
- PMCID: PMC7794234
- DOI: 10.1038/s41598-020-79975-8
High planting density induces the expression of GA3-oxidase in leaves and GA mediated stem elongation in bioenergy sorghum
Abstract
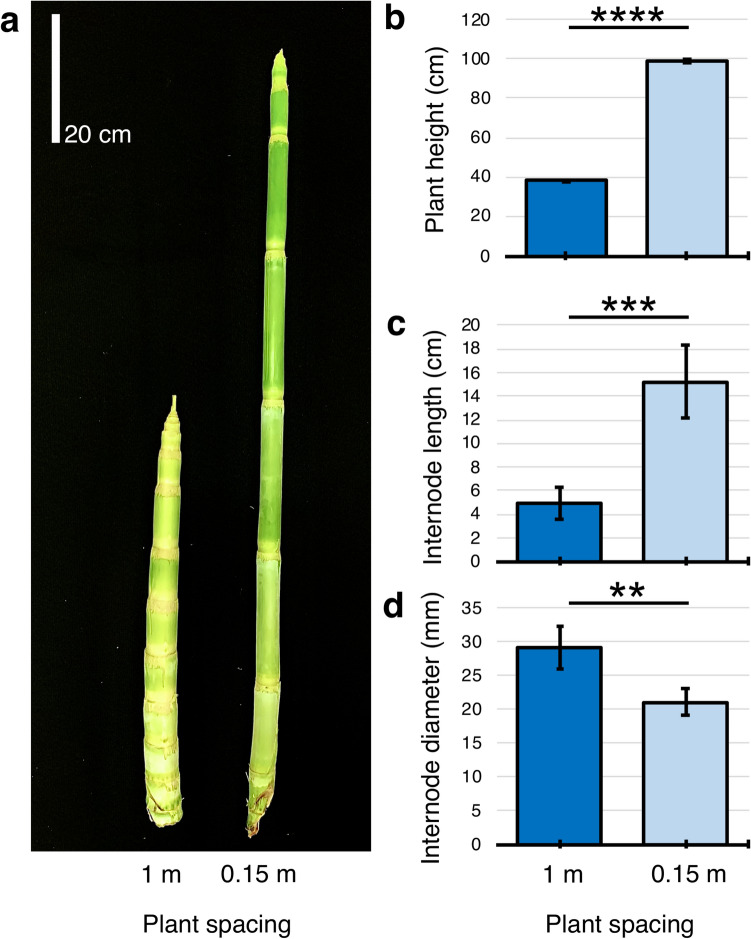
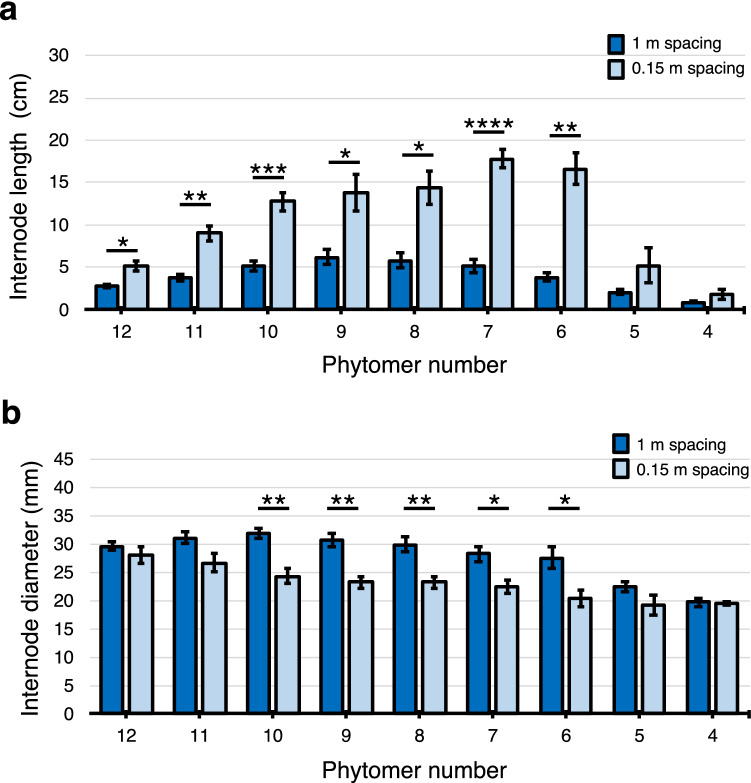
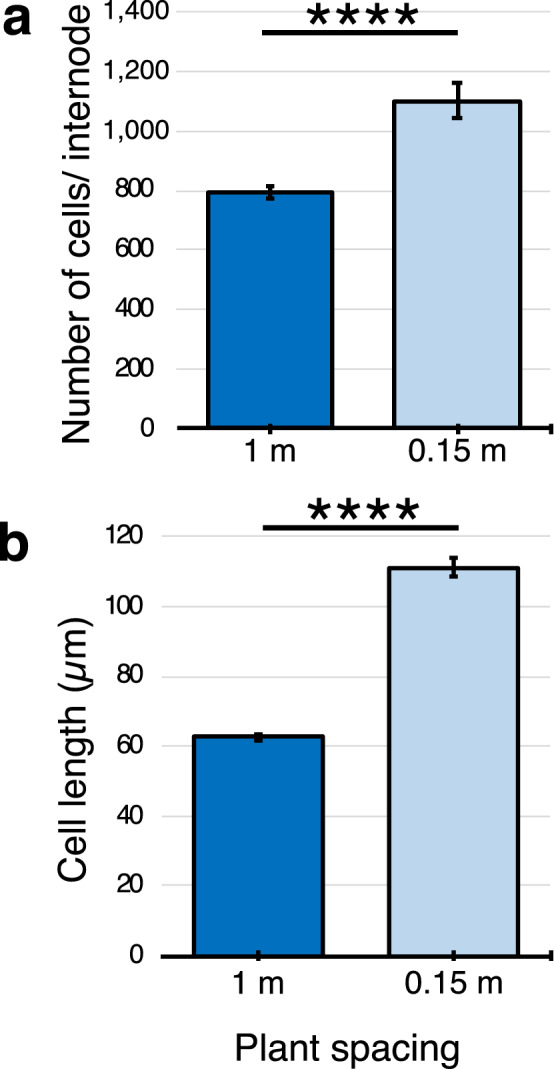
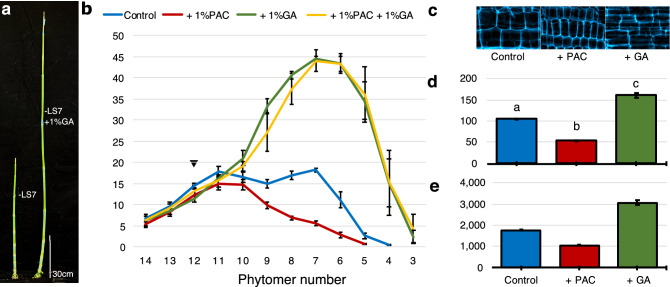
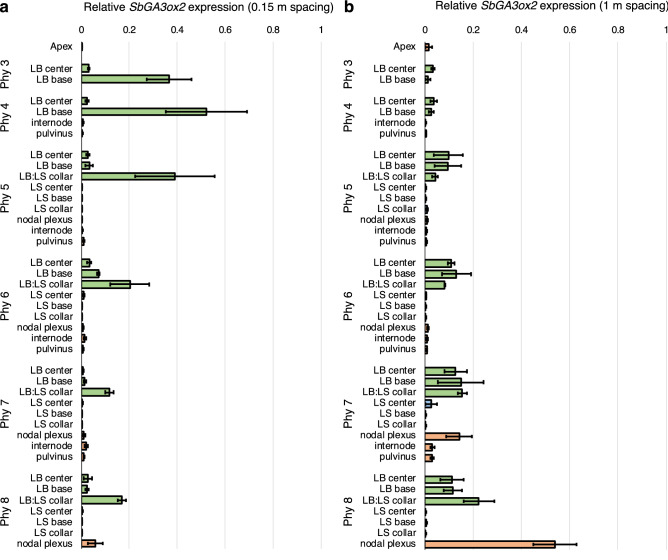
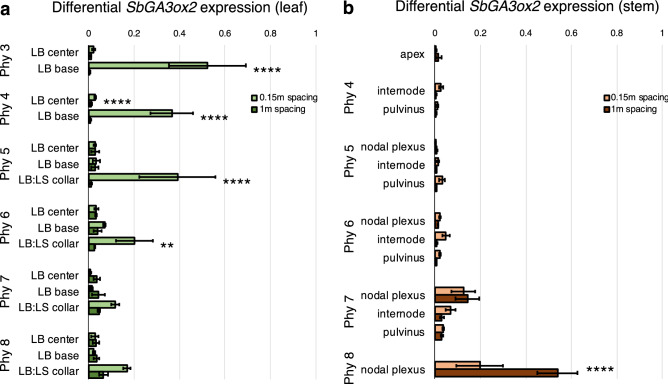
The stems of bioenergy sorghum hybrids at harvest are > 4 m long, contain > 40 internodes and account for ~ 80% of harvested biomass. In this study, bioenergy sorghum hybrids were grown at four planting densities (~ 20,000 to 132,000 plants/ha) under field conditions for 60 days to investigate the impact shading has on stem growth and biomass accumulation. Increased planting density induced a > 2-fold increase in sorghum internode length and a ~ 22% decrease in stem diameter, a typical shade avoidance response. Shade-induced internode elongation was due to an increase in cell length and number of cells spanning the length of internodes. SbGA3ox2 (Sobic.003G045900), a gene encoding the last step in GA biosynthesis, was expressed ~ 20-fold higher in leaf collar tissue of developing phytomers in plants grown at high vs. low density. Application of GA3 to bioenergy sorghum increased plant height, stem internode length, cell length and the number of cells spanning internodes. Prior research showed that sorghum plants lacking phytochrome B, a key photoreceptor involved in shade signaling, accumulated more GA1 and displayed shade avoidance phenotypes. These results are consistent with the hypothesis that increasing planting density induces expression of GA3-oxidase in leaf collar tissue, increasing synthesis of GA that stimulates internode elongation.
Conflict of interest statement
The authors declare no competing interests.
Figures
Similar articles
-
The AGCVIII kinase Dw2 modulates cell proliferation, endomembrane trafficking, and MLG/xylan cell wall localization in elongating stem internodes of Sorghum bicolor.Plant J. 2021 Feb;105(4):1053-1071. doi: 10.1111/tpj.15086. Epub 2020 Dec 12. Plant J. 2021. PMID: 33211340 Free PMC article.
-
Breadfruit (Artocarpus altilis) gibberellin 2-oxidase genes in stem elongation and abiotic stress response.Plant Physiol Biochem. 2016 Jan;98:81-8. doi: 10.1016/j.plaphy.2015.11.012. Epub 2015 Nov 23. Plant Physiol Biochem. 2016. PMID: 26646240
-
Shade signals alter the expression of circadian clock genes in newly-formed bioenergy sorghum internodes.Plant Direct. 2020 Jun 25;4(6):e00235. doi: 10.1002/pld3.235. eCollection 2020 Jun. Plant Direct. 2020. PMID: 32607464 Free PMC article.
-
Uncoupling light quality from light irradiance effects in Helianthus annuus shoots: putative roles for plant hormones in leaf and internode growth.J Exp Bot. 2007;58(8):2145-57. doi: 10.1093/jxb/erm068. Epub 2007 May 8. J Exp Bot. 2007. PMID: 17490995
-
The knockout of Gγ subunit HvGS3 by CRISPR/Cas9 gene editing improves the lodging resistance of barley through dwarfing and stem strengthening.Theor Appl Genet. 2025 Feb 27;138(3):61. doi: 10.1007/s00122-025-04853-8. Theor Appl Genet. 2025. PMID: 40014102 Review.
Cited by
-
Bulbil initiation: a comprehensive review on resources, development, and utilisation, with emphasis on molecular mechanisms, advanced technologies, and future prospects.Front Plant Sci. 2024 Apr 8;15:1343222. doi: 10.3389/fpls.2024.1343222. eCollection 2024. Front Plant Sci. 2024. PMID: 38650701 Free PMC article. Review.
-
Strigolactones modulate stem length and diameter of cherry rootstocks through interaction with other hormone signaling pathways.Front Plant Sci. 2023 Feb 9;14:1092654. doi: 10.3389/fpls.2023.1092654. eCollection 2023. Front Plant Sci. 2023. PMID: 36844087 Free PMC article.
-
Divergent Mechanisms of Internode Elongation in Response to Far-Red in Two Rose Genotypes.Plants (Basel). 2025 Apr 3;14(7):1115. doi: 10.3390/plants14071115. Plants (Basel). 2025. PMID: 40219183 Free PMC article.
-
Transcriptome sequencing revealed the regulation of stem internode length associated with mechanical harvesting in three tea varieties.Front Plant Sci. 2025 Jun 30;16:1626915. doi: 10.3389/fpls.2025.1626915. eCollection 2025. Front Plant Sci. 2025. PMID: 40661767 Free PMC article.
-
Bioenergy sorghum stem density increases threefold following internode elongation due to continued accumulation of lignified cell walls and complex regulation of genes involved in cell wall biosynthesis.Biotechnol Biofuels Bioprod. 2025 Jun 4;18(1):58. doi: 10.1186/s13068-025-02659-w. Biotechnol Biofuels Bioprod. 2025. PMID: 40468397 Free PMC article.
References
-
- Alexandratos, N. & Bruinsma, J. World agriculture towards 2030/2050: The 2012 revision. (2012).
Publication types
MeSH terms
Substances
LinkOut - more resources
Full Text Sources
Other Literature Sources
